Gold & Silver Forecasts: Both Shining


I think it was March when I turned bullish on gold & silver. This was before COVID-19, so I had to factor in the impact from the pandemic since turning bullish. I was expecting this to be a good year for gold & silver even without the pandemic, but COVID-19 only makes for a more bullish case.
I have always said that I am waiting for an imminent once in a lifetime bull market in gold & silver. So, I have been waiting for a run at new highs and beyond. In March, it felt like we were ready to make that run, and this pandemic only reinforces my outlook. Below is a chart of corporate profits versus the value of corporate stocks. The disconnect that already existed has only been exasperated. Thus, the stock market will be overvalued for months to come.
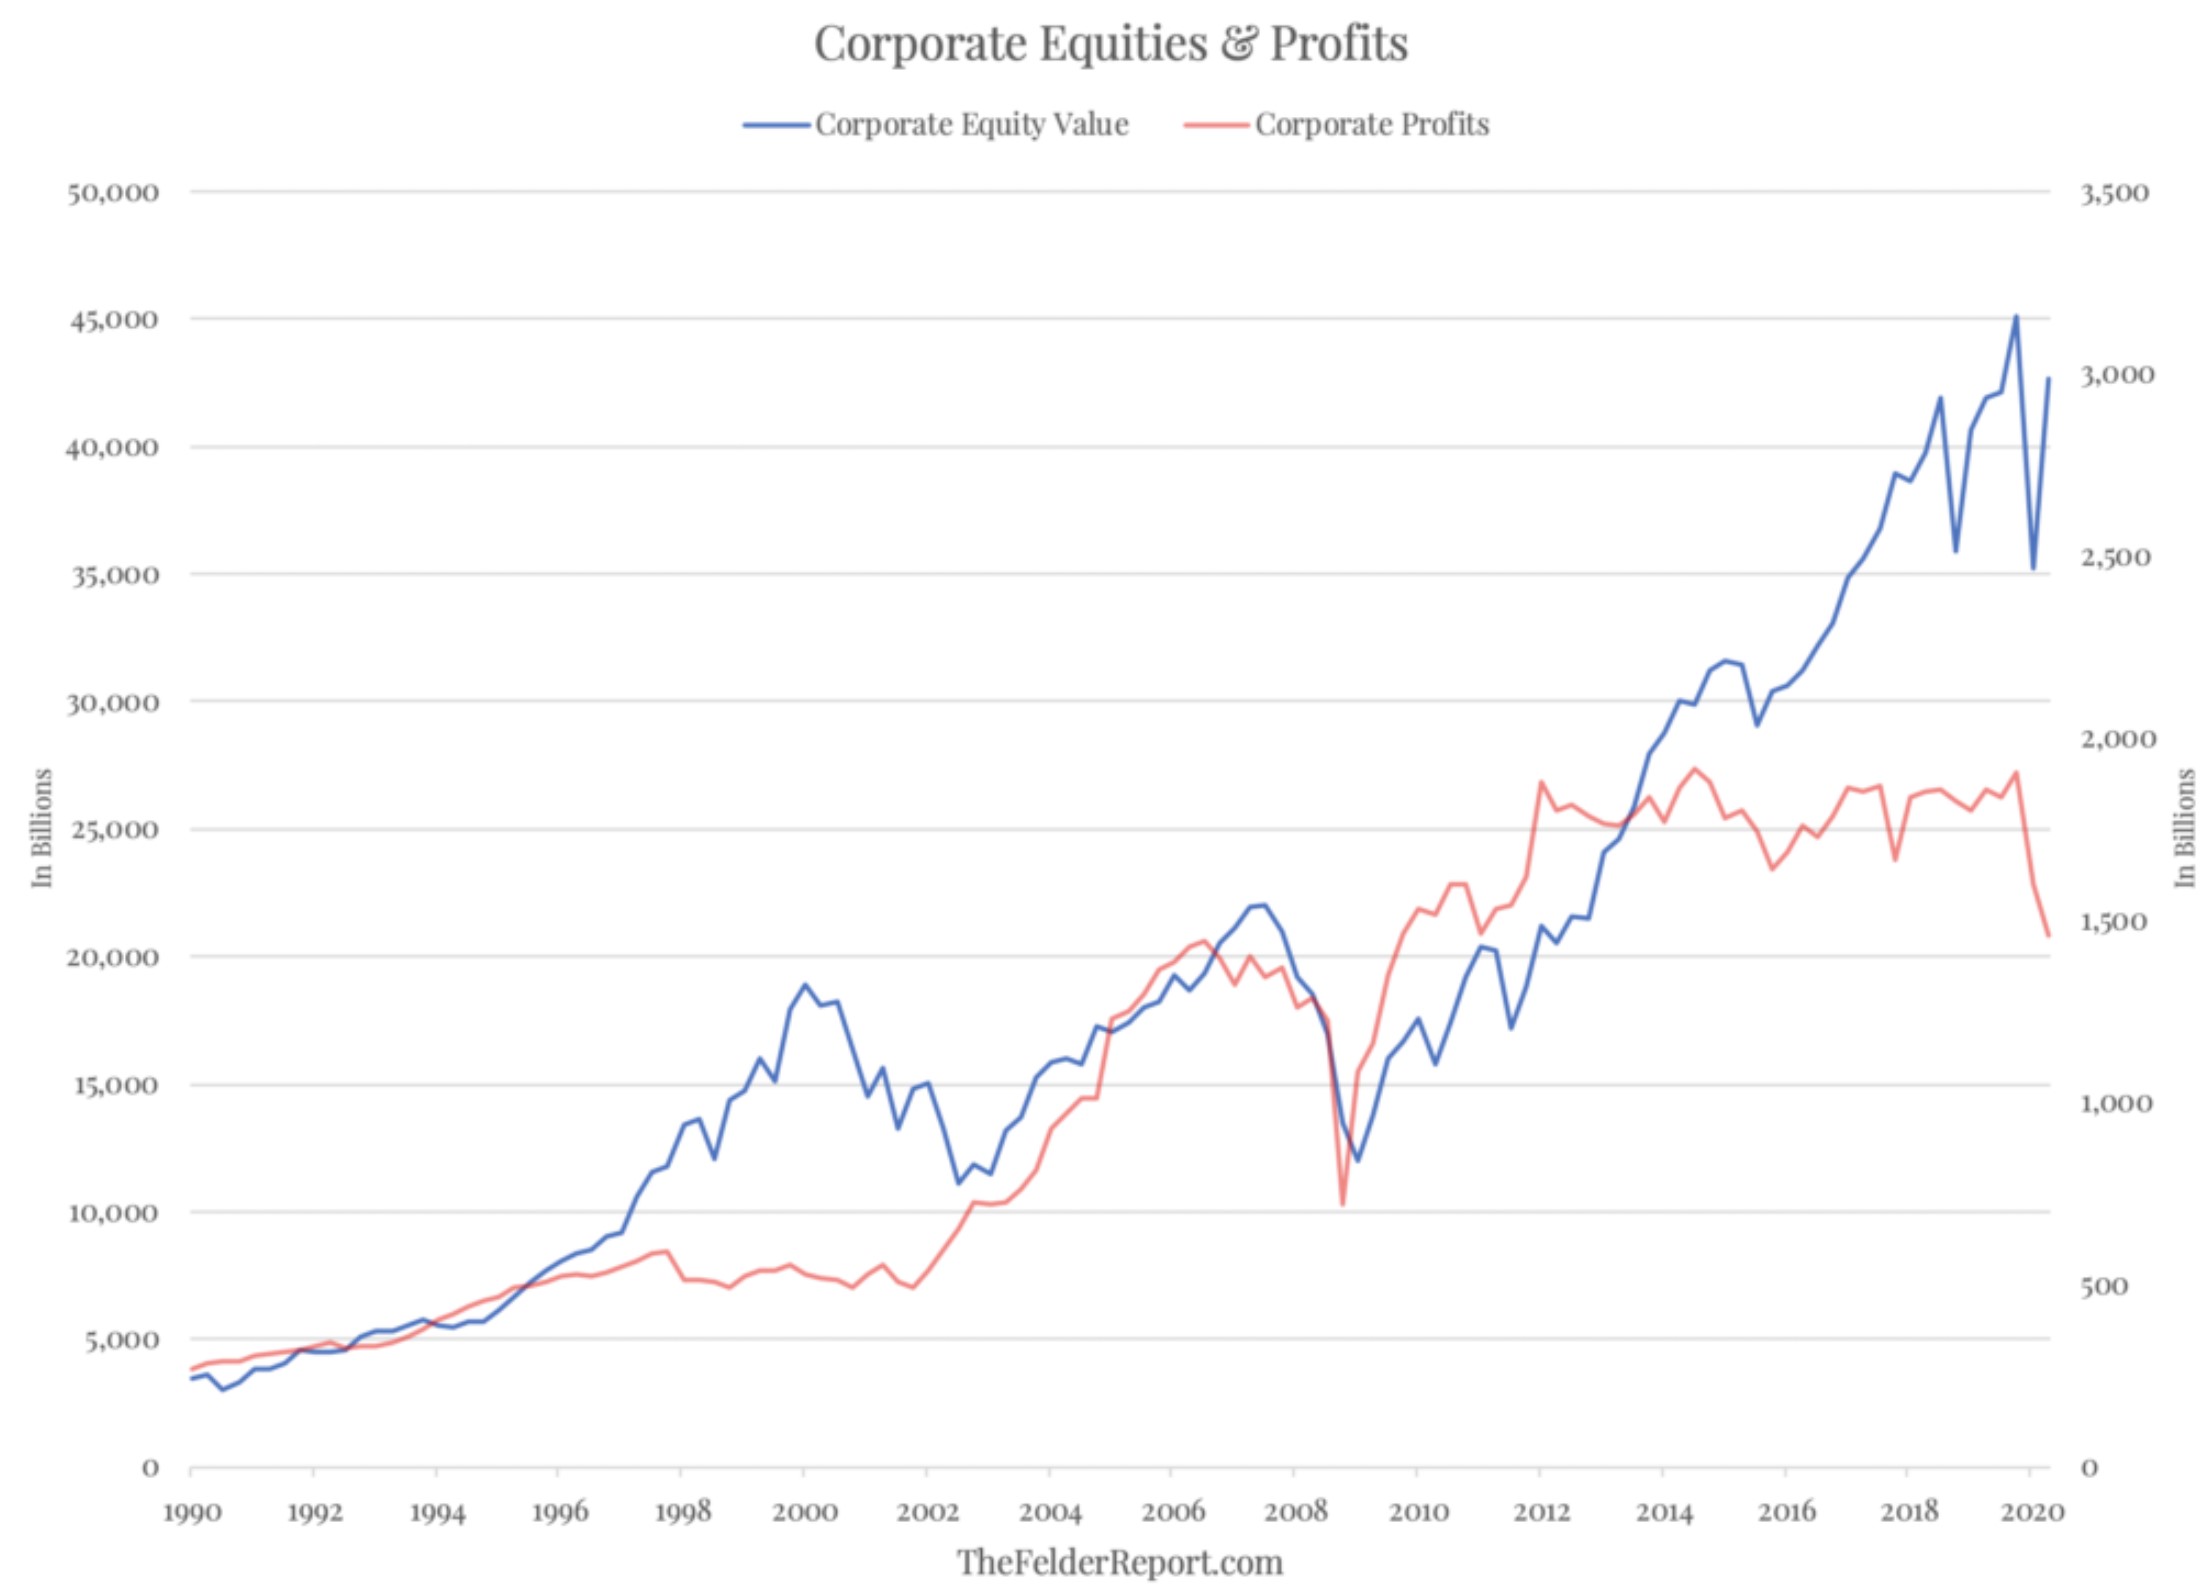
The chart above implies that we will likely get a stock market crash at some point, probably sometime this year. The Fed will do whatever is necessary to prop it up, but this should only help gold & silver. Many are expecting the miners to get crushed along with the market if we do get a crash, and that will likely happen, but perhaps not as deep as many are expecting. Why? Because gold is currently showing strength from a number of factors that are not likely to go away.
If the market does crash, I am not expecting gold to crash like it did in 2008. It might drop around $100, but $200 seems improbable. There are too many factors propping up gold. Let’s look at them. First, the Fed is printing money at an unprecedented rate. Second, we have negative real rates. Third, the fear-trade is in effect and driving gold demand. In my opinion, these three factors are significant.
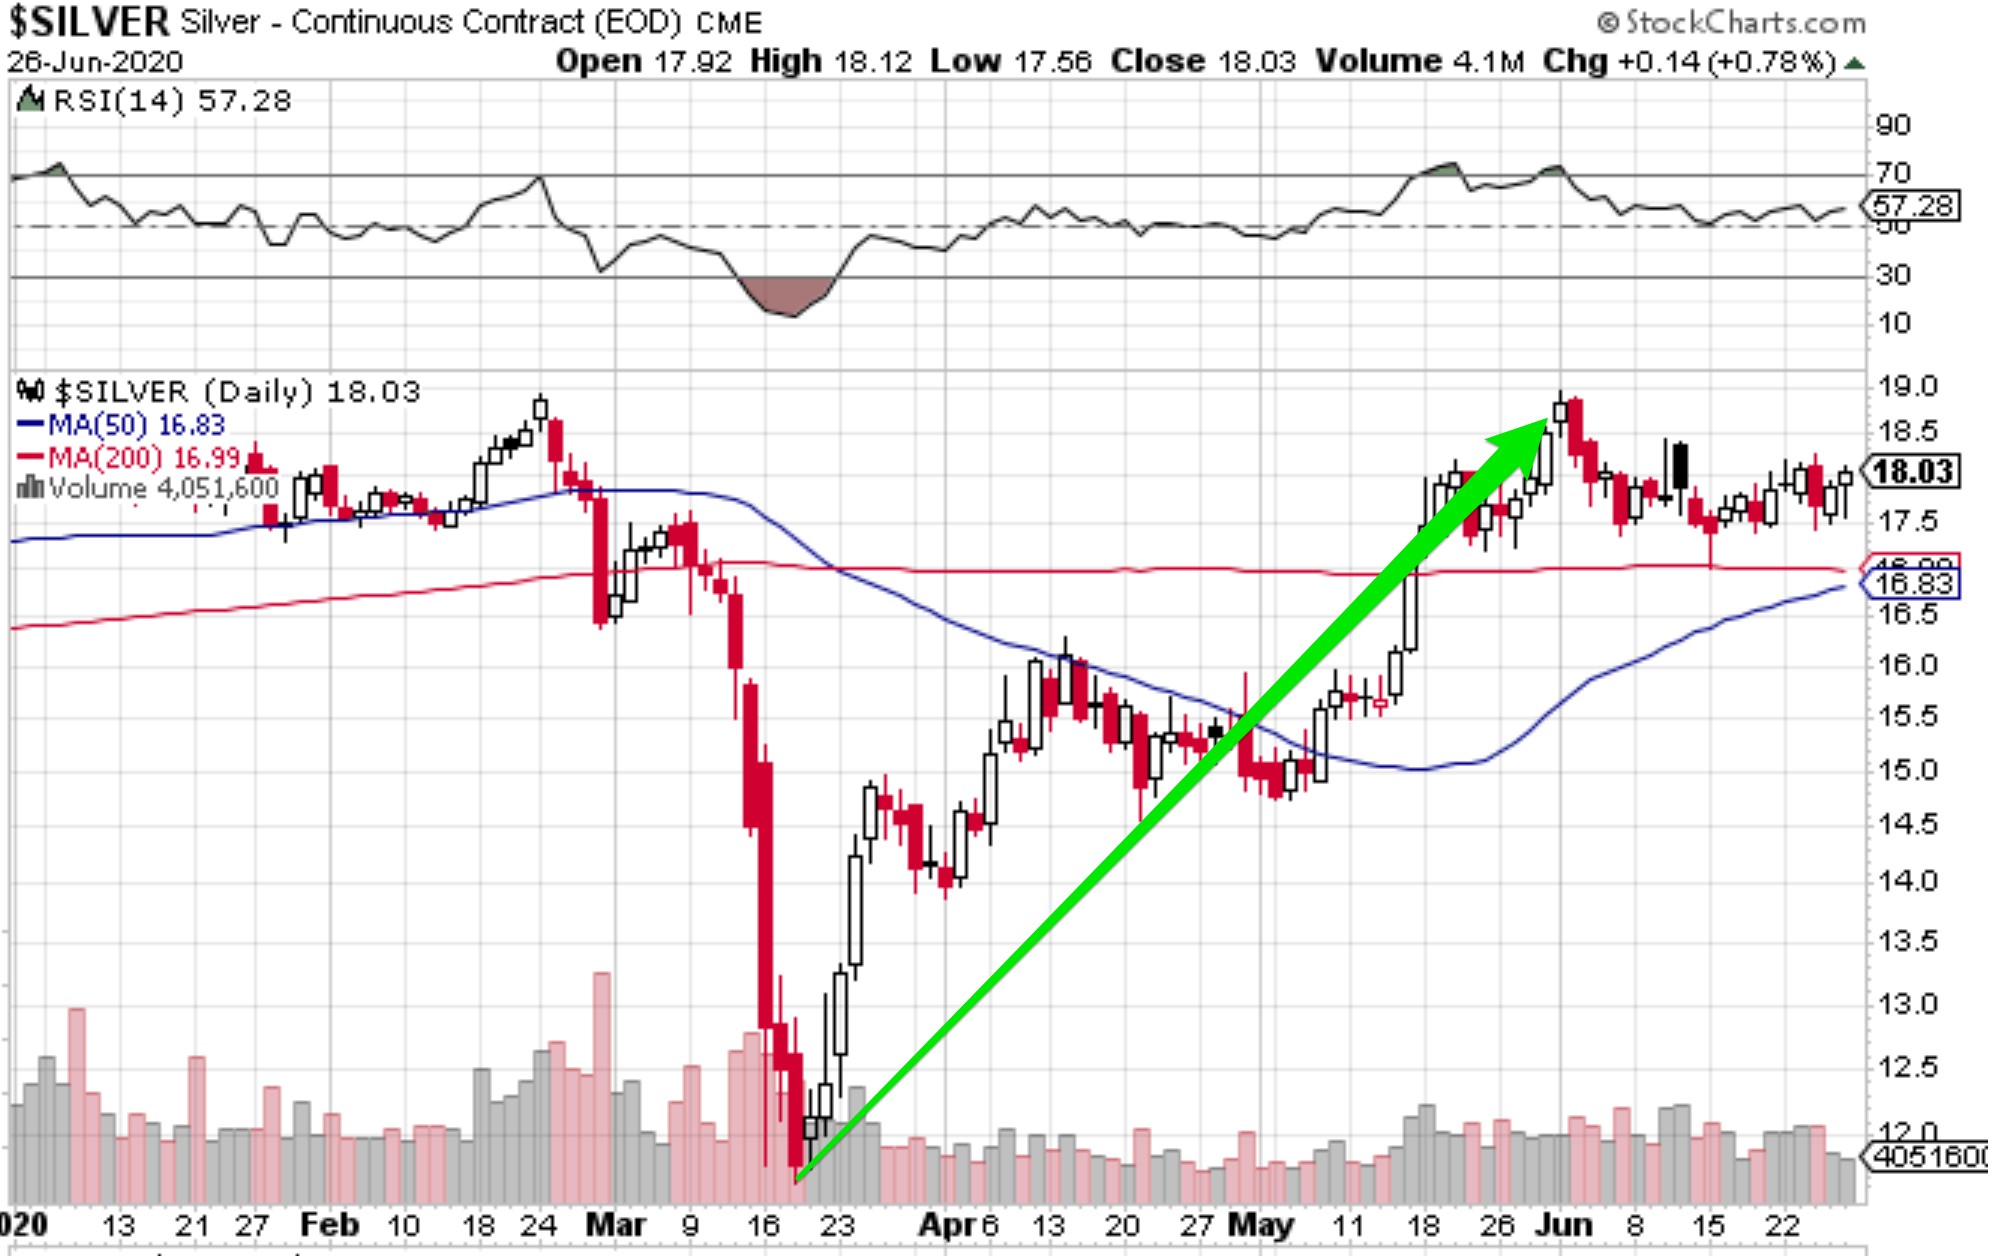
A $100 to $200 drop in gold won’t kill the miners. They will have a short-term correction, and then gold will bounce back and head higher. At least that is my expectation. Last month, I said that silver was waiting for a correction in the market (S&P 500). However, the pandemic has lowered the silver supply, and investors are gobbling it up. Silver is starting to make its move. I’m expecting to see $18.50 in July or August. That is the indicator for a bull market in silver, although $18.50 is the starting point. The bull market in silver won’t be at full speed until around $23.
Silver, Gold’s Little Sis Waiting in the Wings
On the silver chart above, silver bottomed at $11.64 on my birthday (March 18th). It then went on a run to $18.50 in late May. But, as you should know, that is a very important resistance level for silver. Sure enough, for the month of June, it could not get above $18.50. The banksters have been keeping it below $18 and away from $18.50.
The last Friday close of June was above $18 ($18.03), and this occurred when the S&P 500 was down 2.5%. This was the first significant de-coupling of gold & silver since the March crash. Also, if you look at the last seven weekly candles in the silver chart above, only one was red. Silver is strong at the moment and ready to break out.
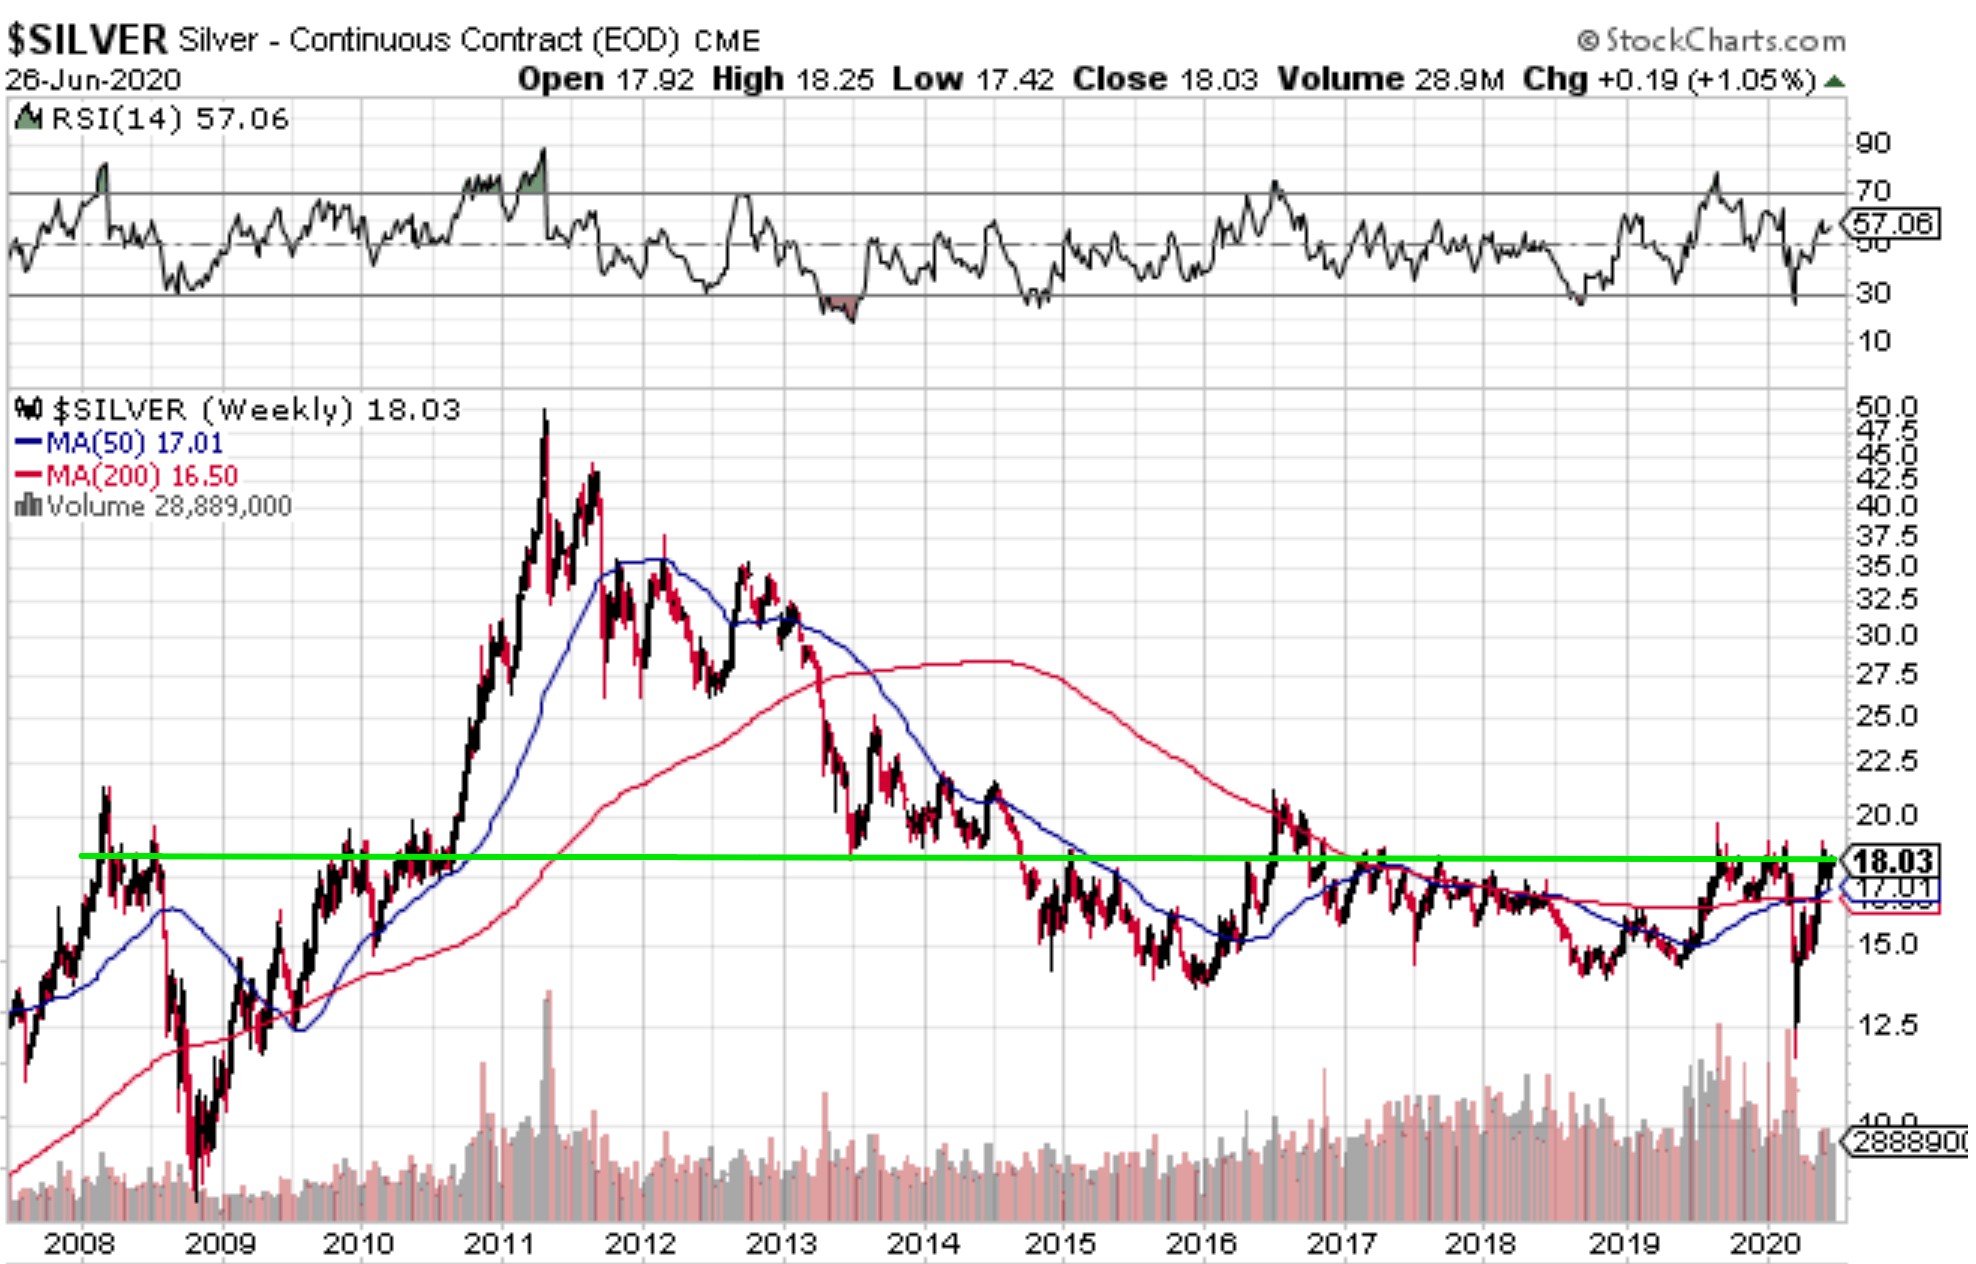
To remind you of the importance of $18/$18.50, here is the weekly chart from 2007. It’s a thing of beauty. Notice where silver created a base in 2009/2010 before blasting off to $49. Then notice the massive base from 2014 until today. Your jaw should drop.
So, while gold is the leader, who I call big brother, silver is little sis. She is always waiting for big brother to clear the way and say that the coast is clear. Then little sis takes off and leaves her brother in her wake. That’s about to happen. The GSR (gold silver ratio) has dropped from 122 (an ATH) to just below 100, but is soon going contract quickly down to 80. After we get to 80, I expect the GSR to trend below 50.
Let’s assume that when gold reaches $2000, silver will reach $30. That would be a GSR of 66. Perhaps that is a bit optimistic, considering that the GSR is about 100 today. However, the last time gold was at $1935, silver was at $49, which was a GSR of 39! So, we still have huge leverage in silver that is possible.
While silver has been trying to get through $18 and $18.50, gold has been trying to get above $1800. It almost feels like these are the levels the banksters are defending. Here is the weekly gold chart since 2007. Clearly, it has broken out of its basing channel. I don’t think we will go back into that channel anytime soon, perhaps several years.
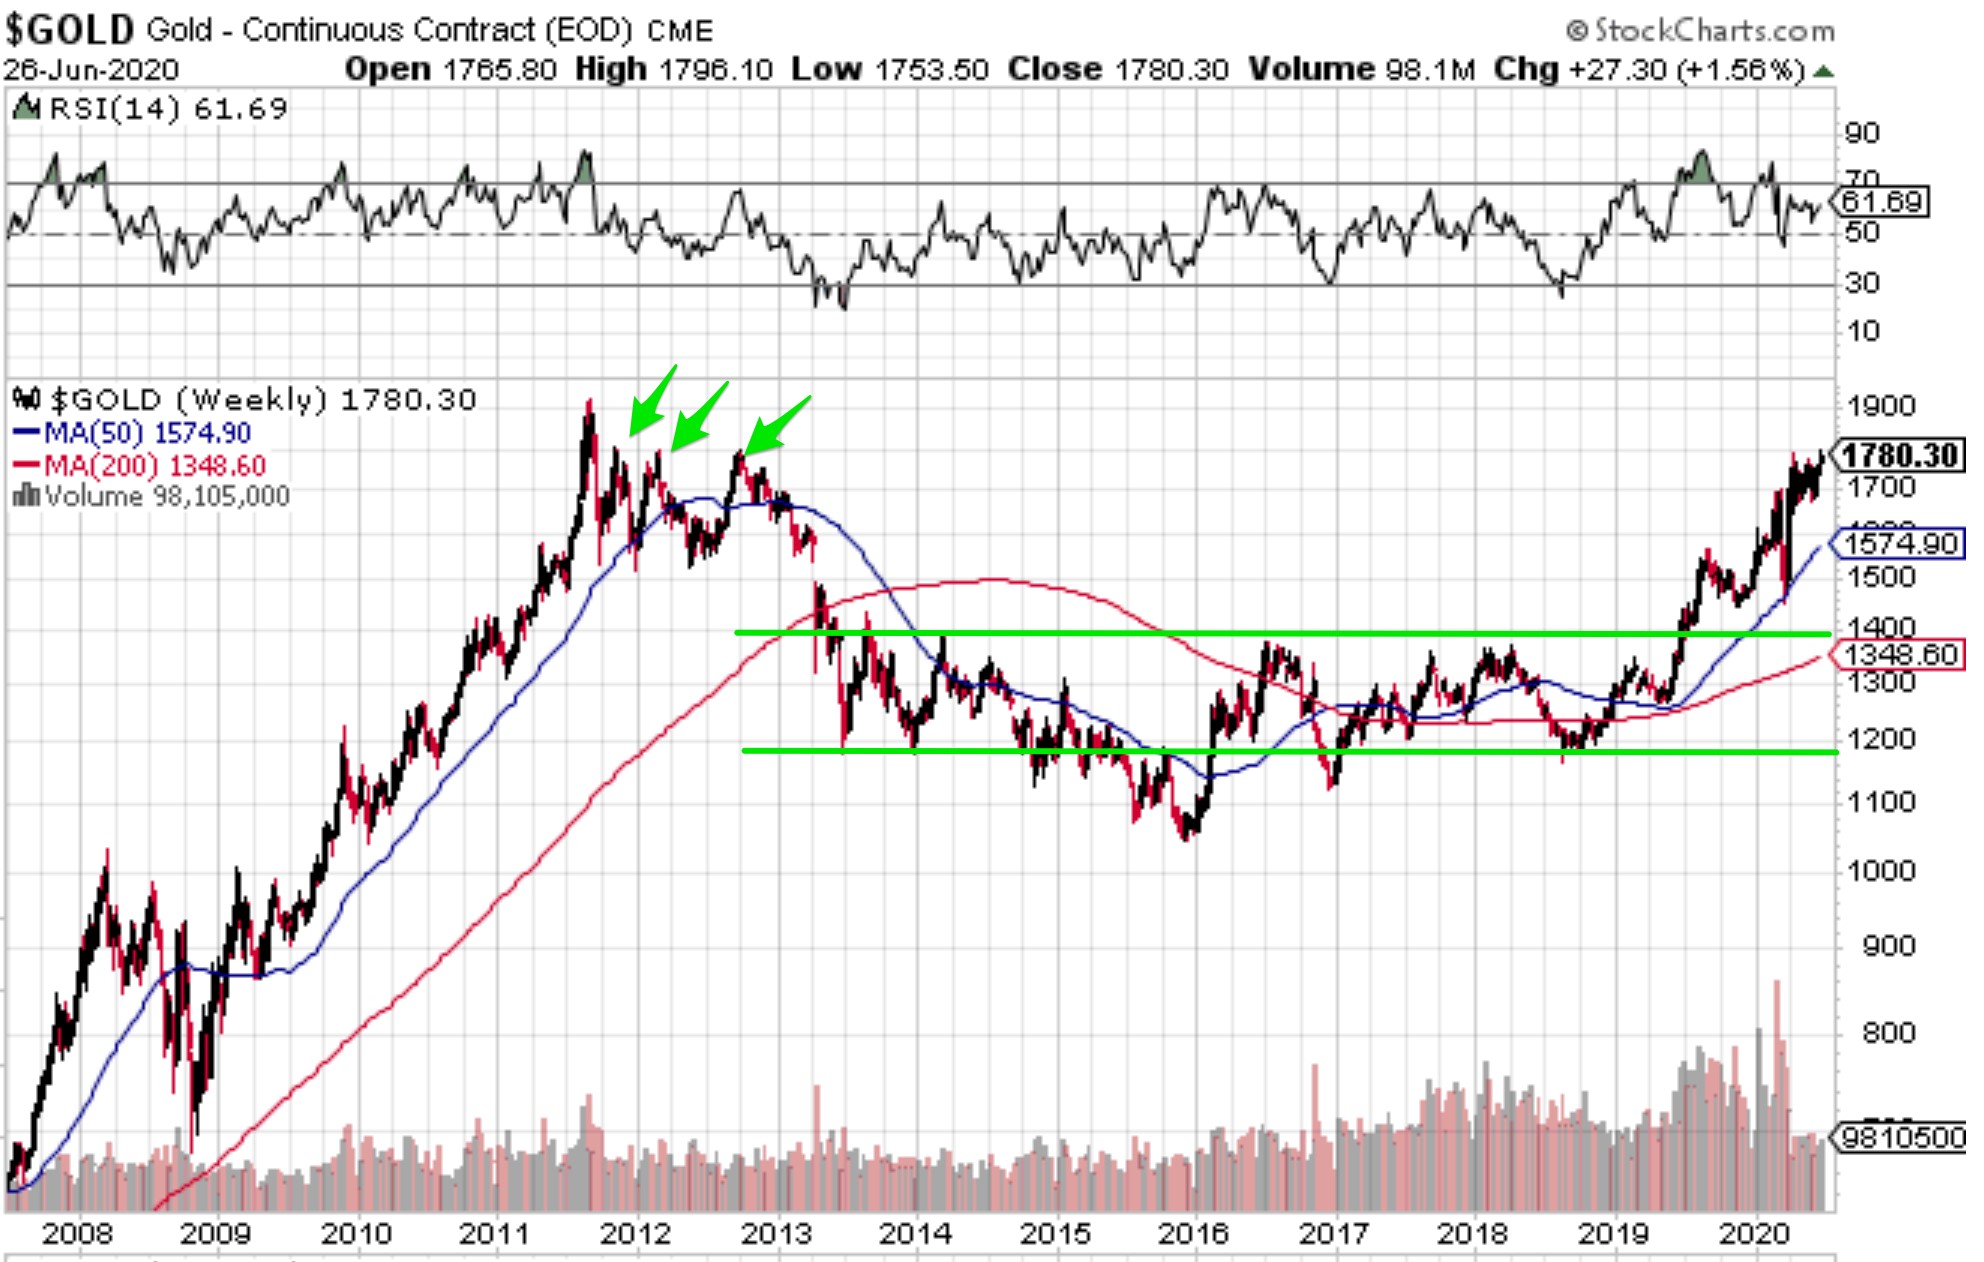
Gold & Silver Ready To Break Out
Looking at the chart above, you can see that there is no resistance above $1800. In fact, there wasn’t much resistance above $1400. This is why I said that once we got above $1370, we were likely going to a new high. So far, that projection has been correct. This chart is currently screaming ATH. This is why most of the big Wall St banks are projecting a new ATH this year.
It would actually be better for us if gold waits a few more months to break out above $1790. This would create a nice resistance level that we could use for any future corrections. We have three trades at $1790 in 2011 and 2012 (see green arrow above). So, $1790 is a nice place to currently be stuck. Once we get above it, that will be the level we will want to hold to make our run at $2000. If we get lucky, $1790 will be the floor for a few years.
So, to recap, gold and silver appear ready to break out above important levels. This should usher in protracted bull market for both. However, during this scenario, the market (S&P 500) is likely to crash this year, pushing gold down between $100 and $200. This will create a buying opportunity for miners, because this correction in gold & silver is likely to be short-lived.
What I don’t know is how long it will take for the economy to recover. At what point will investors dump gold and go back into stocks and bonds? When is this gold bull market going to end? I don’t think anyone can answer that question. I do expect it to last at least through the first quarter of 2021. I say that because gold has been strong for the last few years in the first quarter.
Speaking of trends, gold tends to do well from July through October. A big reason why is this is the wedding season for India, which tends to be gold’s Christmas season. In India, the number one present for a wedding gift is gold. So, this year, for the third quarter, we get the Indian wedding season and COVID-19 (stoking the fear trade). It should be good for gold.
COVID-19’s Impact on the Economy
Let’s talk about COVID-19 and the economy. What we do know is that COVID-19 has decimated the economy. We are currently in a severe recession bordering on a depression. Plus, this is a global event. Business has practically crashed to a standstill for many industries.
The market (S&P 500) seems to think that the economy will rebound quickly once the pandemic is over. However, I’m not so sure. We are going to see a lot of bankruptcies, and banks are not going to be anxious to make loans until after the economy rebounds. For this reason, I expect a lot of sluggishness and weak consumer spending for the next year or two.
What is ironic about the market (S&P 500) is that many investors think that all is well with the US economy. I thought that the tone on the morning cable investment shows (CNBC) would turn a bit bearish based on the facts. But the guests seem to hold views that are just as bullish as prior to COVID-19. In fact, it has been rare to hear mainstream bearish views that the economy is fundamentally broken.
The Hum of the Printing Presses
Few Wall St investment bankers seem to be concerned that the Fed has opened up the digital printing press, or that US Government debt will approach $28 to $30 trillion by year end. This will put the US Government debt level close to 150% of GDP! That is an ugly number, but nobody is blinking. I have heard guest after guest say that GDP growth should be strong in 2021, and all will be well. They say the same thing over and over: buy stocks now because they are going higher.
Very few seem to be worried that MMT could fail. This is the theory that debt doesn’t matter as long as liquidity is abundant. Moreover, it is the theory that debt doesn’t cause problems, but the lack of liquidity. As long as you keep markets liquid by adding more debt, then all is fine. It’s a crazy theory that can only do one thing: kick the can down the road. Eventually the can (debt bubble) gets too big and blows up.
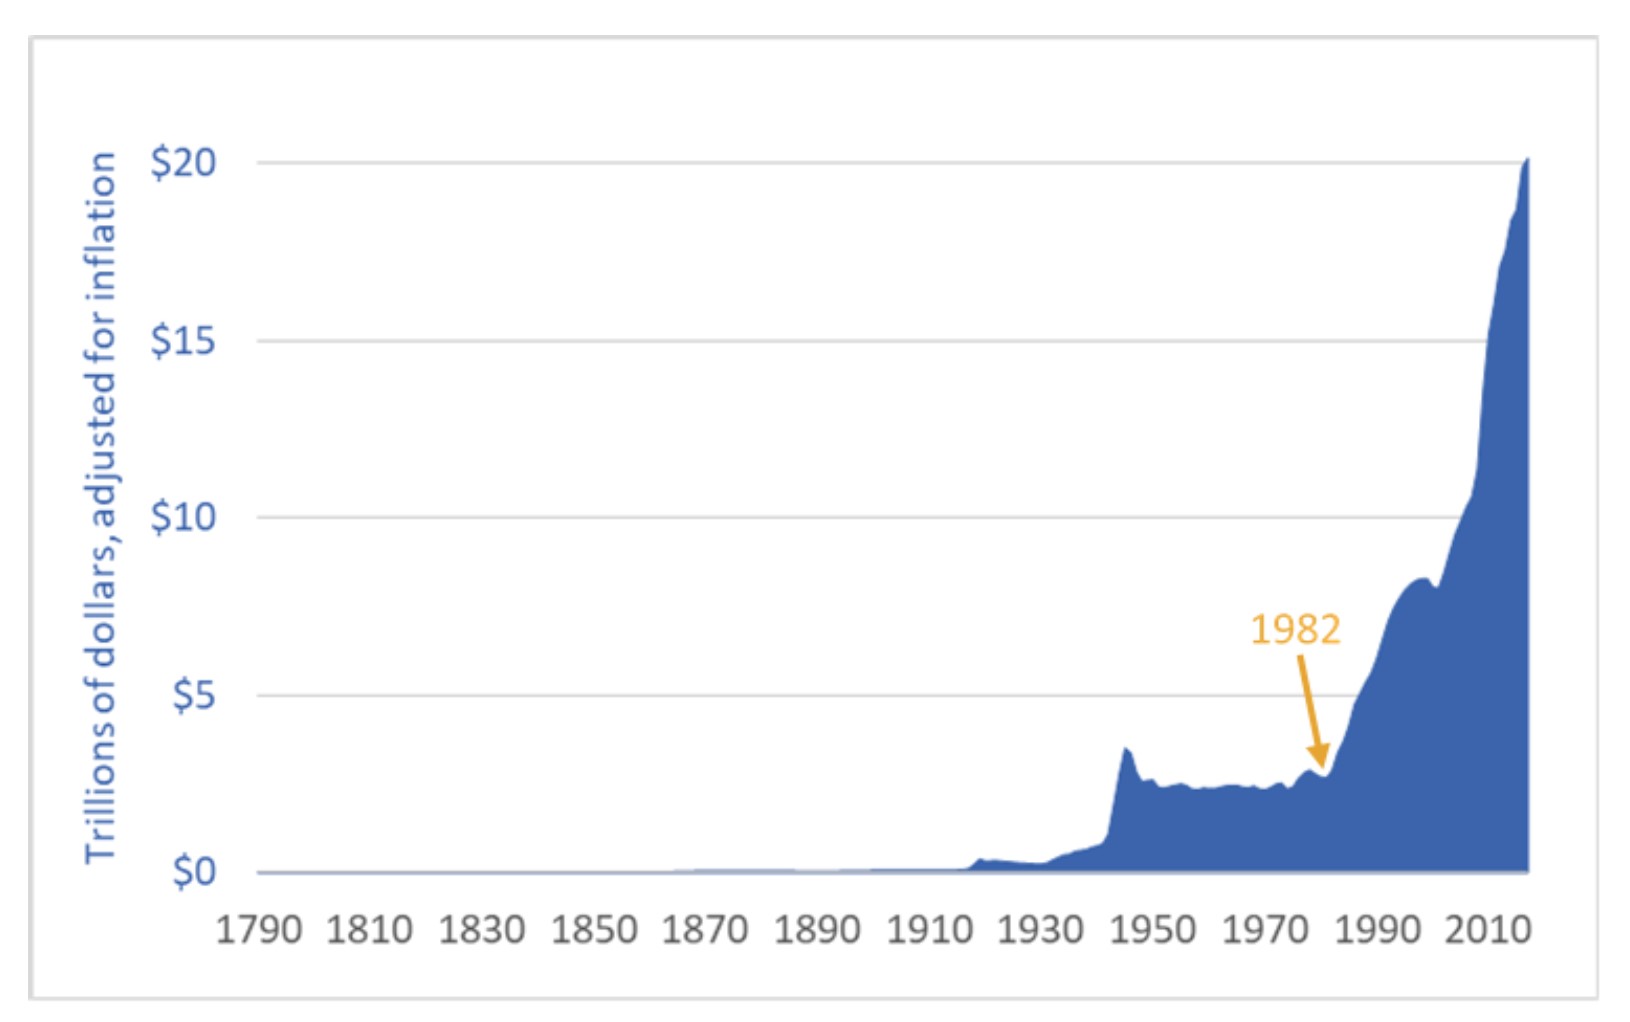
The chart above shows US Government debt at $20 trillion, but we are now approaching $30 trillion. Does that look sustainable? The Fed and our politicians no longer look at this chart. They pretend that debt doesn’t matter, but it does.
The problem with MMT, as we have found out since COVID-19 crashed the economy, is that it requires the Fed and US Treasury to manipulate markets in drastic ways to maintain liquidity. It’s not enough for the US Treasury to pump the economy by having large deficits. We have found that the Fed must also bail out companies by purchasing their worthless debt. Without these bailouts, companies would go bankrupt and the financial markets would freeze up. So, what has happened is that zombie companies that should be bankrupt, continue to muddle along.
You may think, what’s wrong with that? Well, it destroys the free market and makes it impossible for investors and banks to value companies. This creates a negative feedback loop and requires the Fed to continuously manipulate the markets to prevent them from crashing.
So, we know that MMT has to fail. We just don’t know how long it will take. In the short term, it effectively creates a Fed put on the markets and prevents a near-term crash. This is why the market (S&P 500) is currently overvalued. But this expectation also creates moral hazard, as Wall St push their clients into risky assets that only have value because of the Fed’s manipulation.
All of this manipulation sustains the dollar in the short term, as the illusion of economic stability fools investors. However, it also places the dollar at risk. Once MMT is recognized as a house of cards, foreign money will begin to run away from the dollar. This will become evident as foreign investors avoid US Government bonds. We are already seeing this as demand from foreign investors has waned for US Government bonds since COVID-19. I think this is why the dollar index is now below 100.
Gold Has the Wind at its Back
I became attracted to gold because I believed the US Government would eventually be forced to default on its debt. Back then (1990s), I was an anomaly, but today more and more people see this as more than just a probability. I think it is inevitable, and MMT is just making it more so every day.
So, the dollar is currently a plus for gold and no longer a negative. The dollar will begin trending down soon, and that will put more upward pressure on gold. I expect to see the dollar index drop to around 95 this summer, but by year end don’t be surprised if it is close to 90, on its way to sub 80.
Another thing that could be a plus for the dollar is the presidential election. If the Democrats win the Presidency, I expect gold to take off because of uncertainty. That’s still a few months away, but something to consider. I expect a big run to gold soon if Trump remains way behind in the polls. Gold could get an early boost from the election as soon as August, but definitely in September if Trump remains behind.
Between now and March, gold has the wind at its back. That’s a big window, and I would expect a lot of money to go into gold and the miners. We might even see a mania phase materialize.

Don is an expert gold and silver mining stock analyst, author, and founder/owner of GoldStockData.com – a website for gold and silver mining stock data. He is the author of How to Invest in Gold and Silver: A Complete Guide with a Focus on Mining Stocks. He is a contributing analyst on SeekingAlpha.com and a frequent guest on internet financial podcasts.


