The Gold-Silver Ratio


As was described last week, events in April 2013 and again in March this year and now again, for a third time, show that when the Cartel gets really desperate, they pull out all the stops in their self-preservation. They have unbounded trust in the CFTC and are confident that whatever intervention the Big Banks engage in to reduce their risk, this will not be investigated. The CFTC will not expose itself in a situation in which the evidence of malfeasance is so glaring, so blatant, that the whole world will realise the CFTC is closely allied with the Cartel and fully support what they and Comex are doing to suppress PM prices.
Globally the number of daily COVID-19 infections and deaths are slowly declining. So too are the new cases and daily deaths in the US, but the weekly pattern in both numbers raises questions that do not have answers.

The above table of once a week numbers of new cases and daily deaths presents two distinct sets of numbers. The first four weeks into early July show relatively low numbers for news cases and deaths. These were statistics taken on Saturdays. The last five sets were taken on Fridays. There is a big difference between the weekday numbers and weekend numbers, for both the new cases and deaths. This can be clearly seen on the two charts below of US daily new cases and daily deaths.
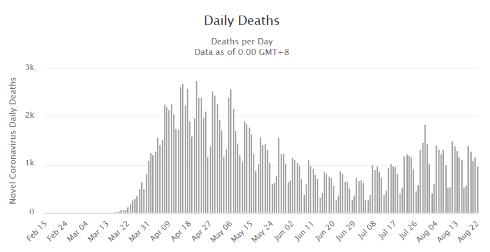
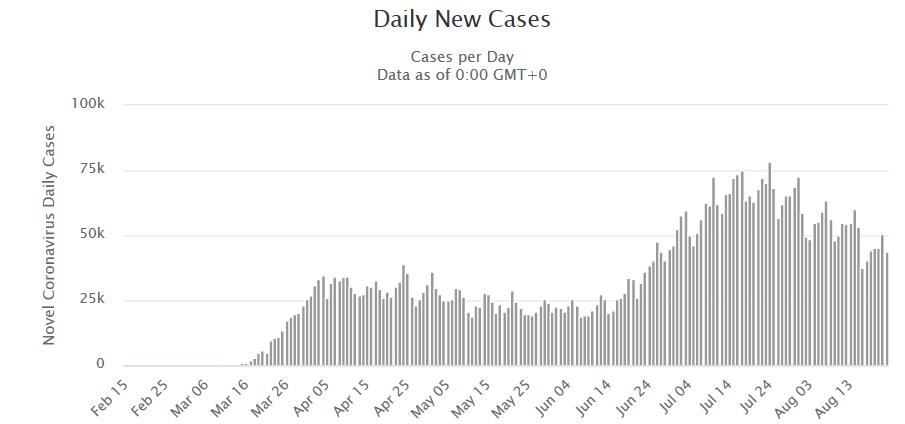
Since the end of June, the last 9 weeks all had the most new cases on the Friday and many fewer new cases on Saturdays and Sundays – perhaps when testing services are taking the weekends off? But, during the last four weeks the US had the most deaths on a Saturday and the lowest number on a Thursday and Friday. Are the hospital staff also taking weekends off, leaving patients on the mend to cope as well as they can? It is of course a facetious and (probably?) completely untrue statement, but the pattern is too constant to be random. It would be interesting to know what the real explanation happens to be.
Recently I have shown a number of long term charts that illustrate the presence of lasting structure in financial market prices. The more time series I explore, the more the evidence mounts that structure in the form of channel ratios is common to all financial markets. In due course, the evidence will be so conclusive that the establishment economists will have to take notice and realise that their dogma of the random walk hypothesis is flawed. That should cause a bit of a shake-up.
This week the focus is on the gold-silver ratio; an indicator of great interest to all gold and silver bulls, since the future behaviour of this ratio and potential targets that the ratio could reach would serve to time decisions when positions ought to be switched between gold and silver. General opinion at the moment is clearly in favour of silver over gold, but when will it be time to reverse back into gold?
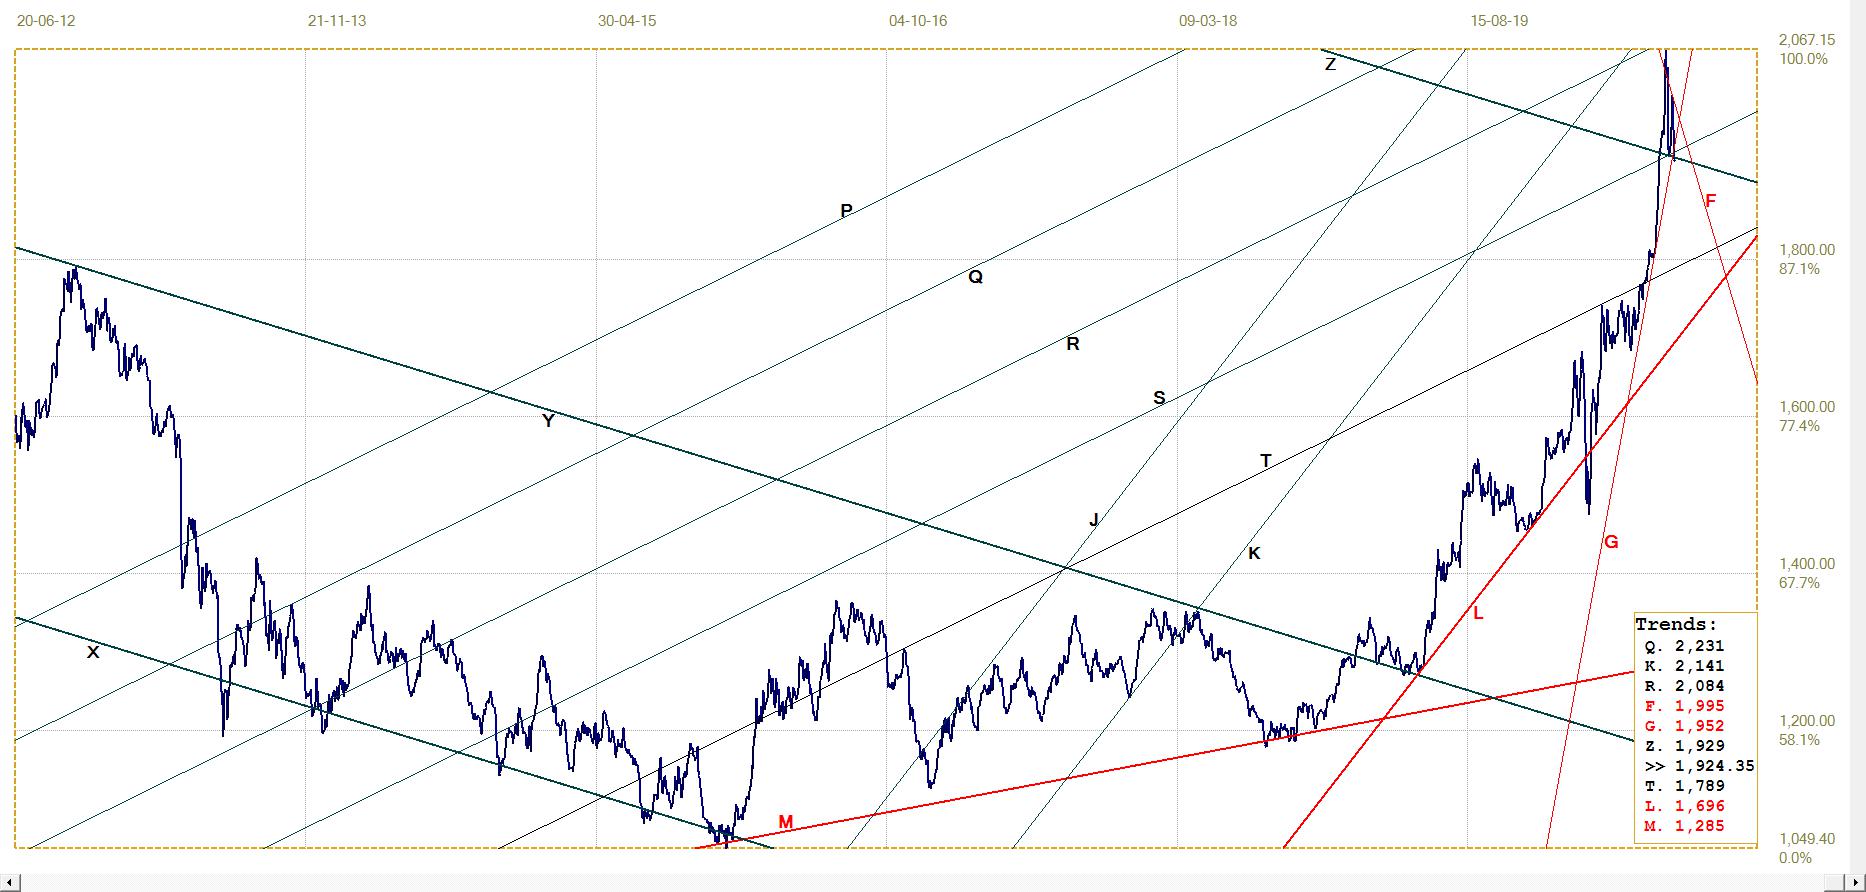
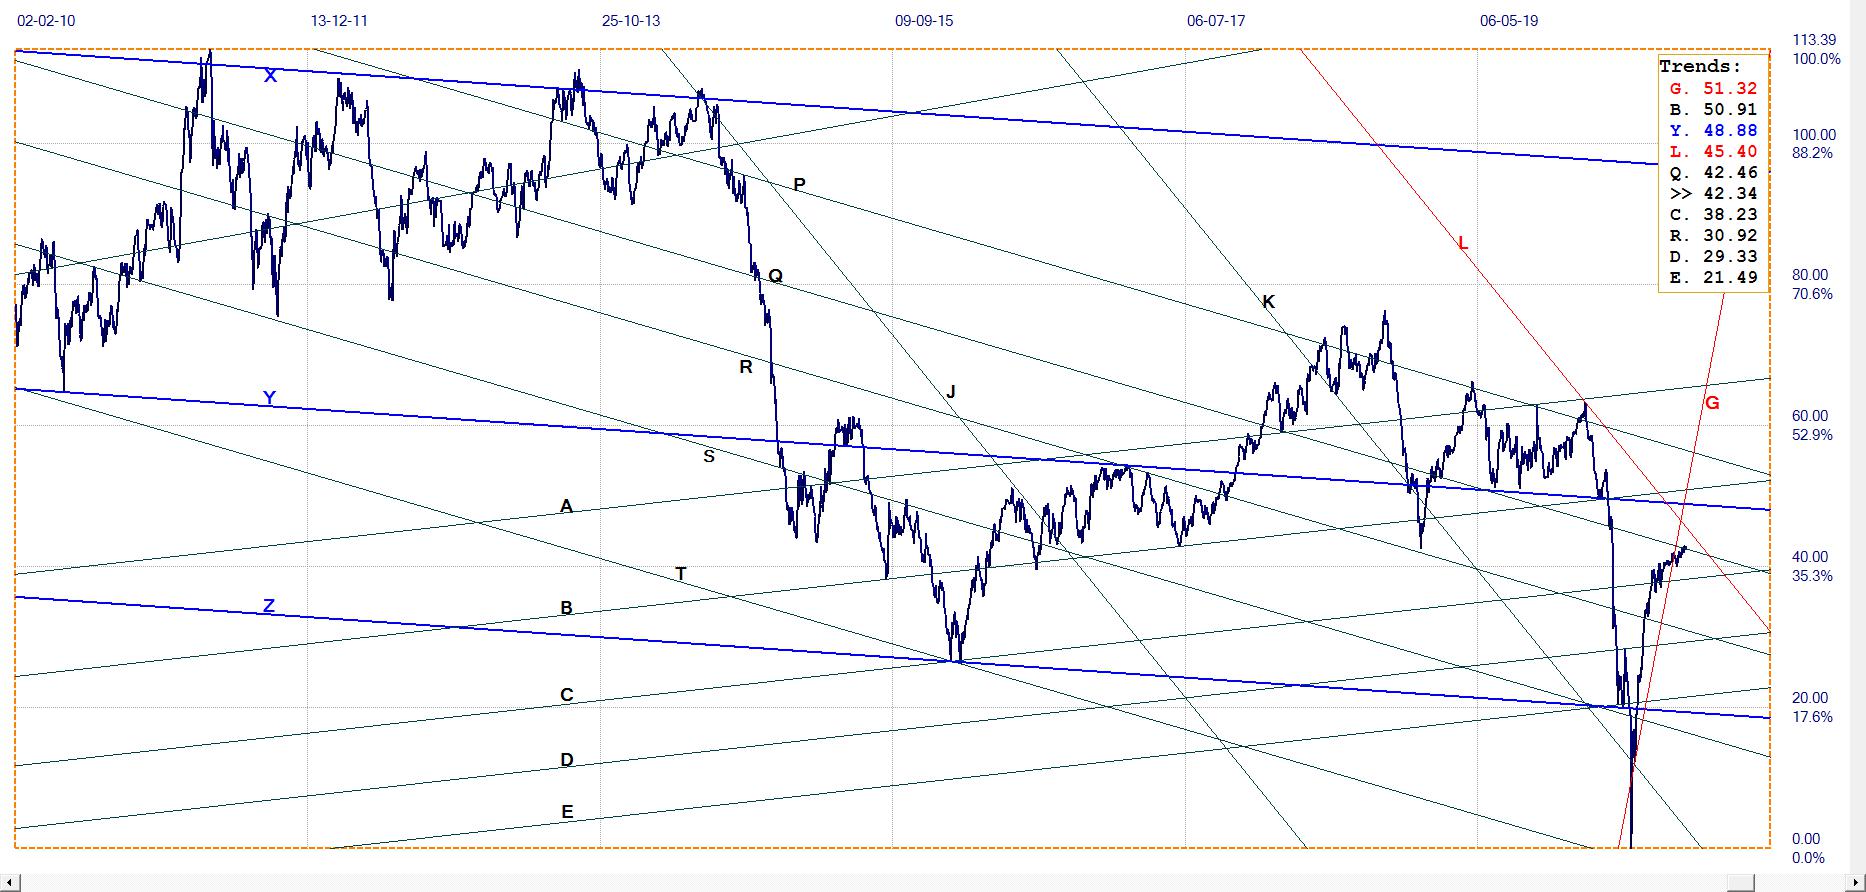
The chart below was the first attempt to do an analysis once the monthly ratio had been calculated from the monthly average gold and silver prices. The master gradient from which all the other trend lines are derived, is the red trend line M; the first obvious candidate for a master gradient that connects two distinct early spike tops. Lines P and Q, parallel to line M and are located in significant lows on the chart; line P is positioned to fit some later reversals and it also passes quite cleanly through the chart, while line Q is tangent to the chart.

Gold-silver ratio Monthly average. Last = 76.58 (July)
Line A is located in the first data point of the chart and line C in the centre of the bifurcated top of the March-April-May spike in the ratio; always an important points on a chart. Line B is, except for the brief break below line B where line Q is located, a perfect watershed line that passes through the whole chart with only two occasions where it penetrates through the chart. Lines X and Z are practically tangent to the chart and located in prominent trend reversals. Lines K and L, not part of the main analysis, are clearly well located along trend reversals.
The ratios of the three main channel pairs are ABC 377:623, MPQ 599:401 and XYZ 617:383. The ratios of ABC and XYZ differ slightly from the 382:618 of the Fibonacci ratio, while MPQ is almost exactly the 400: 600 ratio found in all time series. With lines K and L added to the analysis, the ratios of PLQ = 701:299 and BKC = 622:378, also to correspond to the 400:600 and Fibonacci ratios.
The month to date gold-silver ratio for August is 73.61, which implies that should the ratio be maintained until the end of the month, there will be a break below line L to open up the silver rally for a move lower to reach lines Y and Q near a ratio of 60. With the two levels of resistance that come into play there, the odds seem that it will be an area of some consolidation before the ratio reverses or breaks to extend lower.
Taking a really long term and optimistic (for the silver bulls) view of the ratio, line Z at that bottom of the very broad channel XYZ could be a target - which at 30 or so would still place the ratio at double the ratio from long ago in the time of the Greeks, as has been reported by students of ancient history.
The steep gradients on the daily charts of gold and silver that were used the past few weeks to predict where the prices of the metals could be expected in early October, if the gradients remained intact, are shown in the daily charts later. It will be seen that the silver price last week held to the steep gradient and is still on target for $40/oz by early October – while the steep trend line holds. The price of gold has broken marginally below the steep trend. The London PM fix has to be above $1952.25 on Monday and also above $1974.65 on Friday to recover above the steep gradient and again project a possible $2200 in early October.
Should both metals manage to hold the steep trends to early October, the gold-silver ratio should decline to better than 55, which would imply the potential to break below the levels of trends line Y and Q on the monthly chart of the ratio – but only if the prices do reach and then hold these levels to the end of October.
The rest of US markets are essentially little changed. The Nasdaq is setting new all time highs, with the S&P500 working hard to follow suit and the DJIA lagging the other indexes. The dollar has turned firmer again and the yield on the US 10-year Treasury note is back below 0.7%, but holding clear of 0.6%. Crude is trying to challenge resistance at about $43, but not making much headway. The political infighting is heating up as the RNC approaches and one can wonder whether the destruction of cities will increase again to try and make political capital out of the intimidation of voters.
Euro–Dollar
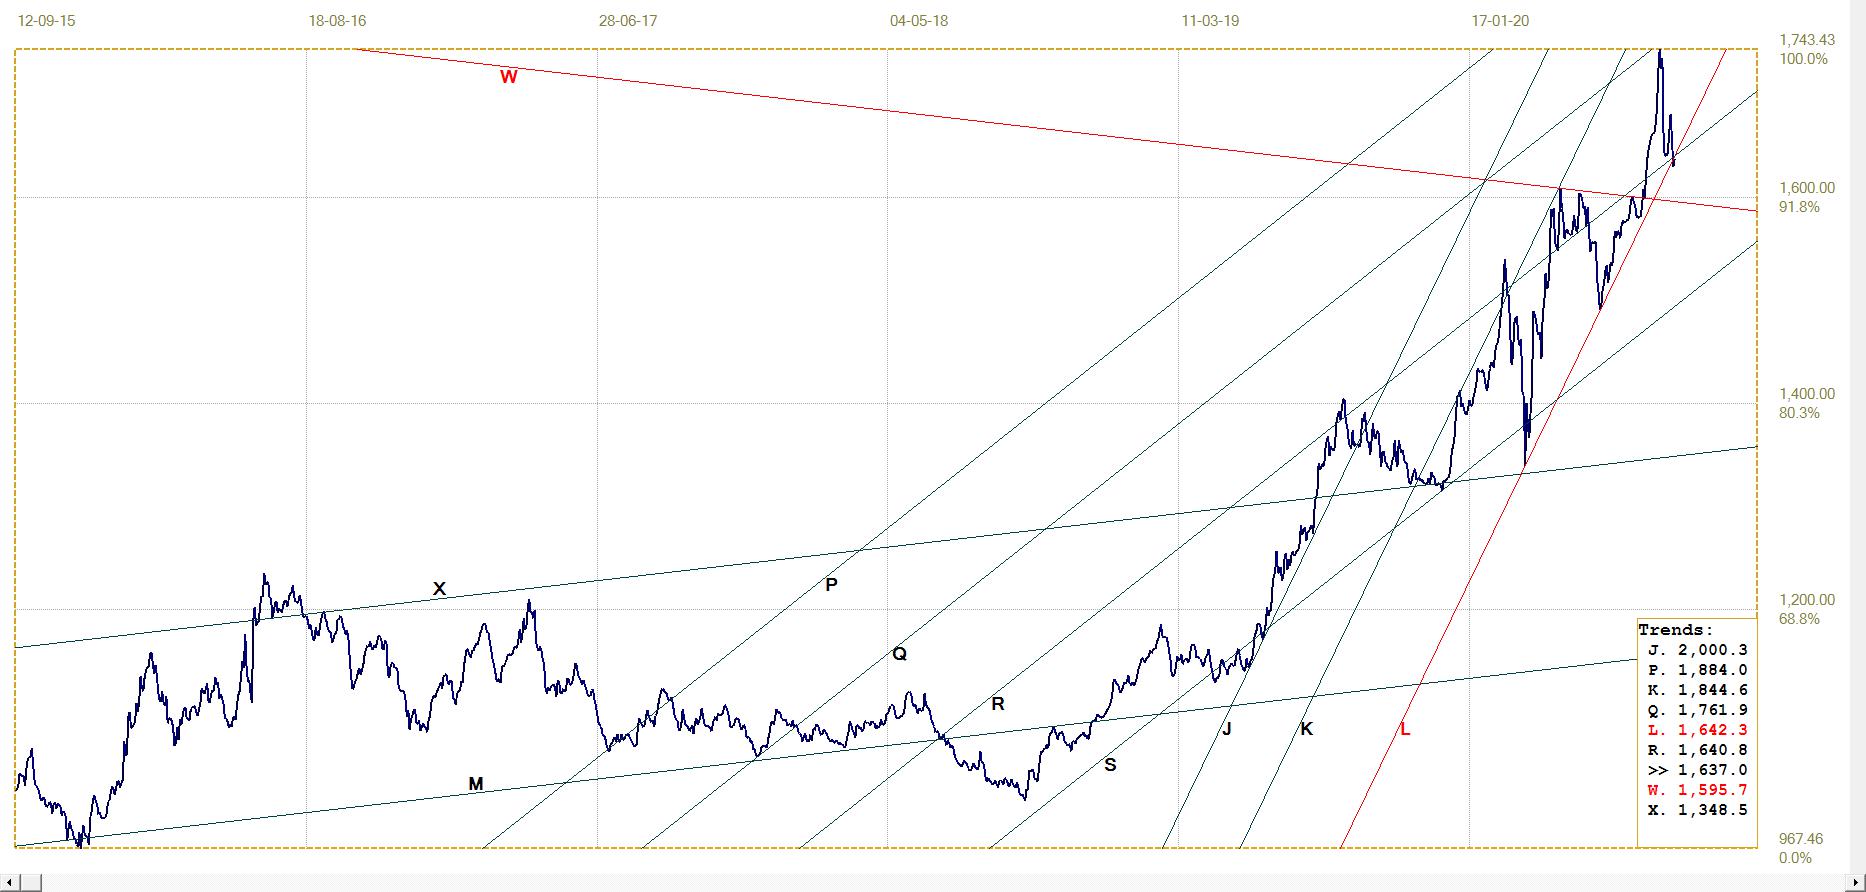
The euro rally to break above the double top at line R ($1.1855) of two weeks ago failed to hold the break as a resurgent dollar soon had it back below line R, blocked an attempt to break higher and then sent the euro much lower. The proponents of a much weaker dollar as a consequence of the massive amount of dollar printing going on – almost as a competition between Congress and The Fed to see who can print the most the fastest – with the threat of hyperinflation playing on the horizon, have to realise that just as Wall Street can be levitated beyond comprehension, so too can the dollar.
Channel JK ($1.1721) of the broader bull channel JKL is still intact and the steeper gradient G ($1.1613) is also some distance from being challenged. Until these support trends are tested, one can assume the dollar still has a bearish bias.
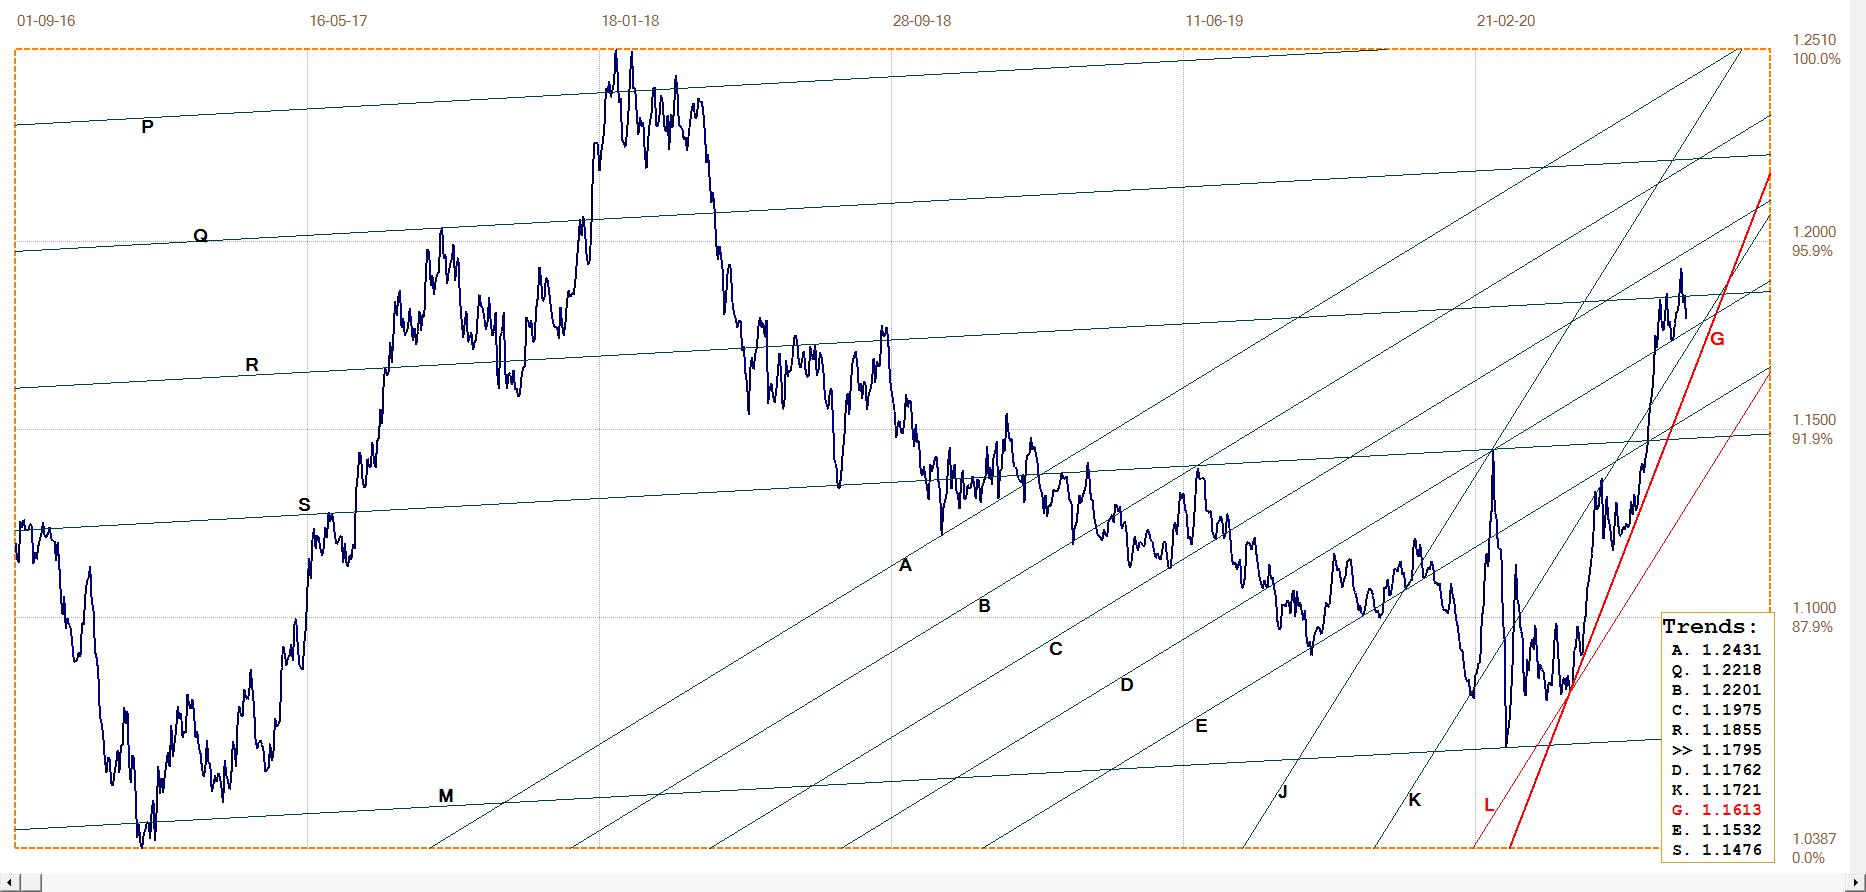
Euro–dollar, last = $1.1795 (www.investing.com)
DJIA Daily close
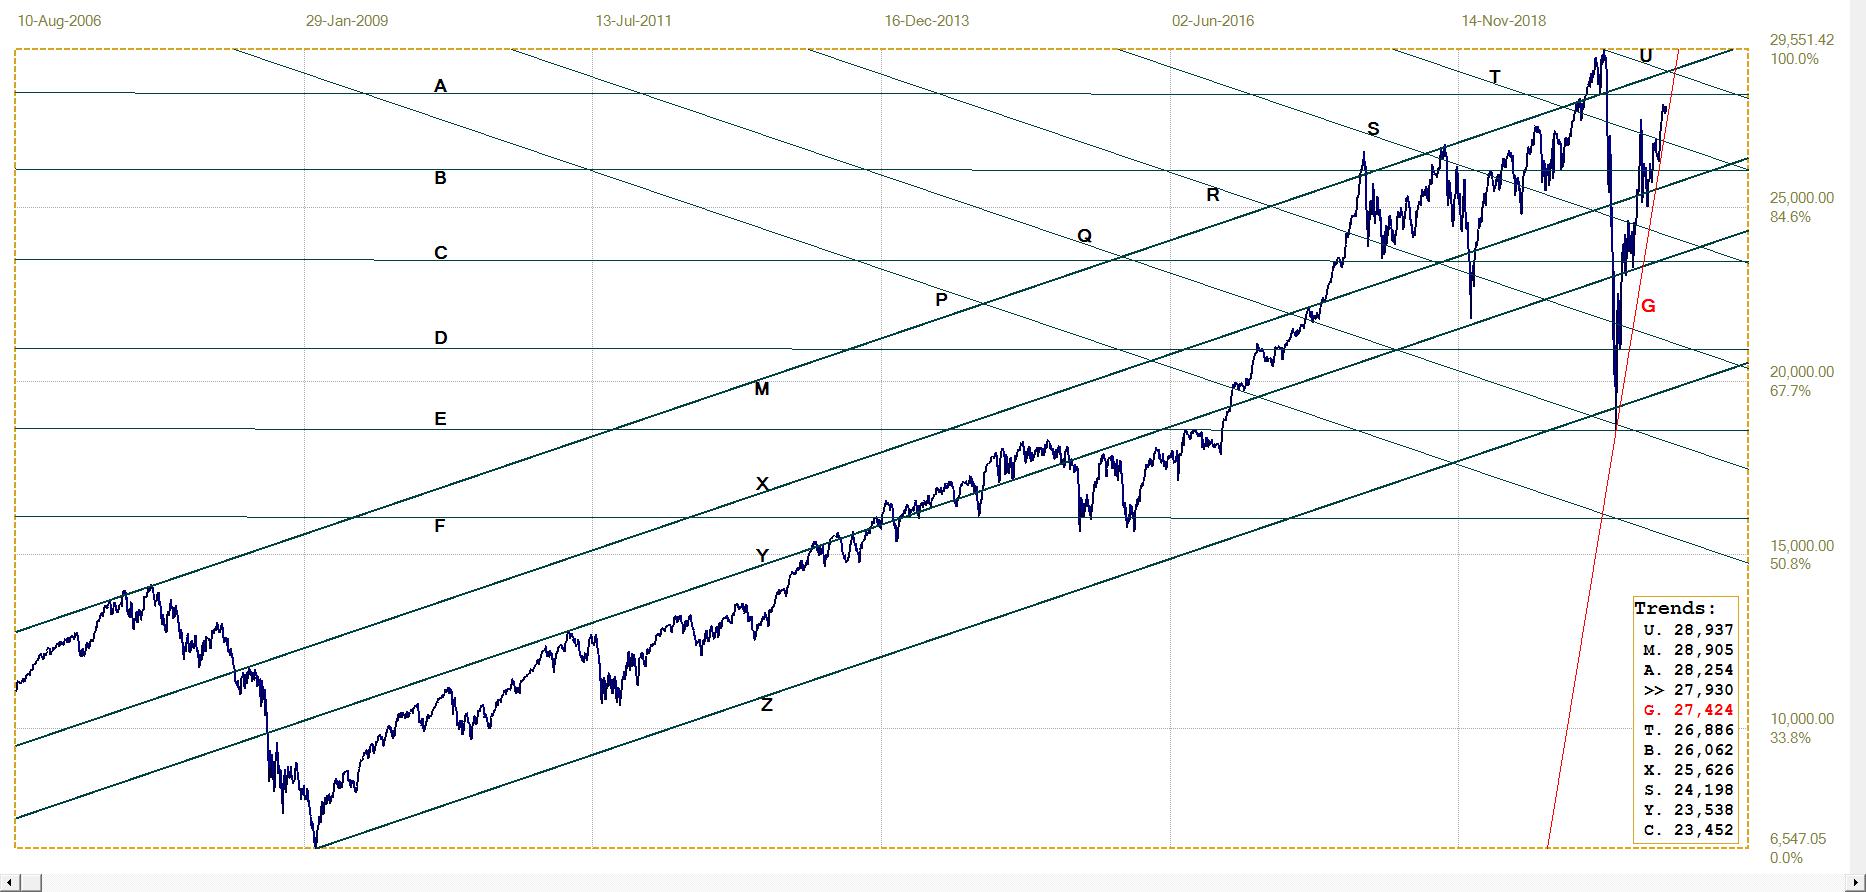
DJIA, last = 27930.33 (money.cnn.com)
Wall street occasionally shows signs of incipient weakness, but these generally last for only part of a trading day. Any substantial weakness is soon met by determined buying that reverses the weaker trend and extends to new high values for the day. When the market closes with the DJIA in the red, one can be certain that overnight the futures will turn green before the real trading on Wall Street begins.
It has been a market that was bankrupting Bears for a long time now and it seems set to continue in this way until early November at least. One can expect that many economists will publish expectations for corporate results that will be easily beaten by the actual numbers. This is an old stale ploy to create an euphoria of optimism among investors and to trigger a rally on Wall Street irrespective of the true facts about the economy. It will probably again have the desired effect in October and justify the stellar valuations of the stock market. To be much appreciated by the new generation of day traders with their busy smart phones and herd behaviour driven by hint-hint websites.
If this is what the future will hold, there will be lost of tears come late November, irrespective of who wins the election.
Gold London PM fix – Dollars
Gold price – London PM fix, last = $1924,35 (www.kitco.com)
As mentioned earlier, there is a sideways break below the steep gradient line G ($1952 for Monday 24th); also a minor break below support of line Z ($1929) – the top boundary of the broad channel XYZ with a ratio of 383:617, one point away from the Fibonacci ratio). A recovery this week to above line Z and ideally also back above line G, will put the price of gold back on track for the target of $2200 early in October.
Euro–gold PM fix
Last week’s comment stated the steep run higher to line Q (€1762) was evidence that the price of gold rallied on inherent strength, not only because of weakness in the US dollar. This conclusion obviously rests on the premise that the price of gold and the euro should react in similar fashion to changes in the dollar. When a weak dollar results in a higher price of gold, the euro is firmer against the dollar which reduces the euro price of gold.
The net effect of changes in the dollar on the euro price of gold therefore should be limited. The jump in the euro price to reach line Q must then represent the inherent strength of gold, while the decline back to line R (€1641) and L(€1642) reflects the recent sell-off in gold.
This coming week will be critical for the euro price of gold. The euro price needs to remain within channels QR and KL to retain the technical bullish bias. Dollar gold has to resume its rising trend on its own merits, since a weaker dollar will not have much effect on the euro price of the metal. Much depends on the suppression of the gold price. If the cartel has managed to close enough of its short positions with this extended attack on the prices, they may step back and let the rising trends resume. If so, that will leave the technical picture intact.
Euro gold price – PM fix in Euro, last = €1637.04 (www.kitco.com)
Silver Daily London Fix
Whereas the gold price has broken sideways through a steeply ascending gradient, the price of silver is going relatively better than gold – as it has been doing recently – by holding above line G ($25.76) by a good margin. However, line G is very steep and the silver price cannot afford to loiter too long, or it will also suffer a technical break lower. Bull channel JKL ($22.31) appears to be quite safe at the moment.
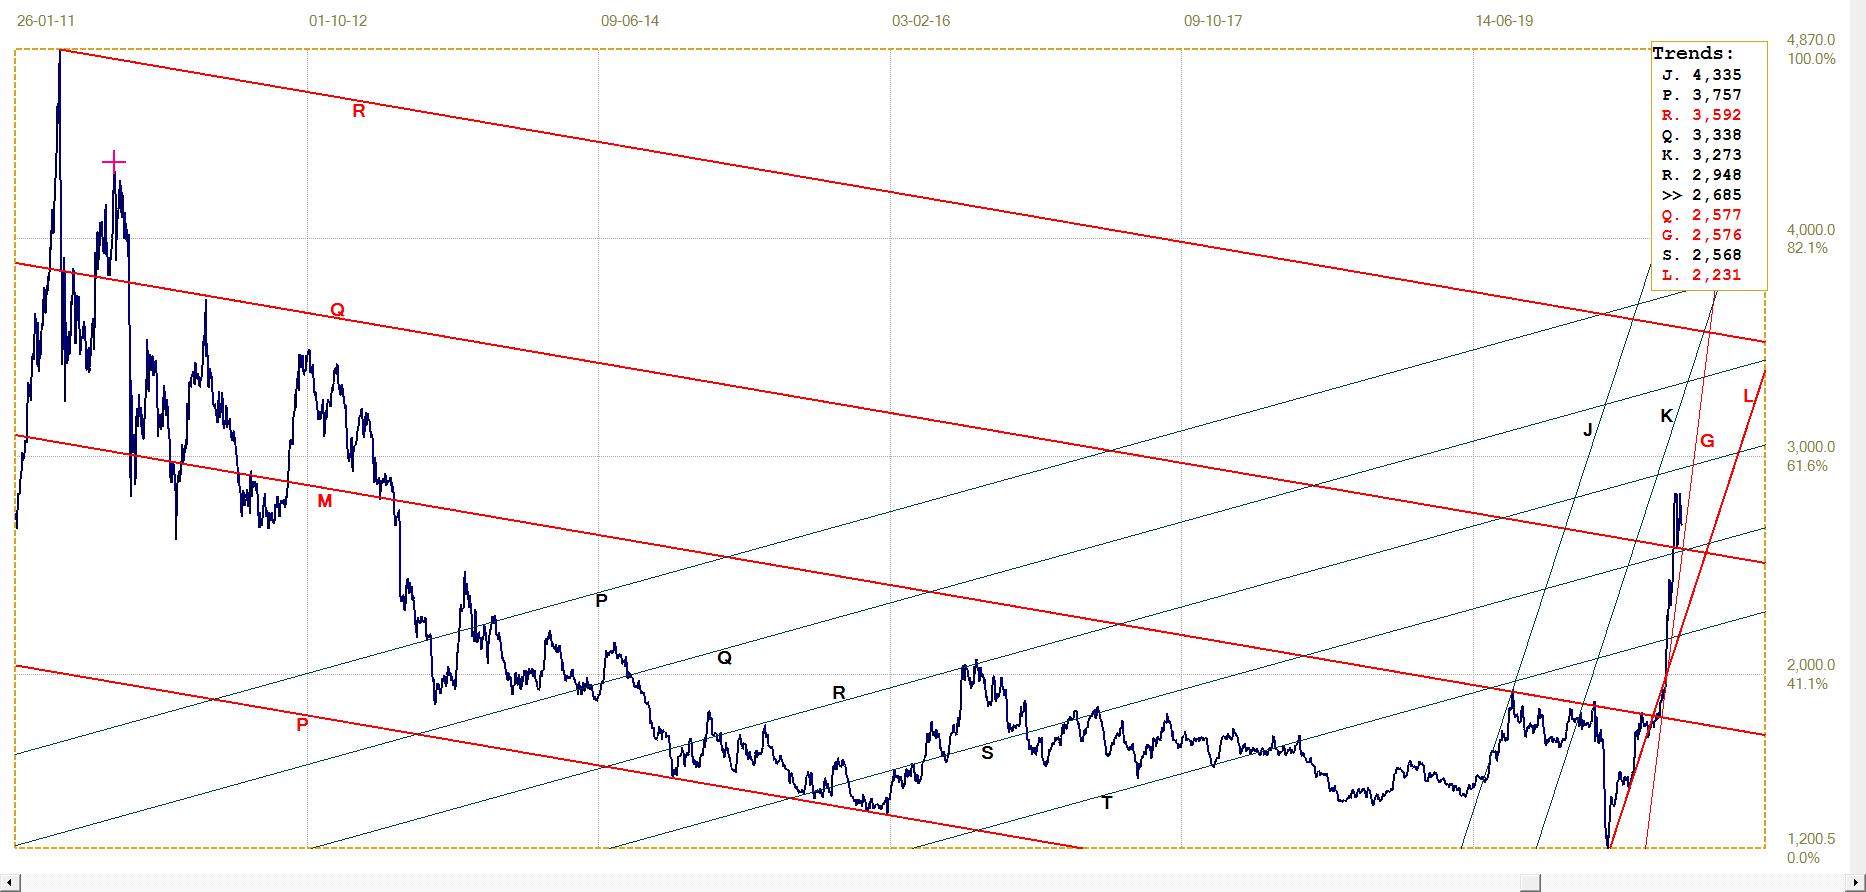
Silver daily London fix, last = $26.85 (www.kitco.com)
U.S. 10–year Treasury Note
The rebound higher off line R (0.497%) to break higher above the steep line G, and also above channel CD (0.504%) also extended into broad channel YZ (0.619%). This latter break higher has failed to extend closer to line L (0.764%), but reversed lower to resume its downward trend and appears threatening to break below line Z again.
With these low yields, the prices of the 10-year Treasuries must be both very high and very much geared to even small absolute changes in the yield. This must be a terrible time for the trading desks that have to maintain the proper delta on many billions of interest rate derivatives of their institutions or corporations. If there are such derivative positions close to blowing up, it will be kept most secret. Any hint of trouble from a major bank and the rest of them will be on it like vultures on a lion kill once the lions have left.
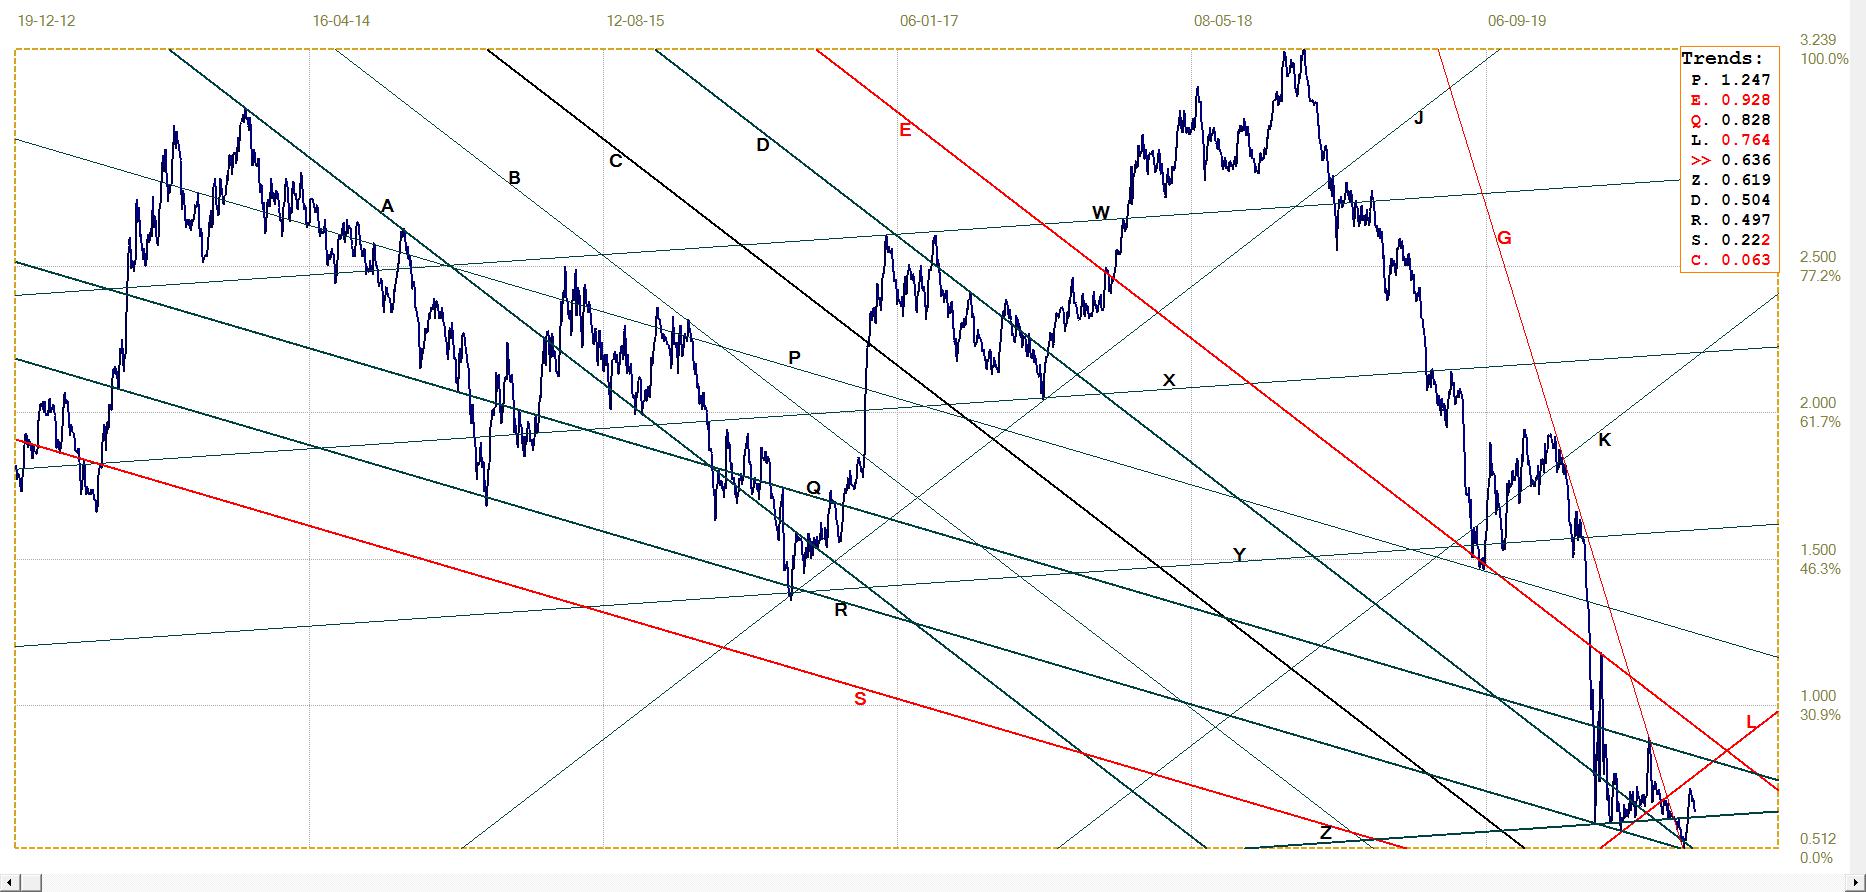
U.S. 10–year Treasury note, last = 0.636% (www.investing.com )
West Texas Intermediate crude. Daily close
WTI crude – Daily close, last = $42.34 (www.investing.com )
Last week’s comment still holds: for some weeks, the price of crude has inched higher at worm-like speed, first to break sideways above the steep trend line G ($49.01) and then to approach resistance at line Q ($42.46). A break clear above at line Q is needed to signal improving demand for crude that would also be a signal that the economy is reviving.
This has not yet happened and it reinforces the general opinion that the economy is not performing well, despite optimistic news.
********


