Gold Still Can't See It's Way Clear, But The S&P500 High Looks In Place For The Year


First Gold: A mere seven days ago we were singing Gold's praises as its price for two consecutive weeks moved higher in bold defiance of the otherwise Short weekly parabolic trend. "Like salmon spawning upstream" we wrote; that was Gold's gleam.
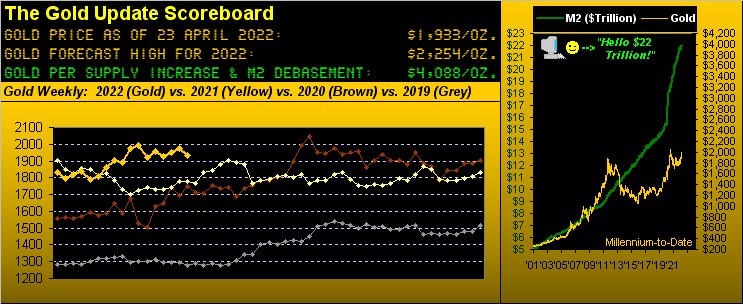
But now a week hence, Gold's been reamed, recording its third-worst weekly change year-to-date in settling yesterday (Friday) at 1933. To be sure, we're maintaining our forecast high for this year of 2254; but for the present -- in spite of all things as Gold-positive as for which one could ever wish -- the evil, nasty, belligerent Short trend seems pressing on price. Here are the weekly bars, the parabolic Short trend depicted by the four rightmost declining red dots:

The bad news is RUS state television's promoting this past Thursday that the RS-28 Sarmat missile can level New York City; but the price of Gold, struggling to see its way clear, dropped anyway. The good news by the above graphic is that such Short trend really looks short-lived, for Gold's broader bent across the chart clearly is to the upside.
Moreover, with the StateSide Money Supply ("M2") having just now topped the $22 trillion level, our forecast for Gold 2254 seems modest given the yellow metal's value of 4088 as shown in the opening Scoreboard. But one year at a time. Further, we deem Gold's gleam as the buy of a lifetime. To reprise the late, great Richard Russell: "There's never a bad time to buy Gold" ... especially with present price at but 47% of present value. Now as to the overvalued end of the spectrum...
Second the S&P 500: The mighty Index's high for this year (4819 on 04 January) is it from our perspective. Just as everything possible is positive for Gold, we find absolutely everything as negative for the stock market:
- The recession-indicative yield curve is as flat as a pancake, be it 5-, 10-, or 30-year dough all yielding 2.9%, essentially double the S&P's yield (per Friday's 4272 settle) of 1.433%;
- The Economic Barometer is a gyrating, recessive mess as we'll later show;
- Q1 Earnings Season is very poor on the notion reports were supposed to be better post-COVID but clearly are not: only 54% of S&P constituents' earnings (thus far reported) bettered Q1 of 2021; post-COVID, shouldn't that be 100%? Oops;
- The "live" price/earnings ratio of the S&P is at present 35.7x whereas its lifetime mean (to which the p/e historically always reverts) is 38% lower at 22.3x;
- And then technically there's this daunting negative MACD (moving average convergence divergence) crossover on the S&P monthly chart for the past five years... Ouch! And sayonara 2022. Get ready to get ugly:
"But mmb, you can't will people out of the stock market..."
Oh that is one of your most salient comments there, Squire. This past week's last two trading days netted the S&P 500 a combined loss of -4.2%. But the S&P's MoneyFlow regressed into S&P points recorded a comparable loss of just half that at -2.1%. The interpretation? The "We won't sell because it always comes back!" crowd is alive and well, until they, too, begin to sell. So much for conventional wisdom, unless one has significant patience ---> Per the "Friendly Reminder Dept.", from October 2007 to April 2013 the S&P 500 did not make a new high, (just in case yer scorin' at home).
"So how low is low, mmb..."
Rather than assign a subjective percentage drop, whether measured from here (S&P 4272) or from the high (S&P 4819), 'tis our preference to assess price structure. And as we shared via text this past week: "Broadly we can see S&P 3587-3198". In turn, that's in perfectly reasonably -- indeed long overdue -- order for an overall correction from 26% to 34%. 'Course, regardless of our pose, nobody knows.
Still, in recent years we've mentioned the notion of the "Look Ma! No Earnings!" crash. So in that vein we today give a tip of the cap to Bloomy reportage in actually acknowledging this poor Earnings Season. And yet, Dow Jones Newswires continues to make reference to an (albeit all inflationary) StateSide "Hot Economy". Does this look "hot" to you?
The only "hot" metrics of this past week were marginal improvements in March's Housing Starts and Building Permits. The balance was a "cold" wind that blew for the month's Leading Indicators and Existing Home Sales, along with April's lower Index readings from the National Association of Home Builders and the Philly Fed. As for the broader graphic, 'tis a "gyrating, recessive mess" indeed. Cue Jerry Reed from '71: ![]() "When you're hot, you're hot. When you're not, you're not."
"When you're hot, you're hot. When you're not, you're not."![]()
As for the FinMedia folks at large, our commendation to them for discovering the FedFundsFutures having already priced in a 50-basis-points rise per the Federal Open Market Committee come 04 May. We noted same three weeks ago in the 02 April missive, but 'tis better the news at least play ketchup than remain pickled, (sorry).
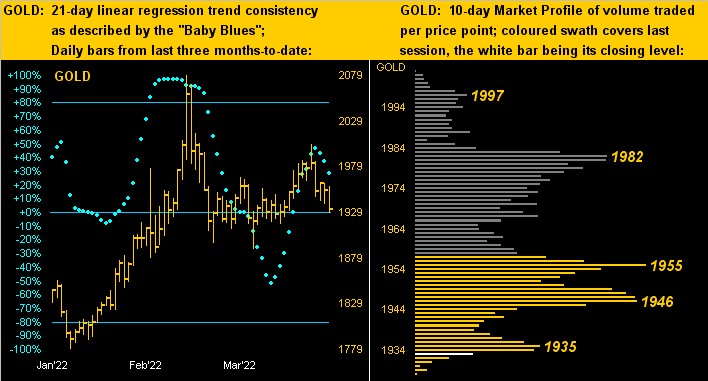
As to "The Now" for Gold, here next is the two-panel graphic of price's daily bars from three months ago-to-date on the left and 10-day Market Profile on the right. Therein you can see the near-term negativity as Gold's "Baby Blues" of regression trend consistency turn downward whilst price is pinned down near the bottom of the Profile:
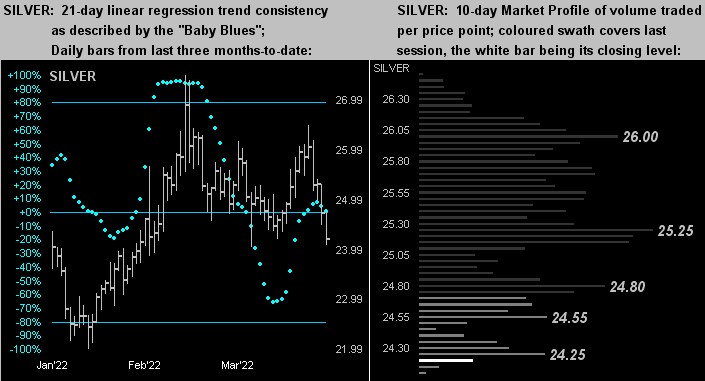
And 'tis the same for Sister Silver, say no more:
Ahead of a critical week for incoming economic metrics, we'll wrap it here with these three notes:
- "Researchers" report that millions of ably-eligible folks are choosing "indefinitely" to remain out of the workforce. We find it curiously coincident with such choice that -- going by S&P/Experian's data on consumer credit defaults -- they've just increased for the fourth consecutive month. Live by the credit card; die by the credit card.
- One Tobias Adrian -- The International Monetary Fund's Director for Monetary and Capital Markets -- expressed concern this past week over the risk for further selling in the markets such that we may "...see a certain amount of readjustment of asset valuations going forward..." That's a quaint way of putting it, one has to say.
- Ready for the Mother of all Metrics? Again with reference to it being a critical upcoming week for data from the "hot" economy, therein we'll get the first StateSide reading of Q1 Gross Domestic Product. The consensus is for a vastly reduced annualized pace of only +1.1%. But here's the killer: the consensus for the associated Chain Deflator is +7.3%. That is stagflation in spades, right there!
And Gold toward seeing its way clear remains so cheap through here!
www.deMeadville.com
www.TheGoldUpdate.com
********

Mark Mead Baillie has had an extensive business career beginning in banking and financial services for two years with Banque Nationale de Paris to corporate research for three years at Barclays Bank and then for six years as an analyst and corporate lender with Société Générale.
For the last 22 years he has expanded his financial expertise by creating his own financial services company, de Meadville International, which comprehensively follows his BEGOS complex of markets (Bond/Euro/Gold/Oil/S&P) and the trading of the futures therein. He is recognized within the financial community of demonstrating creative technical skills that surpass industry standards toward making highly informed market assessments and his work is featured in Merrill Lynch Wealth Management client presentations. He has adapted such skills into becoming the popular author each week of the prolific “The Gold Update” and is known in the financial website community as “mmb” and “deMeadville”.
Mr. Baillie holds a BS in Business from the University of Southern California and an MBA in Finance from Golden Gate University.


