Gold Stocks: No Top Until 2029?


Basis GDX, gold stocks hit an all-time high yesterday… and gold is powering up the charts again today!
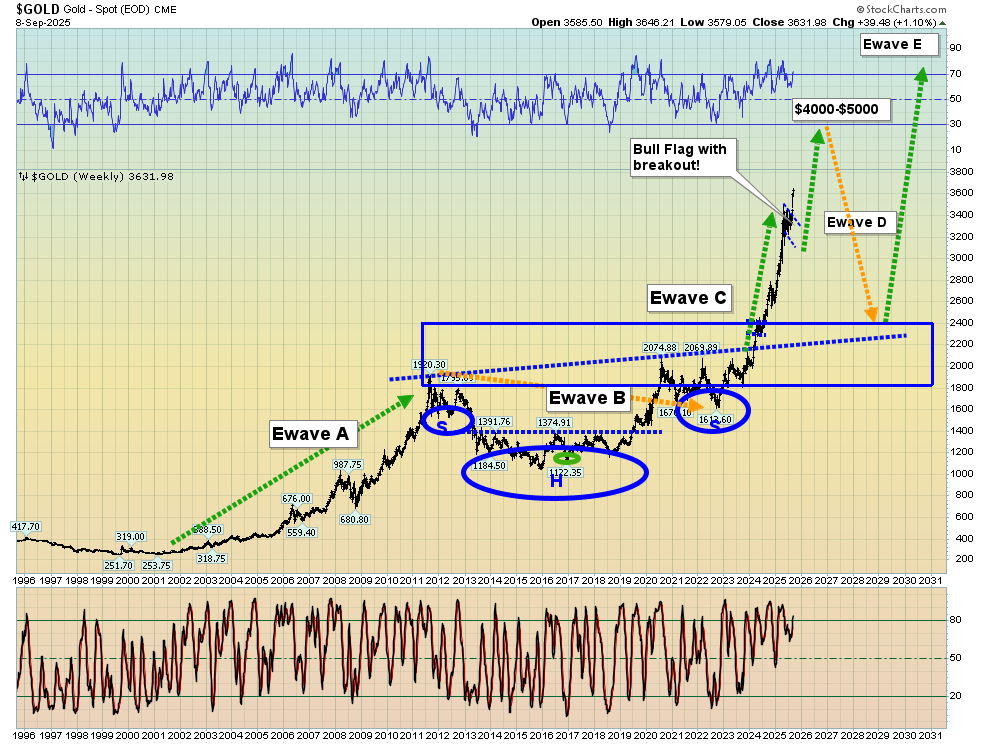
This is the magnificent weekly gold chart. I’ve been highlighting the bull flag formation for months… and now there’s a massive breakout to complete the incredibly bullish picture.
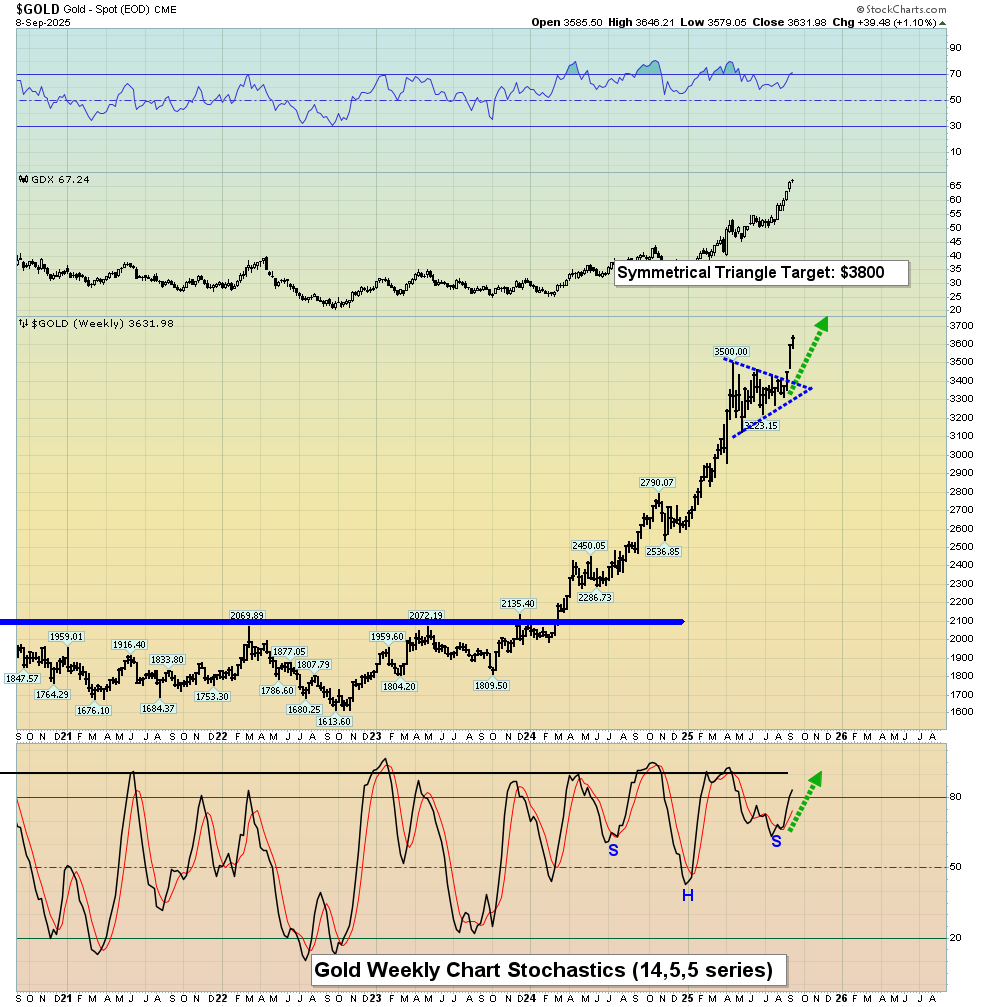
Here’s another spectacular weekly chart. I’ve been urging gold bugs around the world to respect the fabulous inverse H&S pattern on my 14,5,5 Stochastics oscillator.
Those who did that have been rewarded with a beautiful symmetrical triangle breakout and a rally of significance.
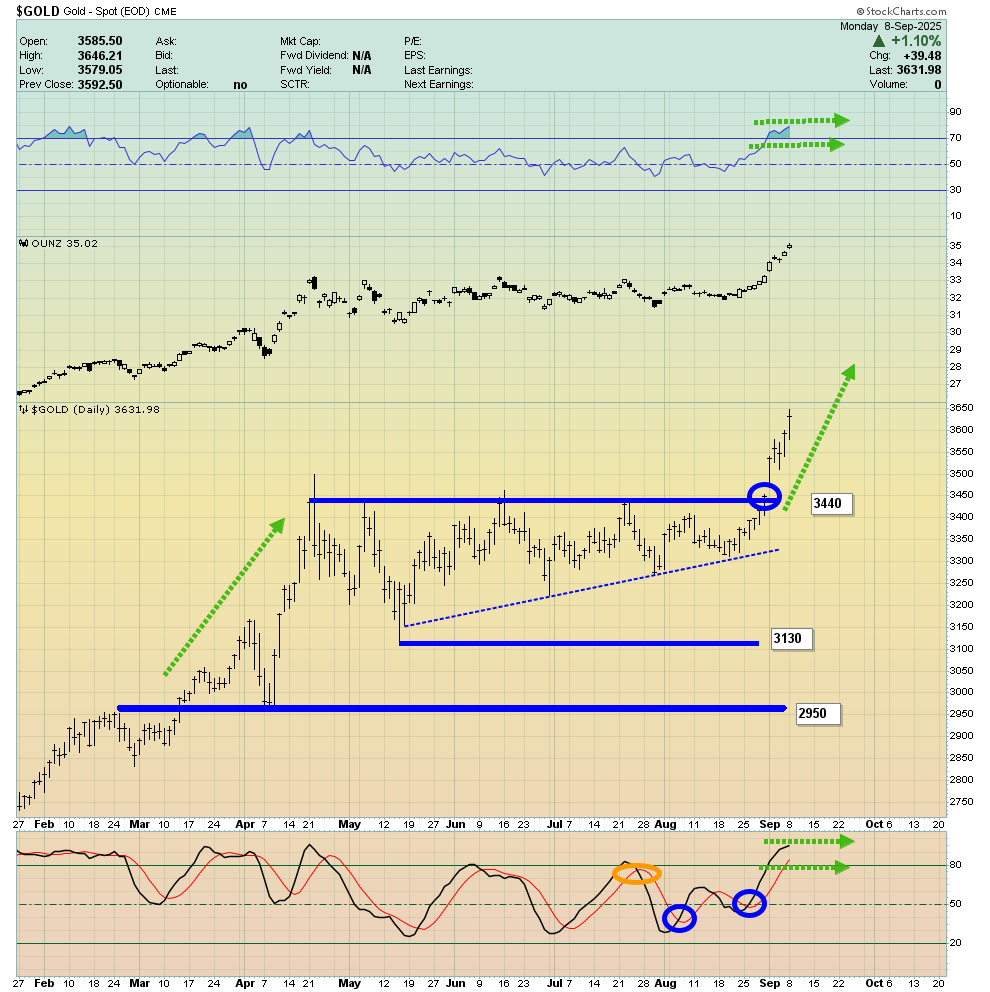
The daily chart is also a de facto work of bullish art and an April-October cycle inversion is in play. In a nutshell:
It looks like tenacious gold, silver, and mine stock investors are going to be getting a lot more higher priced “candy” in time for this year’s October 31 Halloween.
What about the stock market?
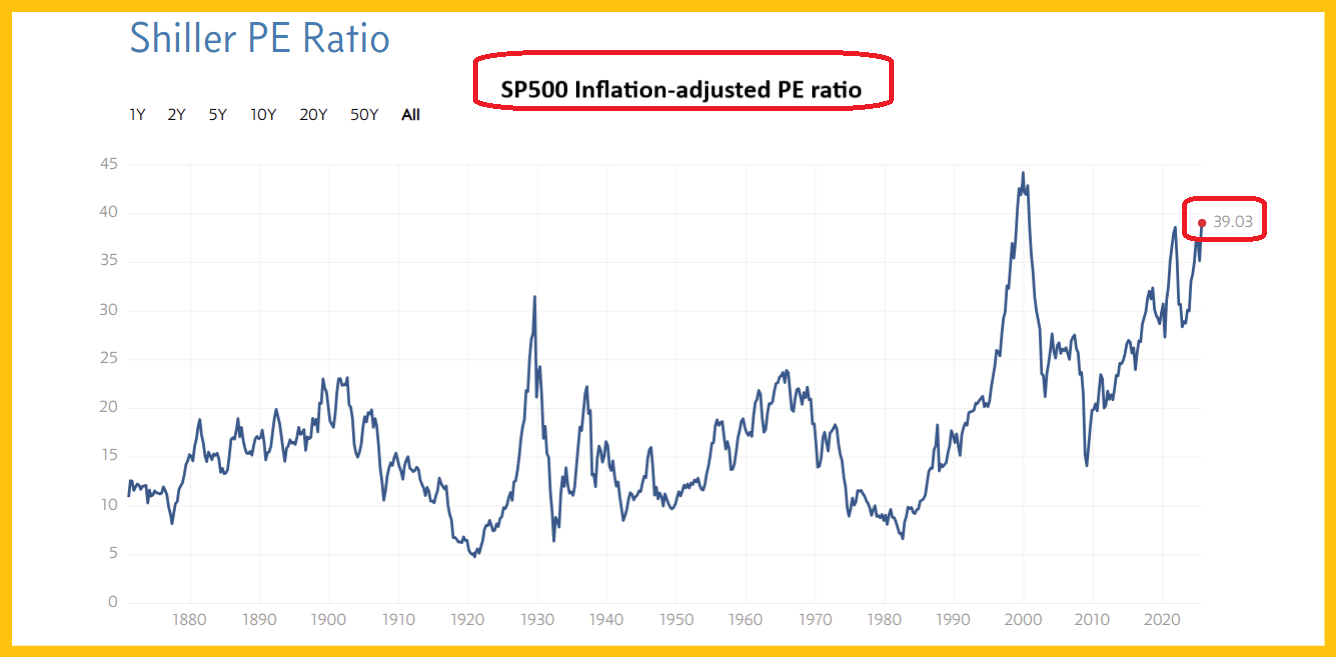
This is a disturbing SP500 CAPE ratio chart. Gamblers can play the US stock market, but investors need to await a significant price sale before getting involved.
Some investors forgot that gold often does better under a US republican administration than a democrat one… and they’ve missed what is essentially a gold and mining stocks moonshot against vile government fiat.
Is it too late for them to get involved? That’s a great question and the answer is an emphatic “No, it’s not too late to be involved!”.
This cycle inversion should provide investors with another 6 to 8 weeks of exciting action and even then, what follows should be just a healthy pause in the bull era fun.
The next big downside event for the metals is likely to occur in 2029, which of course is the 100th anniversary of the famous 1929 US stock market crash. Gold could be trading near $10,000/oz by then and GDX should be somewhere between $200 and $500.
I’m projecting the 2029 crash to be a lot like the 2008 crash, meaning it ends almost as soon as it starts.
The next massive five wave surge for gold (basis Elliott analysis) likely begins in the same year the current one ends (2029) and there’s more good news: It’s likely to feature Western money managers treating gold with the kind of respect it currently gets from their savvy Asian counterparts.
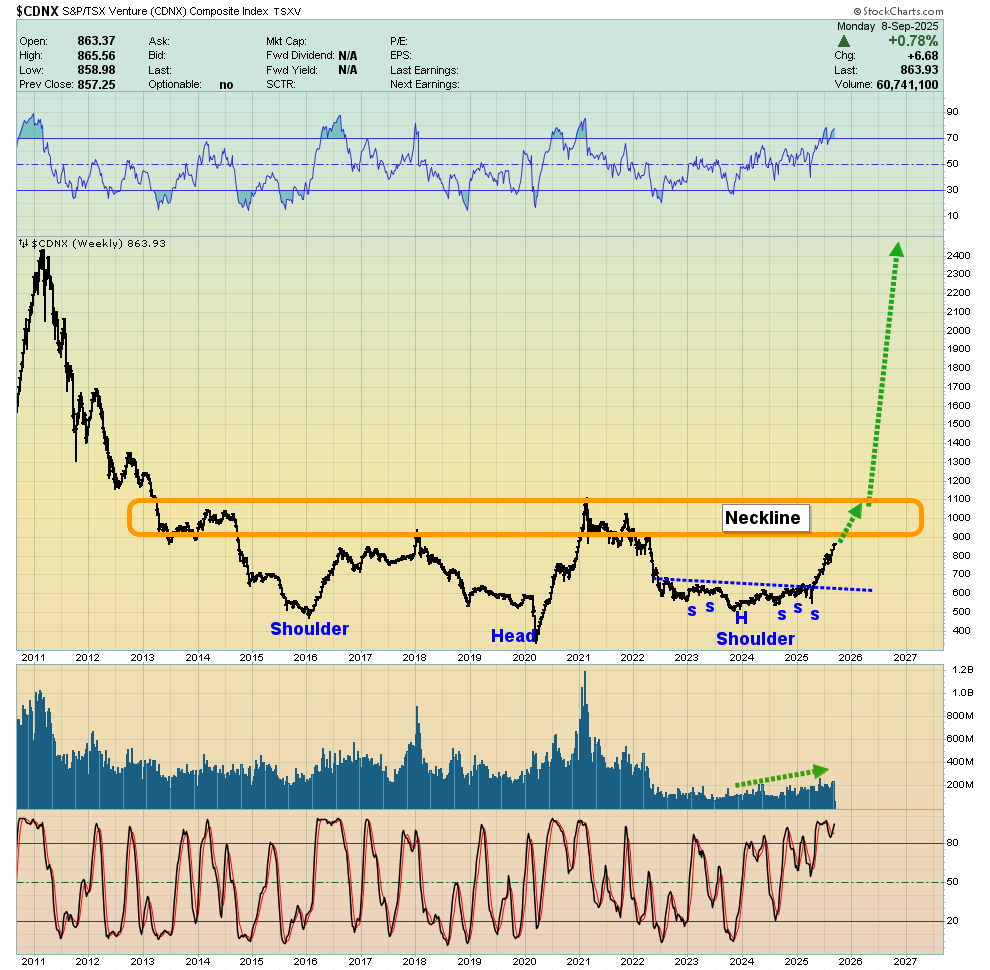
I’ve dubbed this as one of the greatest charts in the history of markets. It’s helping create a scenario where the CDNX hits 10,000 or more before the party is temporarily halted in 2029.
Also, the current rally to the 900-1000 inverse H&S neckline zone fits with the April-October cycle inversion scenario. Price arrival at the neckline likely happens soon, and a pause is likely, but not a top.
Junior mining stock investors who have followed my earlier calls to buy are now loaded with profits of 100%-1000% in a myriad of their CDNX and US OTC holdings. That neckline area is a great place to book some profit, but not to call a big top. The selling is simply to manage risk and to make sure investors get richer.
Junior mine stock investing isn’t for everyone, especially with size, but as this gargantuan gold bull era rollout continues, these miners look set to outperform everything! At $199/year, my junior resource stocks newsletter is an investor favourite, and I’m doing a special pricing this week of $169 for 14mths! Send me an email or click this link if you want the special offer and I’ll get you onboard. Thanks!
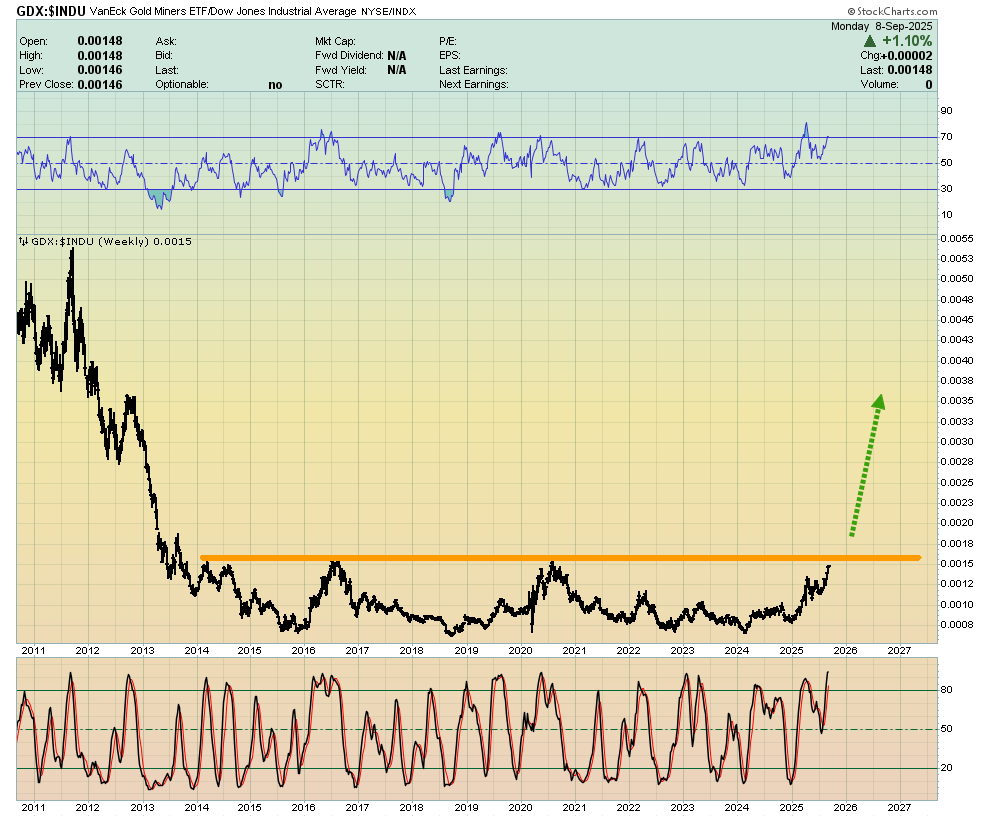
This is the stunning GDX versus Dow chart. I’ve urged senior mine stock investors to study the long-term CDNX charts I’ve highlighted… and use them as divining rods to show what lies ahead for their senior mining stocks.
Clearly, the synergy between the CDNX chart and the GDX versus Dow chart is phenomenal. Horrifically, the US stock market is now powered by little more than an outrageous CAPE 39 ratio and “better than expected” tariff tax news (and perhaps soon by a president eating refund the silly taxes crow?).
To put it mildly, these are not solid investment pillars to bank on for long-term stock market investing success.
In contrast, gold stocks are sporting some of the greatest value-oriented charts in the history of markets. Here is one of these fabulous bull era jewels:
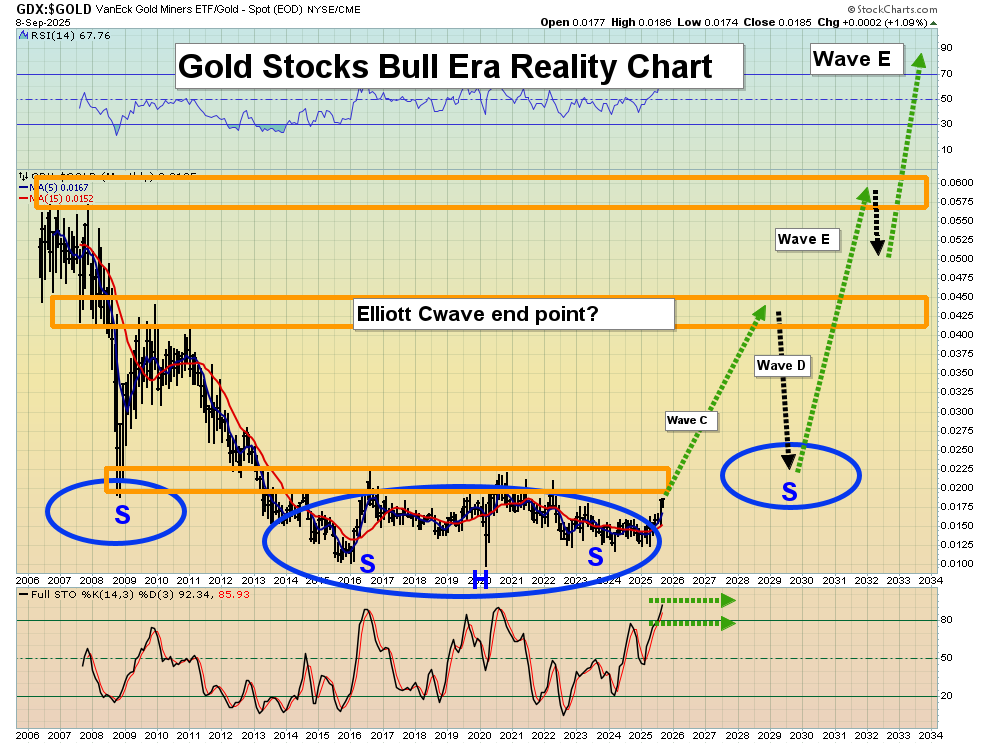
While the Elliott C wave for gold has likely been in play since 2015 or 2019, the C wave for GDX versus gold is barely underway… and it may not end until 2029!
For a look at the daily GDX chart:
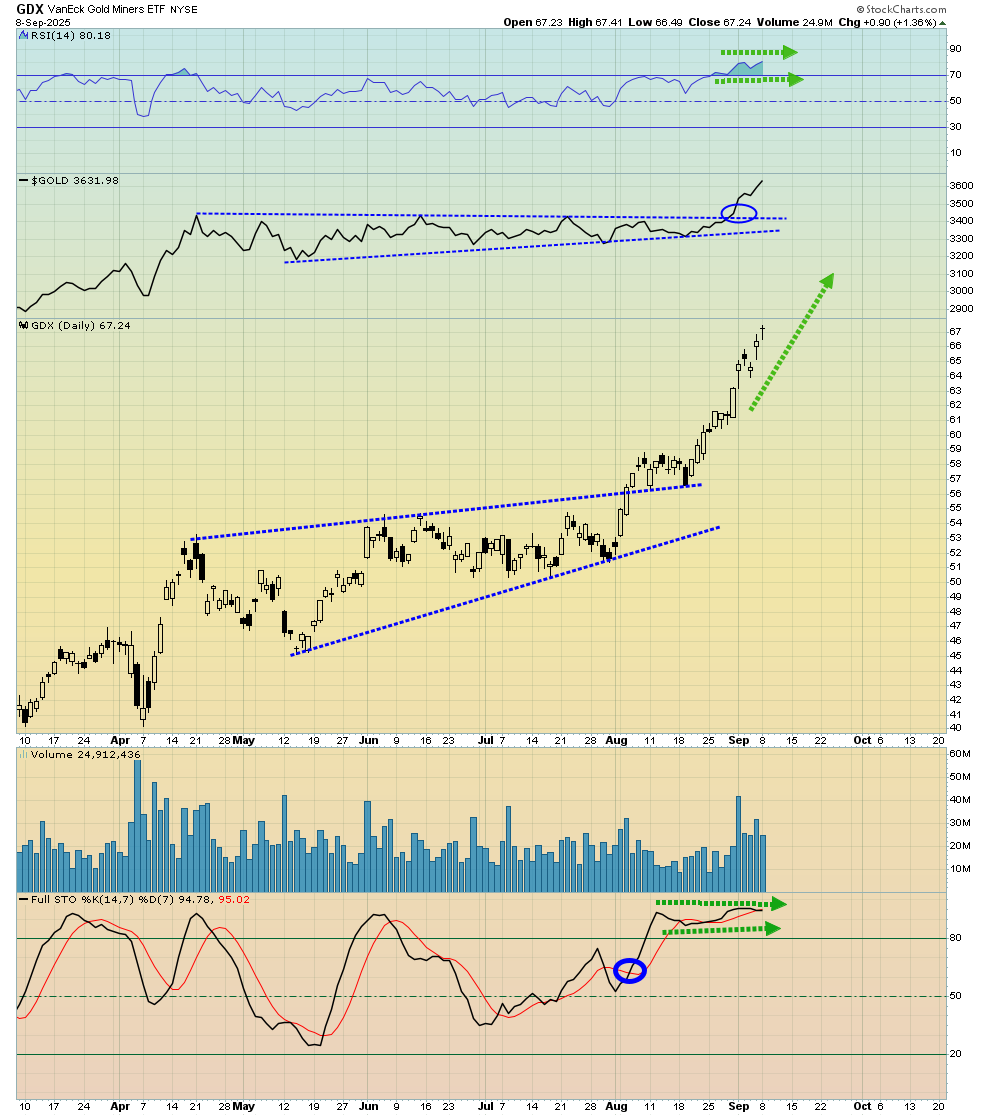
When the price of anything is rising up from a massive multi-decade base pattern (as it is for gold stocks versus gold right now), traditional technical analysts get baffled by the ongoing overbought oscillator situations that occur on the short-term charts.
That’s what’s happening with this GDX daily chart. What could be next? Well, it looks like what’s next will be an even more bullish ongoing overbought oscillator situation… with long term quarterly and monthly charts.
In a nutshell, it’s a 200year gold bull era and the choice for investors is to worship their government and do as they’re told, or be bold …and focus on getting more gold!
Thanks!
Cheers
St
Special Offer For Gold-Eagle Readers: Please send me an Email to [email protected] and I’ll send you my free “Get Jacked With J!” report. I highlight key GDXJ stocks that could surge after Fed man Jay’s speech this week! Both core and trading position tactics are included in the report.
Stewart Thomson
Galactic Updates
Note: We are privacy oriented. We accept cheques, credit card, and if needed, PayPal.
Written between 4am-7am. 5-6 issues per week. Emailed at aprox 9am dailyhttps://www.gracelandupdates.com/
Email:
Rate Sheet (us funds):
Lifetime: $1299
2yr: $299 (over 500 issues)
1yr: $199 (over 250 issues)
6 mths: $129 (over 125 issues)
To pay by credit card/paypal, please click this link:
https://gracelandupdates.com/subscribe-pp/
To pay by cheque, make cheque payable to “Stewart Thomson”
Mail to:
Stewart Thomson / 1276 Lakeview Drive / Oakville, Ontario L6H 2M8 Canada
Stewart Thomson is a retired Merrill Lynch broker. Stewart writes the Graceland Updates daily between 4am-7am. They are sent out around 8am-9am. The newsletter is attractively priced and the format is a unique numbered point form. Giving clarity of each point and saving valuable reading time.
Risks, Disclaimers, Legal
Stewart Thomson is no longer an investment advisor. The information provided by Stewart and Graceland Updates is for general information purposes only. Before taking any action on any investment, it is imperative that you consult with multiple properly licensed, experienced and qualified investment advisors and get numerous opinions before taking any action. Your minimum risk on any investment in the world is: 100% loss of all your money. You may be taking or preparing to take leveraged positions in investments and not know it, exposing yourself to unlimited risks. This is highly concerning if you are an investor in any derivatives products. There is an approx $700 trillion OTC Derivatives Iceberg with a tiny portion written off officially. The bottom line:
Are You Prepared?
********
 Stewart Thomson is president of Graceland Investment Management (Cayman) Ltd. Stewart was a very good English literature student, which helped him develop a unique way of communicating his investment ideas. He developed the “PGEN”, which is a unique capital allocation program. It is designed to allow investors of any size to mimic the action of the banks. Stewart owns GU Trader, which is a unique gold futures/ETF trading service, which closes out all trades by 5pm each day. High net worth individuals around the world follow Stewart on a daily basis. Website: www.gracelandupdates.com.


