Gold Stocks Perform Best After They Look Their Worst
 share
share
 share
share
 share
share
 share
share
 share
share
It has been a very rough time for precious metals. In recent months they have endured another terrible selloff that feels like a combination of 2013 and 2008.
However, think about how they “looked” technically before major bottoms, like during 2000, 2008, and late 2015. They also looked terrible at other important lows in 2005, 2018, and March 2020.
The good news is that they recovered in each instance, and significantly so.
But that aside, I want to show how the charts looked right before the gold stocks began huge moves higher.
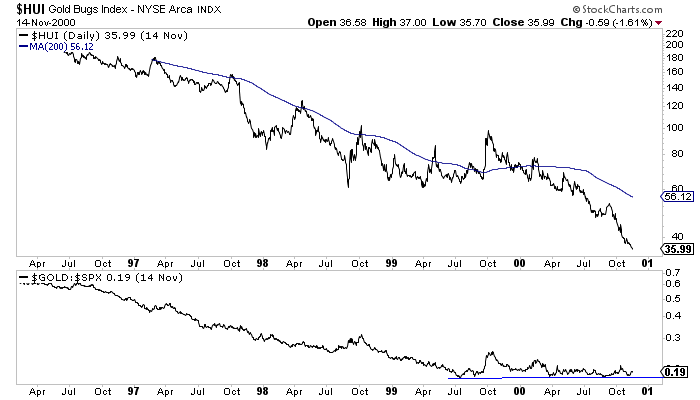
Here is late 2000, during the worst bear market ever in gold stocks. Note the Gold to S&P 500 ratio at the bottom.
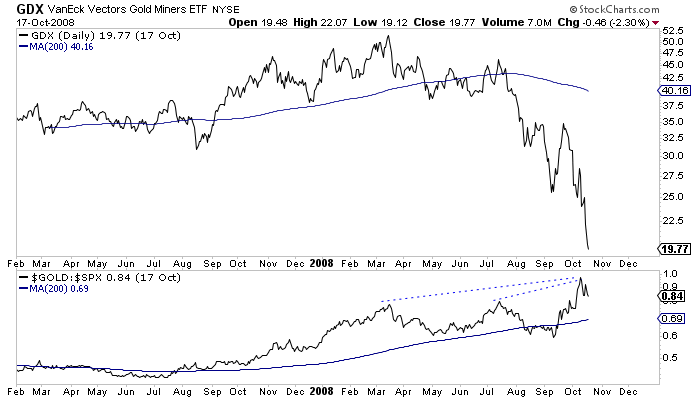
Here is the 2008 crash. Gold against the S&P 500 was sporting an extremely strong positive divergence right before precious metals bottomed in late October.
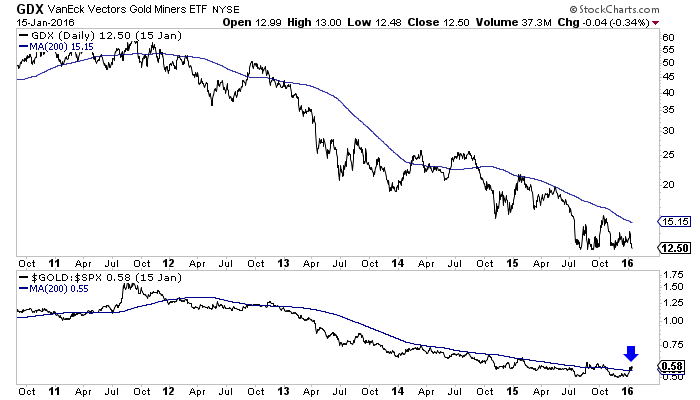
In the first half of January 2016, gold stocks had broken to a new low, yet the Gold to S&P 500 ratio had moved above a near flat 200-day moving average. This was the worst bear market in the history of gold stocks.
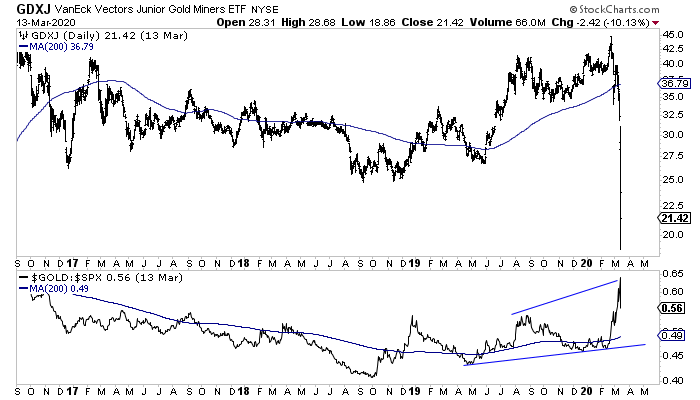
Remember the Covid crash in March of 2020? What an ugly chart. But Gold to the S&P 500 showed a strong positive divergence.
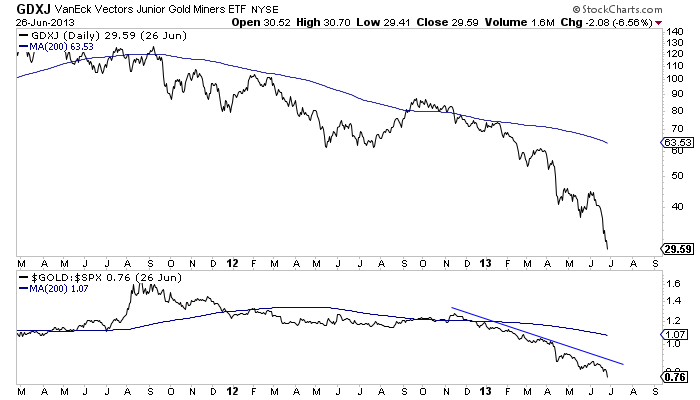
The bears will point to 2013. Here is a chart of GDXJ from 2011 to mid-2013.
The gold stocks were down roughly 70% by the summer of 2013 but were dead money for another two-plus years.
The big difference between 2013 and these other periods is at the bottom of the chart. After the crash, Gold continued to make lower lows against the S&P 500.
Oh, the secular bull in Gold had just ended, and the S&P 500 would soon break out from a 13-year base. (Perhaps the opposite of today).
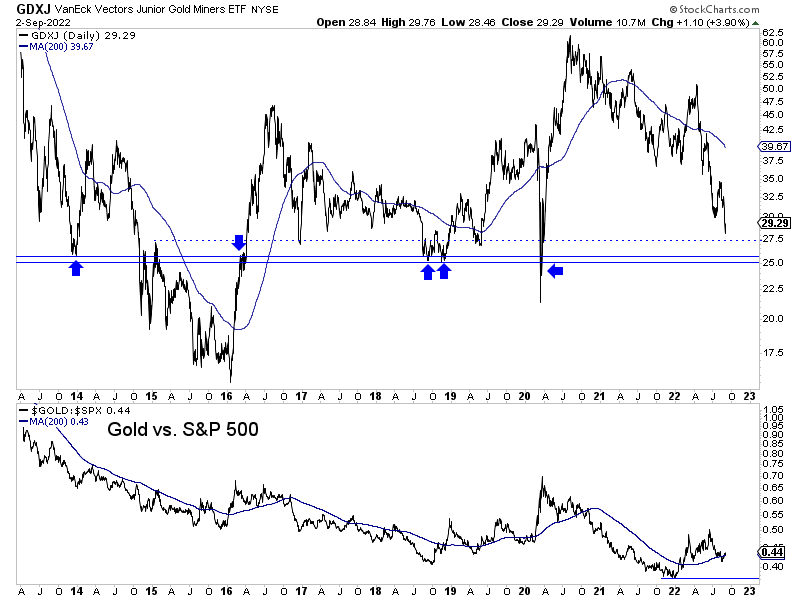
Here is GDXJ right now. Note the very strong support around $25-$26. More importantly, note how the Gold to S&P 500 ratio bottomed nearly exactly when the stock market peaked.
One should not become fully bullish only because the charts look bad.
We must take into account technical support, sentiment, and fundamentals. There were key fundamental shifts (varying degrees) around the 2000-2001, 2008, 2016, 2018, and 2020 bottoms.
The upcoming fundamental shift will be when the market forces the Fed to stop hiking essentially because the stock market is signaling a recession. If and when this happens, we can add 2022 to that bottom list.
The bear case would be that this outcome will require more than a few months, and Gold is at risk of breaking below $1675. Essentially, fundamentals are not ready to shift just yet.
Keep an open mind but realize that the Fed will have to shift and cut rates at some point, sparking, at worst, a huge rebound in precious metals.
I continue to focus on finding high-quality juniors with at least 5 to 7 bagger potential over the next few years. To learn the stocks we own and intend to buy, with at least 5x upside potential after this correction, consider learning more about our premium service.
********
share
share
share
share
share

Jordan Roy-Byrne, CMT is a Chartered Market Technician and member of the Market Technicians Association. He is the publisher and editor of TheDailyGold Premium, a publication which emphasizes market timing and stock selection, as well as TheDailyGold Global, an add-on service for subscribers which covers global capital markets. He is also the author of the 2015 book, The Coming Renewal of Gold’s Secular Bull Market which is available for free. TheDailyGold.com was recently named one of the top 50 Investment Blogs by DailyReckoning and WalletHub.


