Gold Stocks Vs Gold – Not A Good Bet


Earlier this year, various gold stock indices (XAU, HUI, GDX) gained more than fifty percent in just three months. Most of the negativity associated with the sector was brushed aside and replaced by positive expectations for the future.
Of course, the 90-day rush to this year’s highs did not occur in a vacuum. The price of gold rose by twenty percent over the same three-month period. The mining shares, however were considerably stronger.
Going back to the fall of 2018, the price of gold increased by thirty percent and gold mining shares increased by about sixty-five percent. The resulting differential of more than 2-to-1 in favor of the mining shares lends possible credence to the argument for shares over bullion.
Nevertheless, when we dig a bit deeper, we see a different picture. See the chart below…
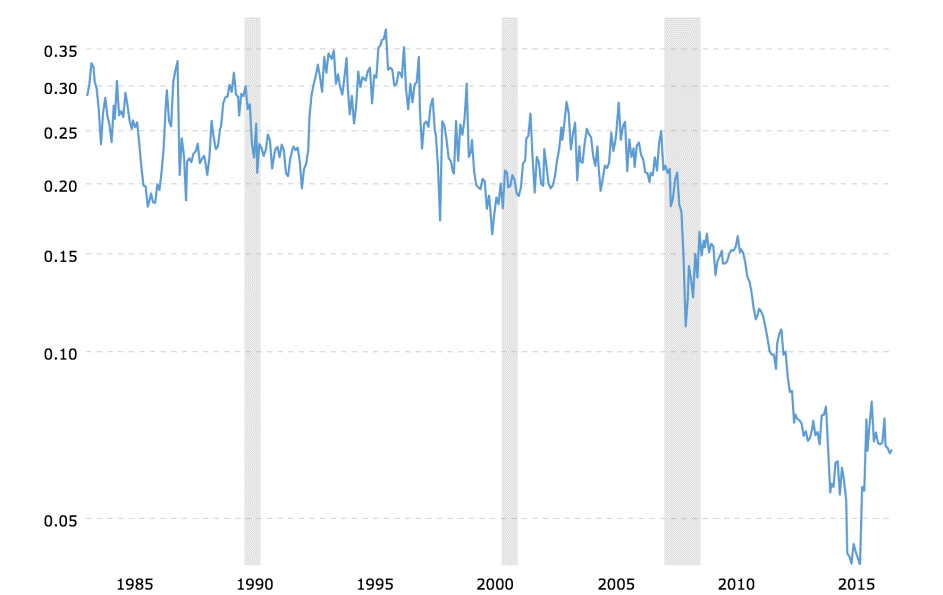
HUI to Gold Ratio (source)
This interactive chart shows the month-end ratio of the NYSE Arca Gold Bugs Index (HUI) to the price of gold bullion back to 1996. The 6 month moving average has been added to smooth out volatility and show the longer-term trend.

Looking at the chart above, we can see that gold stocks have declined much more severely than the price of gold bullion.
The potential advantage of owning gold mining stocks rather than physical gold, turned into a horrible disadvantage. The price of gold declined by forty-five percent but gold stocks dropped by more than eighty percent.
In other words, gold stocks dropped by nearly twice as much as gold bullion after gold peaked in 2011.
The results were not that good before that, either. Except for a brief three-year period between 2000-03, owning physical gold was less risky and provided better overall returns.
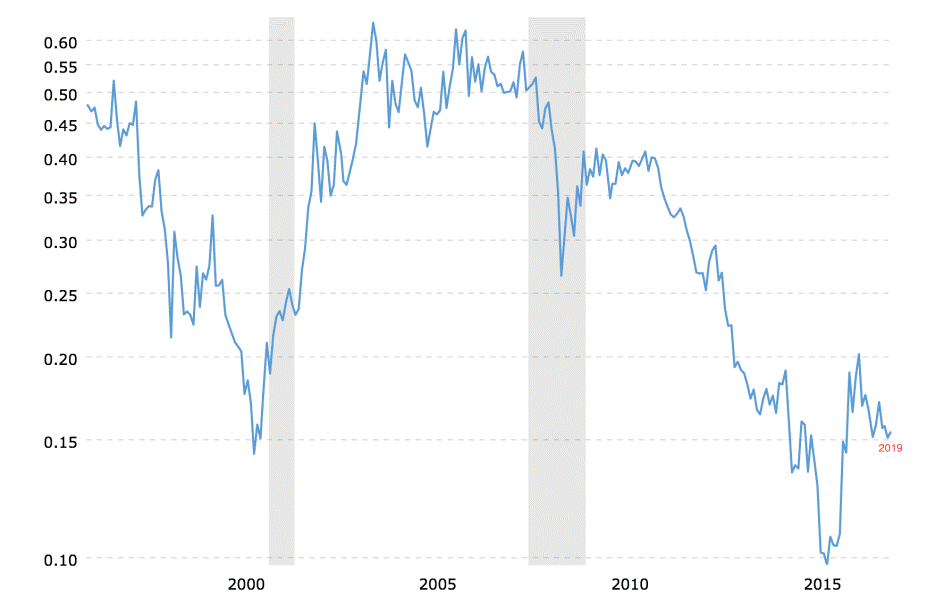
Below is a second chart, this one of the XAU gold stock index…
XAU to Gold Ratio (source)
This interactive chart shows the month-end ratio of the Philadelphia Gold and Silver Index (XAU) to the price of gold bullion back to 1983. The current month shows the latest daily closing values.
As can be seen, going back as far as 1983, the presumed advantage of owning gold shares over physical gold, does not appear to be evident.
Looking at the first chart again, we see that the HUI to gold ratio is at the same level as it was twenty years ago, when gold was at $275 per ounce. And, it has failed to exceed the level it reached three years ago in the summer of 2016.
Since that point in the summer of 2016, the price of gold has risen by as much as fifteen percent earlier this year. Currently, gold is up ten percent from that point.
Gold stocks, on the other hand, failed to even match their previous high, and are currently about thirteen percent lower than their peak levels of 2016. This can be seen on the chart below…
GDX – VanEck Vectors Goldminers ETF (source)

So how does this year’s performance for gold stocks vs. gold measure up historically? Below is the first chart above (HUI to Gold Ratio), again. This time the current year, 2019, is labeled. As you can see, this year’s outsized gains for gold stocks relative to gold is just a small blip…
Gold stocks have been a horrible, losing investment for decades. Compared to physical gold, i.e. their results are pathetic.
*********


