Golden Triangles


The triangle chart formation has been known to technical analysts for a very, very long time. Together with the other narrowing formations – the wedge and pennant – the triangle typically develops to a standard pattern. When pattern boundaries can be accurately identified, these chart formations complete 5 legs from side to side before there is a break from the formation. The price of gold developed at least five distinct triangular patterns – two with one flat side and one a pennant – since the price was floated in the early 70s. The patterns reflect the history of gold over the past 50 odd years and perhaps also what is lying in wait for the future.
To the best of my knowledge there is no credible explanation why the regular chart patterns such as narrowing formations, channels and the megaphones develop in so many time series and then do so over all time scales, from a few minutes and up to monthly averages. The majority of narrowing chart formation develop in the well-known ‘five leg’ pattern before the break from the pattern occurs, either at the end of leg five or not too long thereafter. In principle, it can be stated that they develop because of an interplay between bulls and bears; easy to say and grasp and accept as this apply to patterns that grow over a times span of minutes and hours, or even day; but accurately so, over many years?
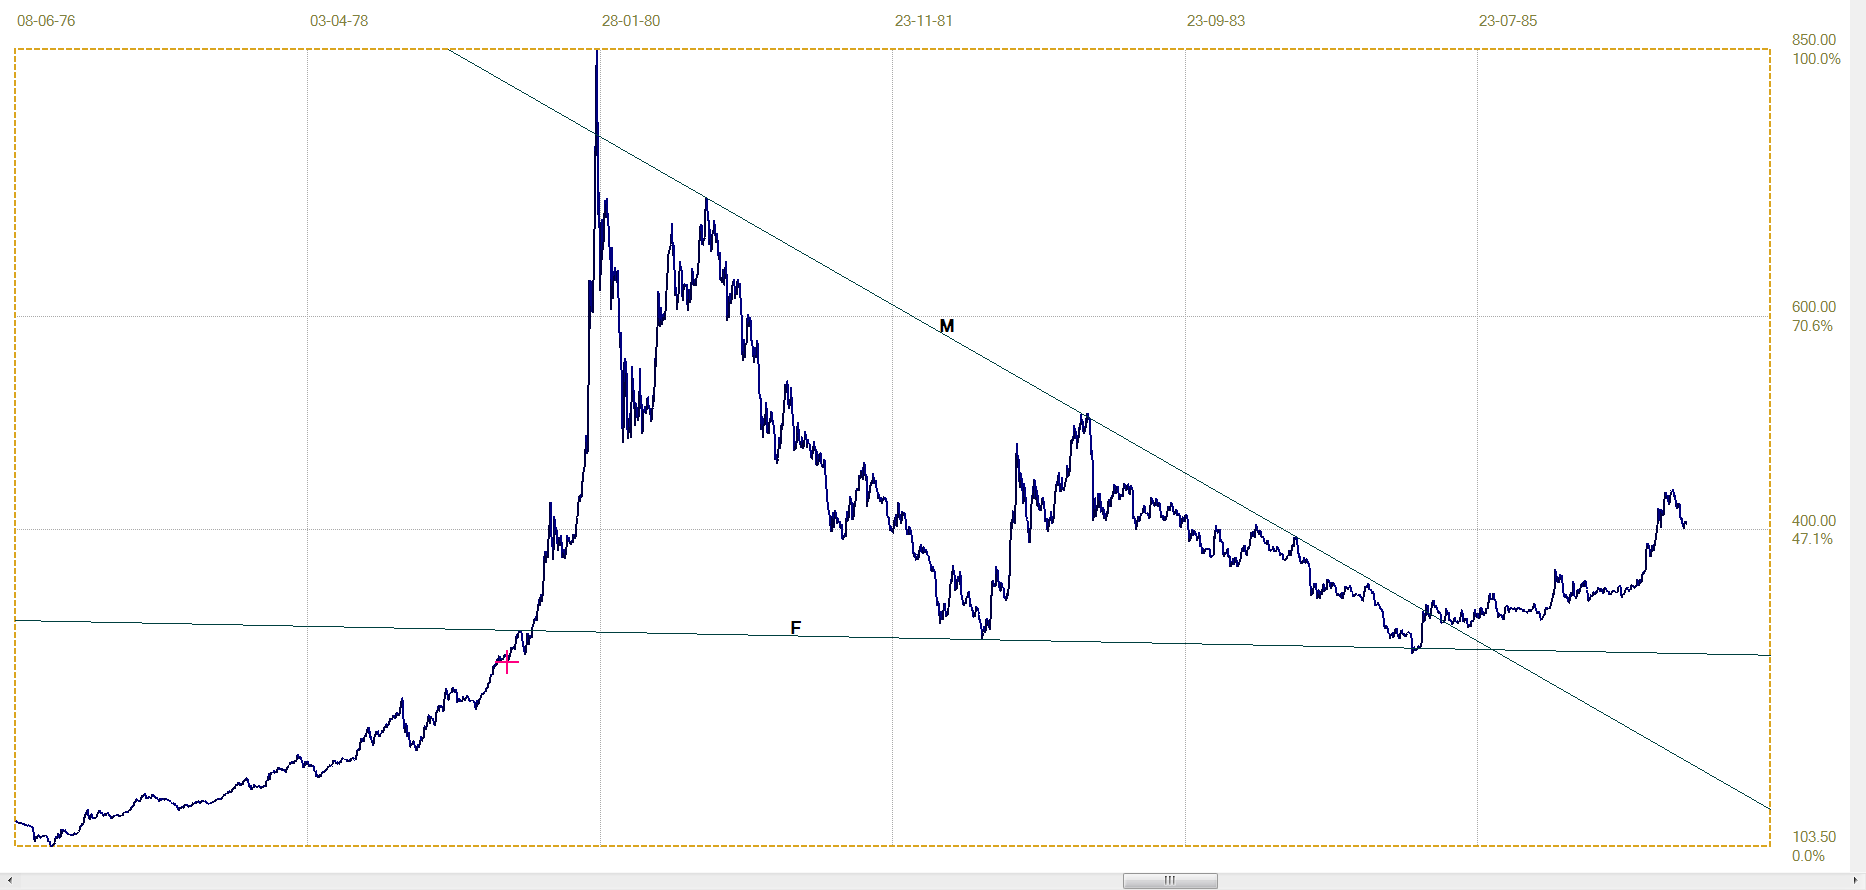
Chart 1. Gold PM fix daily. 8 June 1976 – 7 November 1986
The first example is the triangle that developed after the 1980 spike top in the price of gold. As usual in my analyses, a master gradient M is defined between prominent trend reversals and the gradients of all the other trend lines are derived from that gradient using the Fibonacci ratio. Except for the spike above line M, the fit to this triangle is very close; the break higher above line M taking place at the end of leg 5 and followed by a goodbye kiss or two on line M.
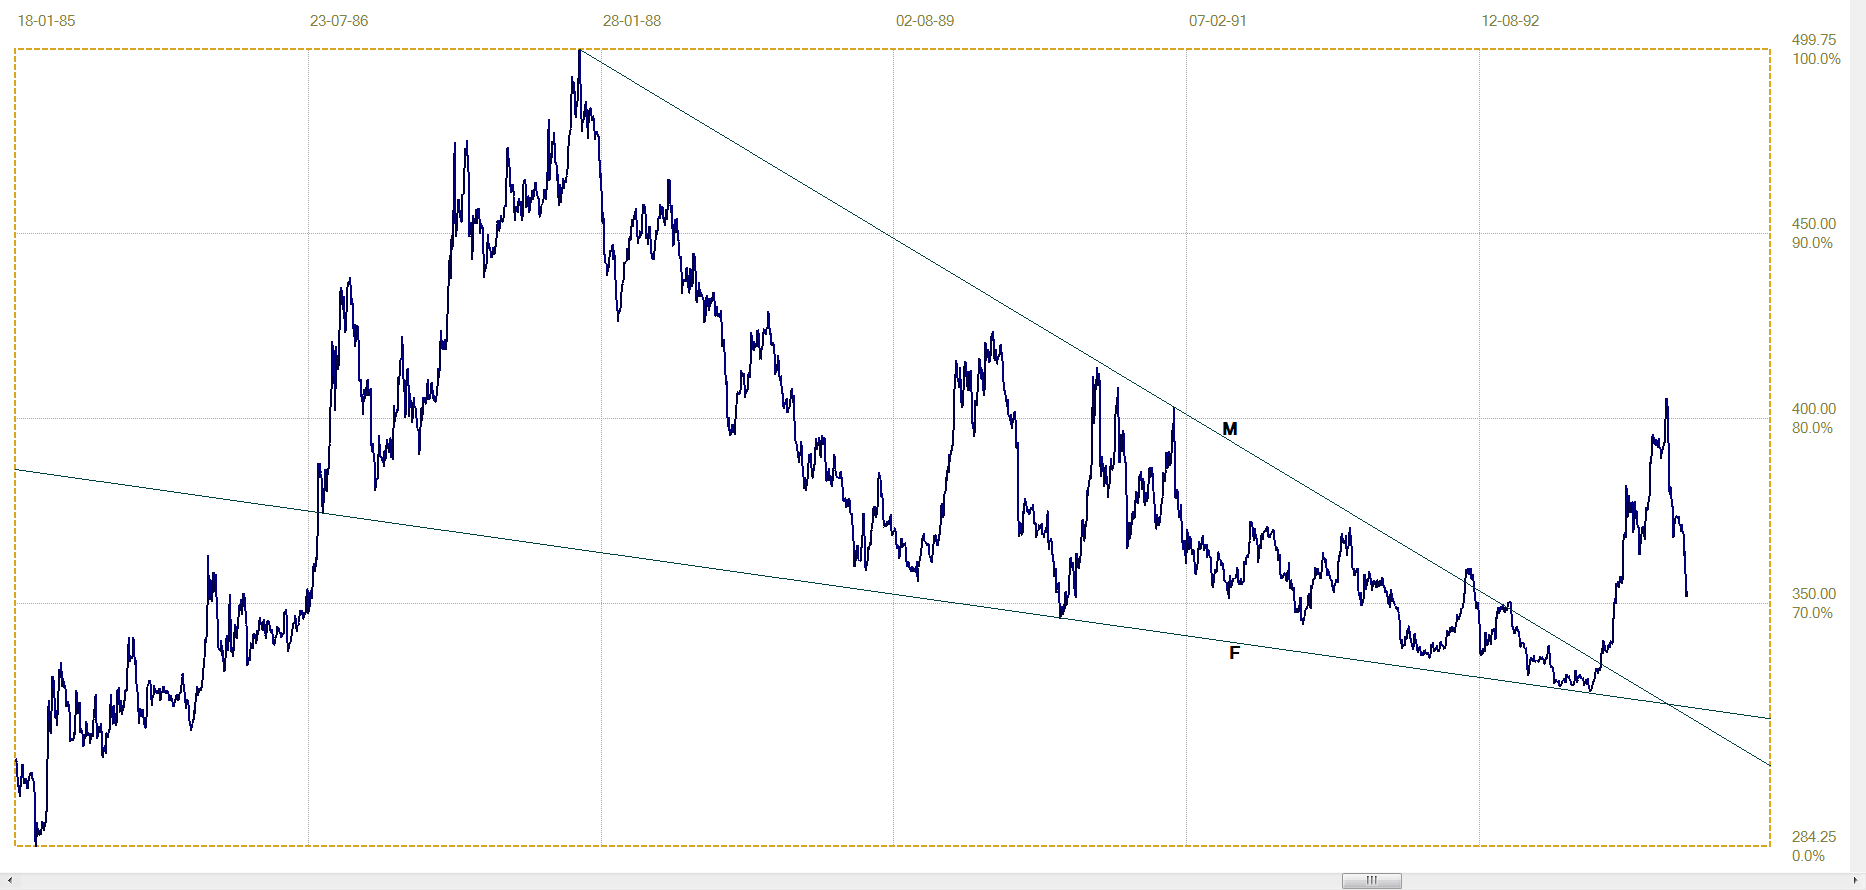
Chart 2. Gold PM fix daily. 18 January 1985 – 9 September 1993
Chart 2 shows that after the break higher from the triangle in Chart 1, the price rallied steeply to a high at $366 in December 1987, not too long after the October Crash. The bear market that followed was the first leg of another narrowing chart formation, a pennant, because the boundaries slope in the same direction. Line F provided accurate support over a span of 6.5 years. Line M was briefly penetrated by a rally in 1992. Since leg 4 had not yet been completed, so that, if it had lasted, it would have been a premature break from the pennant. Such premature breaks as a rule tend to be steep and sustained, but in this case this was not to be; the price returned to the pennant to complete leg 4 and then break clear at the end of leg 5.
The third chart, below, has a flat top – a conformation that is often treated as being different from a genuine triangle where the sides slope in opposite directions and a pennant, where the sides slope in the same direction. Here the near perfect flat top at a price of $395 has a minor and brief break higher in mid-1993 that topped out at $369.25. The level of these tops span a period from August 1993, shortly after the recession of the early 90s to the beginning of 1996, when the price held below $400 until the break above the flat topped triangle at the end of its leg 5.
At the time of the break higher, I predicted a medium to long term bull market for gold. This was correct until February 2, when the PM fix was $414.80 after a high just above $415. That reversal was the start of the bear market that lasted until 2000, when gold finally made a double bottom in July-August 1999 at $252.80. The reversal at $415 after the break higher from the triangle in Chart 3 was the event that convinced me of intervention in the gold market; it also explained the flat top of the triangle below $400 over the three years, going back to 1993.
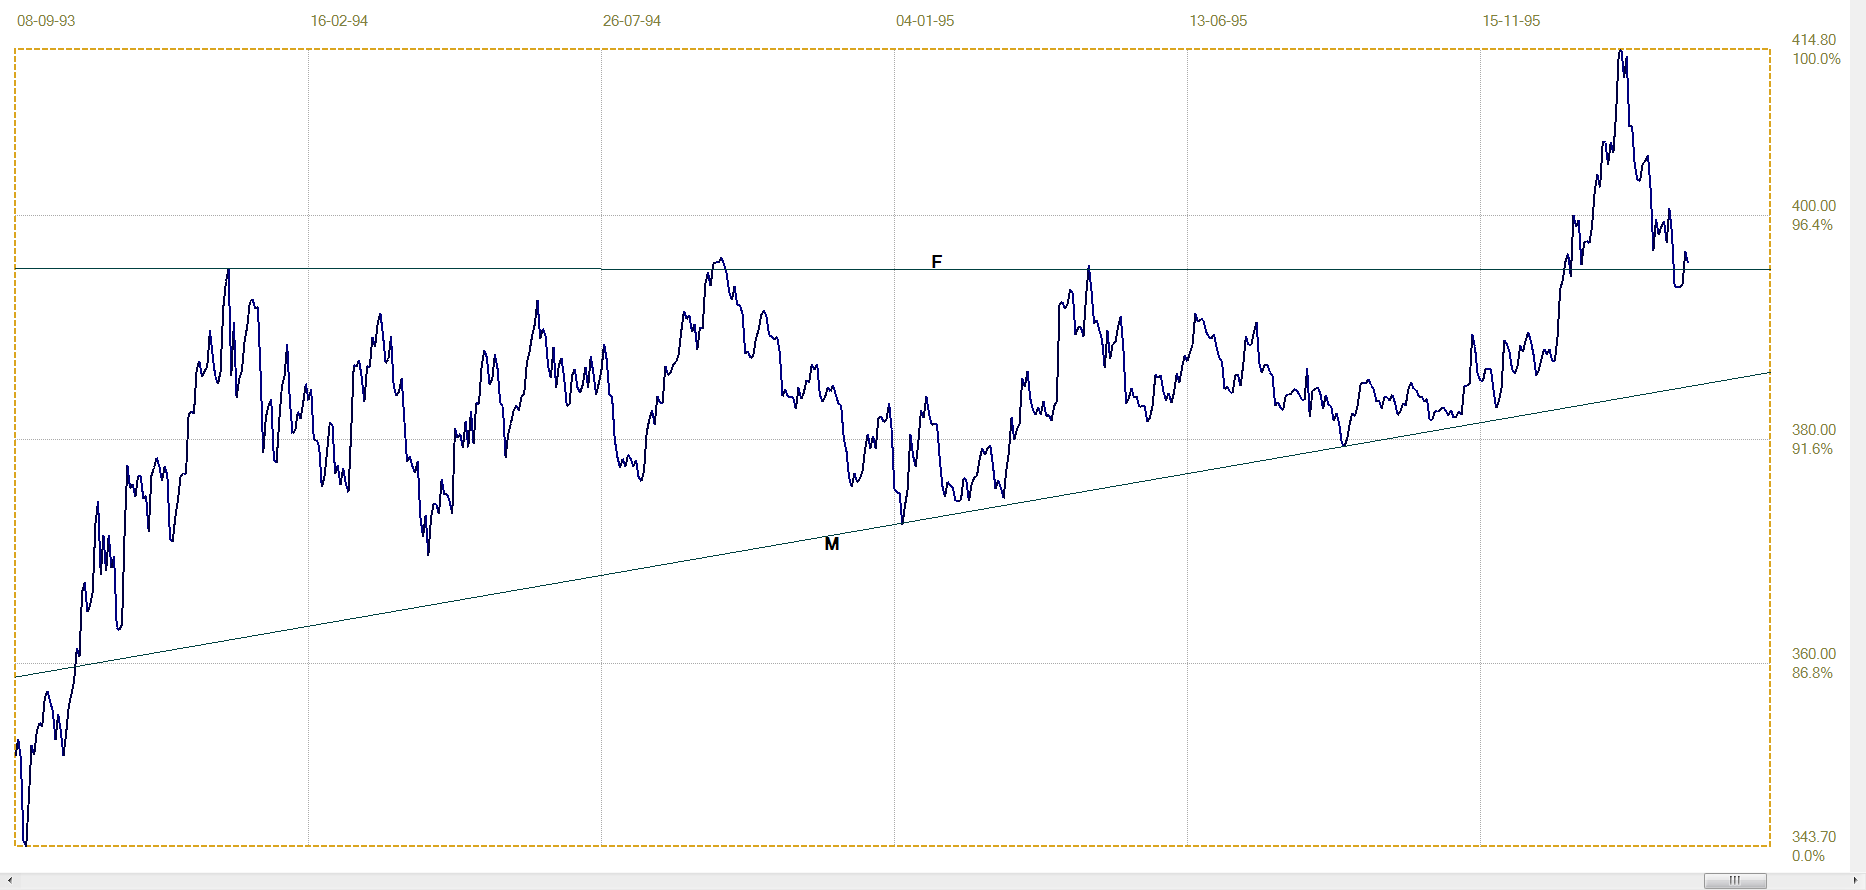
Chart 3. Gold PM fix daily. 8 September 1993 – 11 March 1996
If the reversal in 1996 came as a surprise, that feeling was eclipsed by what later happened in mid 2013 when triangle MF in Chart 4 broke in the wrong direction just after it had completed leg 4 of a well-defined triangle. I had followed the trend as leg 4 approached the bottom of the triangle and was ready to turn bullish when the price would reverse higher to begin leg 5; which should have triggered a new bull trend. The reversal did happen and it had just started to look good after the second bounce off line F when the Bear took over and broke below the triangle; followed by the familiar goodbye kiss on line F before the price fell away precipitously.

Chart 4. Gold PM fix daily. 23 July 2010 – 9 July 2013
Just as obviously as during the early 1990s, when gold was not allowed to break above $400, the possibility of a new bull market after the 2 year sideways trend was not to be tolerated. The post 2011 triangular trend was a tug of war between the bulls and vested interests that want to control the price; it was still inconclusive by 1993. At the first hint that the bull trend could resume, reinforcements had to be called in to prevent a rally. It is interesting that the period around 2011 coincides with some strange events in other US markets – a steep sell-off on Wall Street that started as the DJIA in mid 2011 broke lower from a rising pennant at the end of its leg five, ready to turn bearish into a medium term bear market at least. The DJIA soon reversed to resume the steep bull market. That period also saw a very steep rally in the 10-year bond market and the sudden end of a long bear market in the dollar followed by the start of a new bull market.
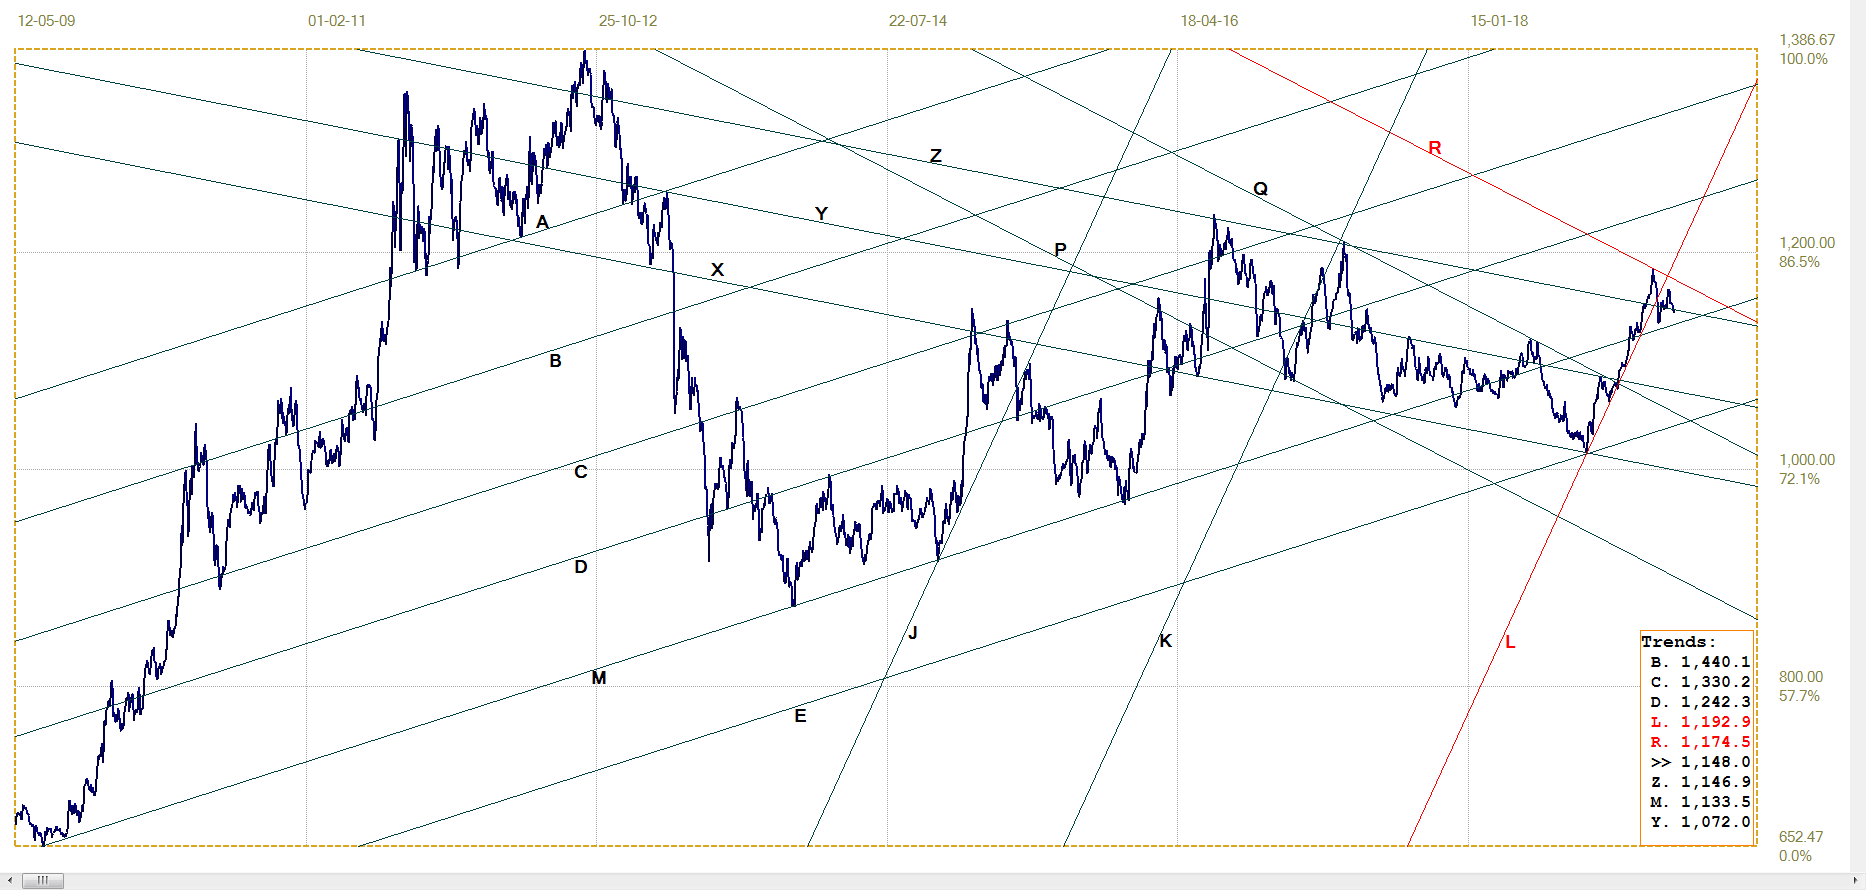
The last chart shows a triangle that is developing at this moment in time. Leg 5 has come pretty close to completing leg 5 by reaching line F again. The advantage of setting a master gradient and then deriving other trend lines from it is by doing so, accuracy is improved and analyst bias is reduced. This implies that line F passing through two sets of tops, but missing the most recent one is the correct analysis. We now have the price retreating lower in channel VW, holding to line W so far. It ended last week at support from line K and now has to rebound and break above channel VW to resume the rising trend. The possibility of moving sideways, out of channel VW, to later hold to bull channel JKL nevertheless has to be considered.
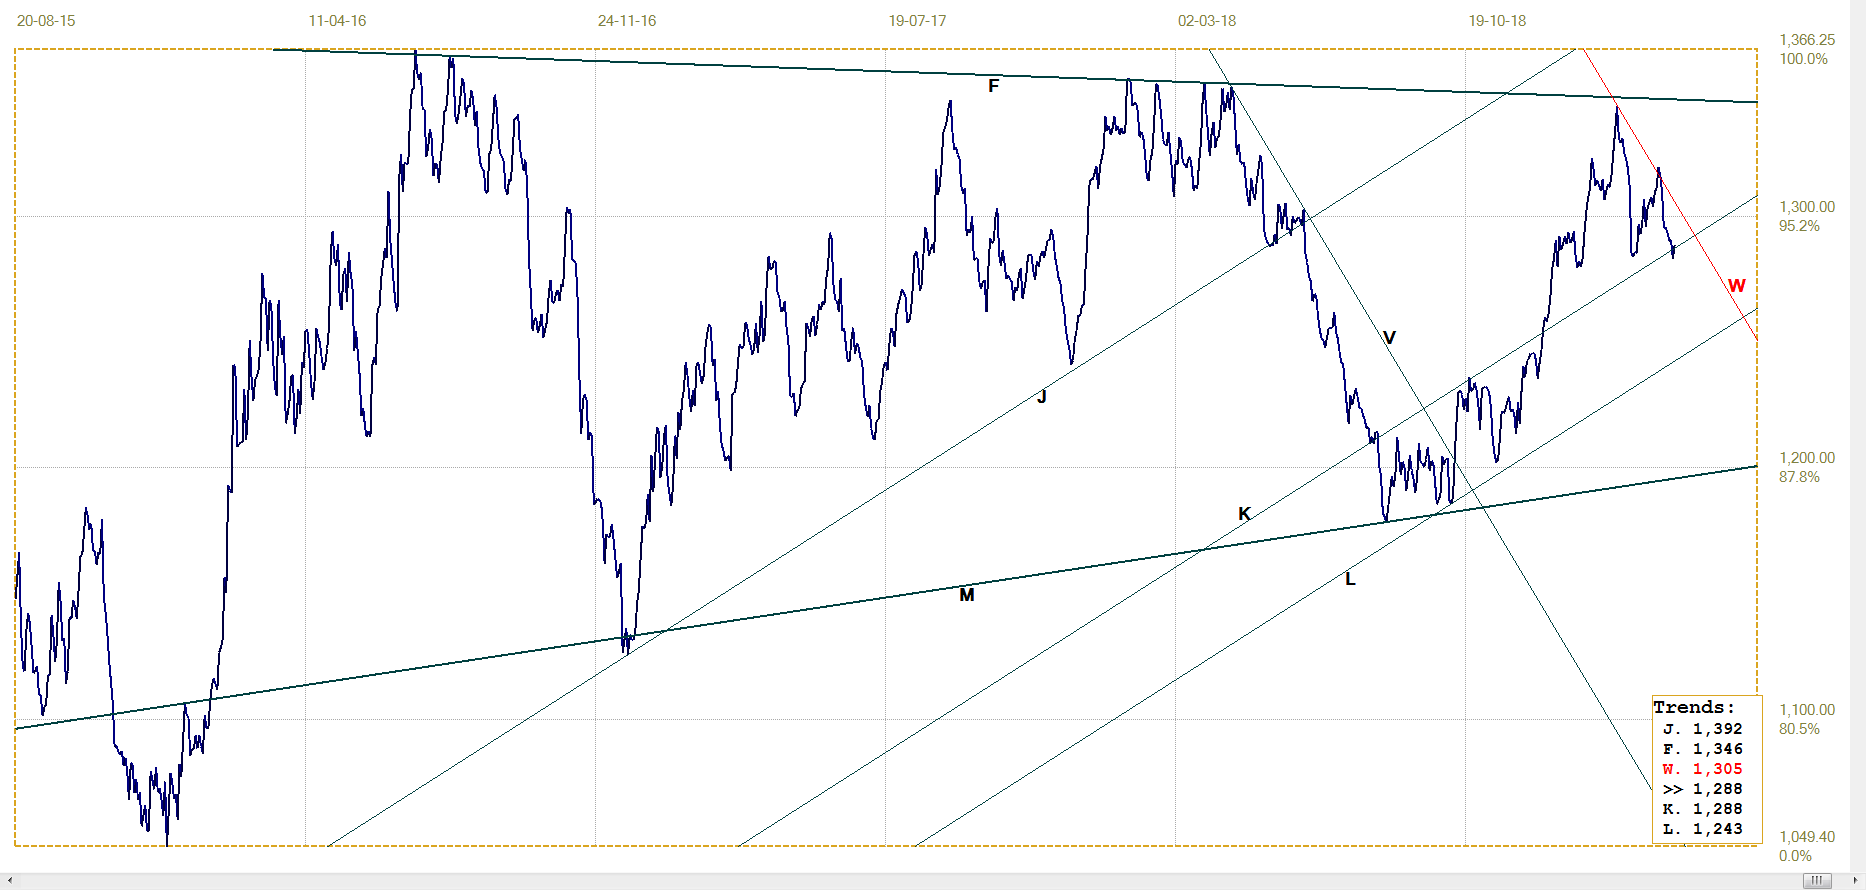
Chart 5. Gold PM fix daily. 20 August 2015 – 5 April 2019
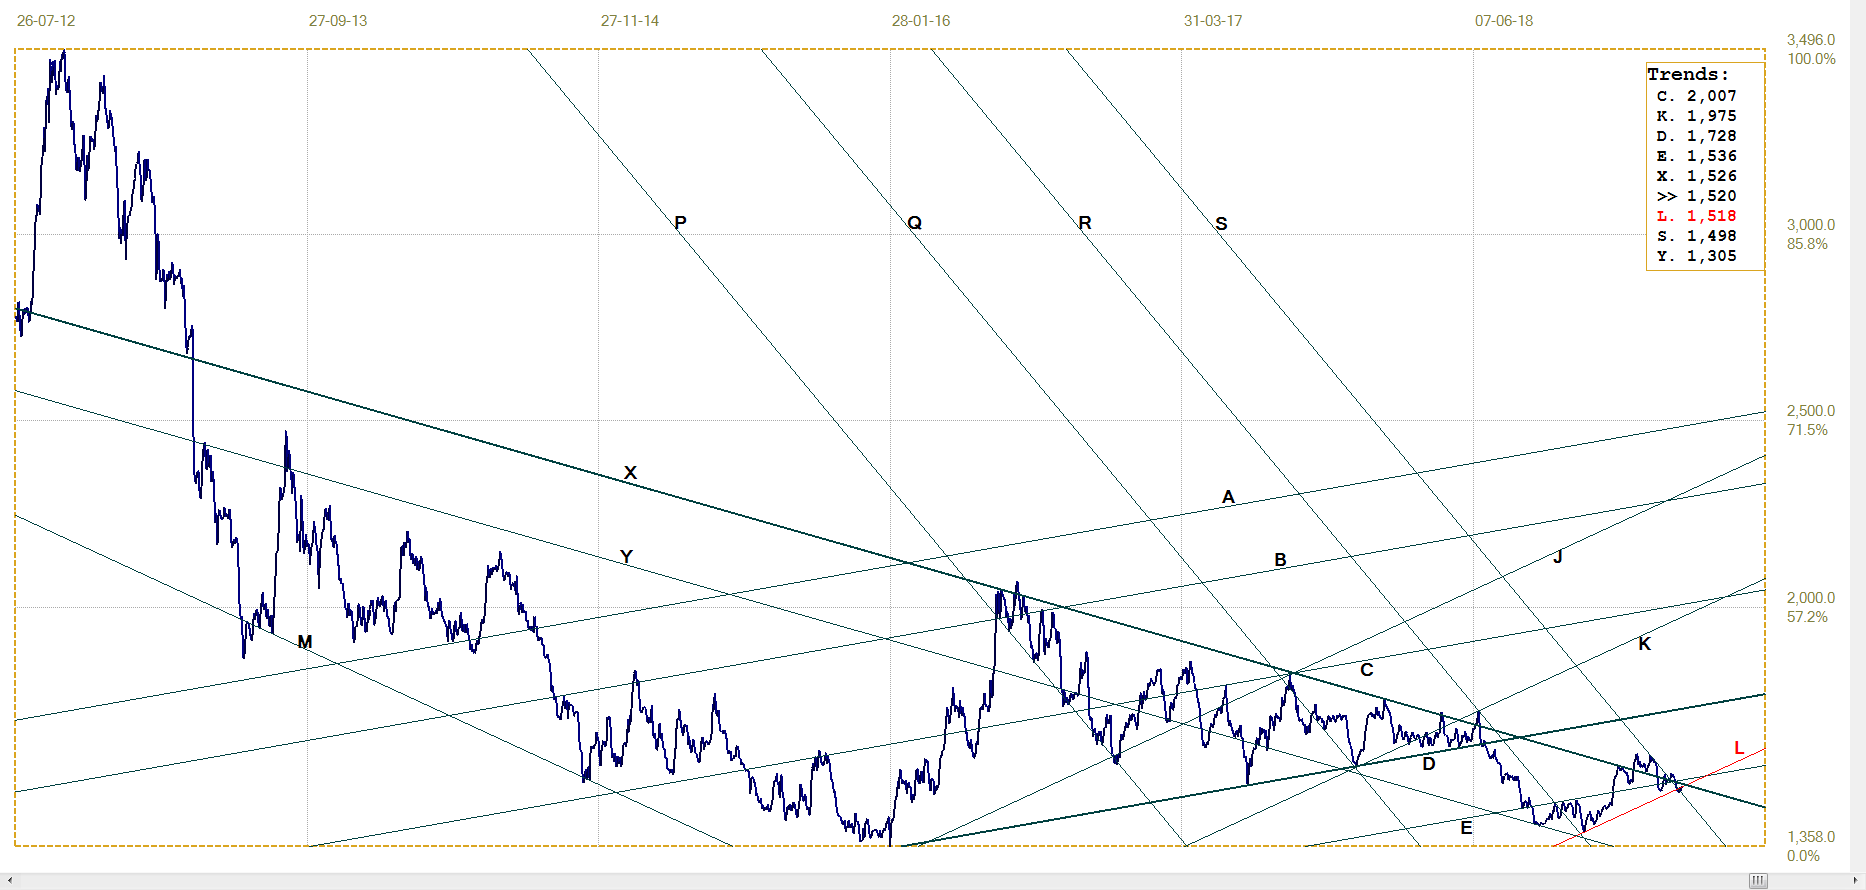
Chart 6 is a chart of the monthly close of the London PM fix. It shows two triangles that overlap. A tentative interpretation of the incomplete triangles AD and BD has the one as a bullish formation and the other one as bearish.
Triangle AD – if it were to develop into a proper triangle – has started on the third leg of the pattern. Normal development of this proto-triangle requires a move up to line A, currently at $1559, before turning bearish again; then to reach line D, now at $1236, later in time. That should then be followed by a reversal higher into leg 5 followed by a break higher above line A.
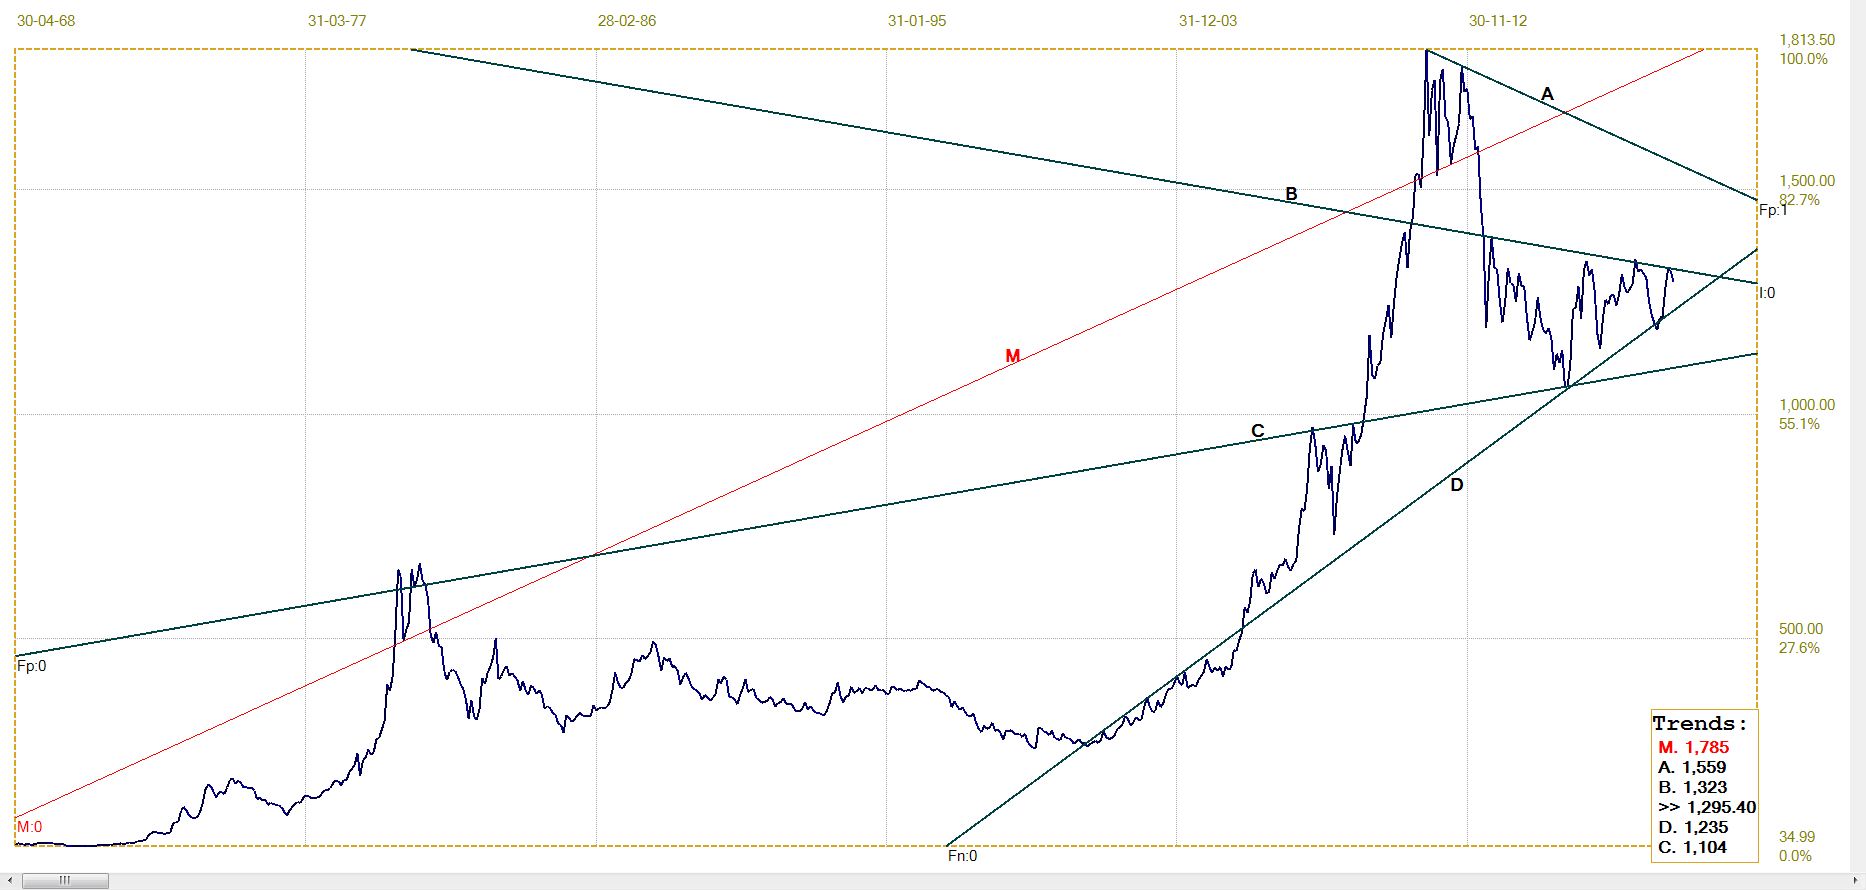
Chart 6. Gold PM fix. Monthly close. Last = $1295.40 (March)
The gold price entered triangle BD from the top; it is therefore a bearish triangle that can be expected to break lower when leg five, which has just started, breaks below line D. The possibility that the triangle in Chart 5 can break higher, should it complete normally, implies that triangle BD can break higher prematurely, doing so before leg four reaches line D. A full break higher in Chart 5 could result in a clear break above triangle BD, provided that the new rising trend then lasts long enough to have a significant effect on the monthly chart.
As mentioned, there is no explanation why triangles and the other chart patterns develop in similar fashion over all time scale. There is also even less understanding why the boundaries of a correctly designed triangle have gradients which share a relationship through the Fibonacci ratio. The good fit of this relationship is better illustrated in Charts 2, 4 and 6 where neither of the boundaries of the triangles are nearly horizontal, so that the good fit that is obtained with the relationship is clearly illustrated. More on this subject at a later time.
Euro–Dollar
There is not much to add to the euro-dollar chart that has not being repeatedly said during recent weeks to months. The euro is stuck in pennant PW trying to break above line W ($1.1317) while still on leg 4 of the pattern. It does not preclude a move to line P (1.1073), but the odds appear to favour a premature break higher to begin a sustained bull trend. Perhaps we’ll know by next week?
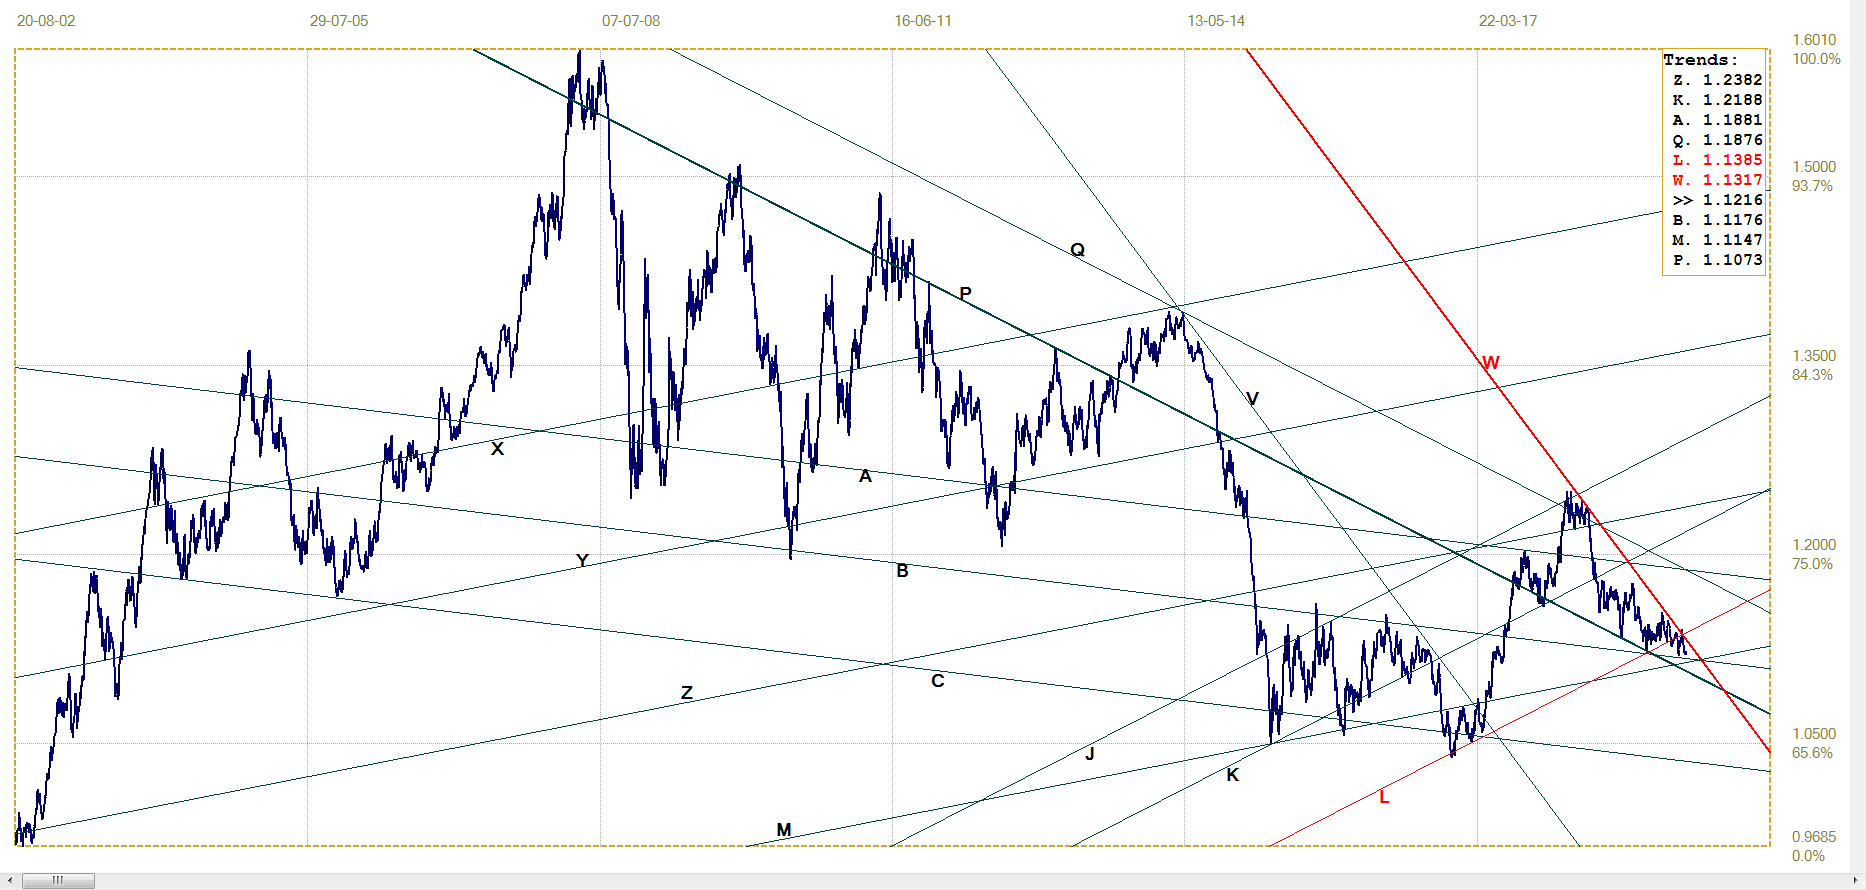
Euro–dollar, last = $1. 1268 (www.investing.com)
DJIA
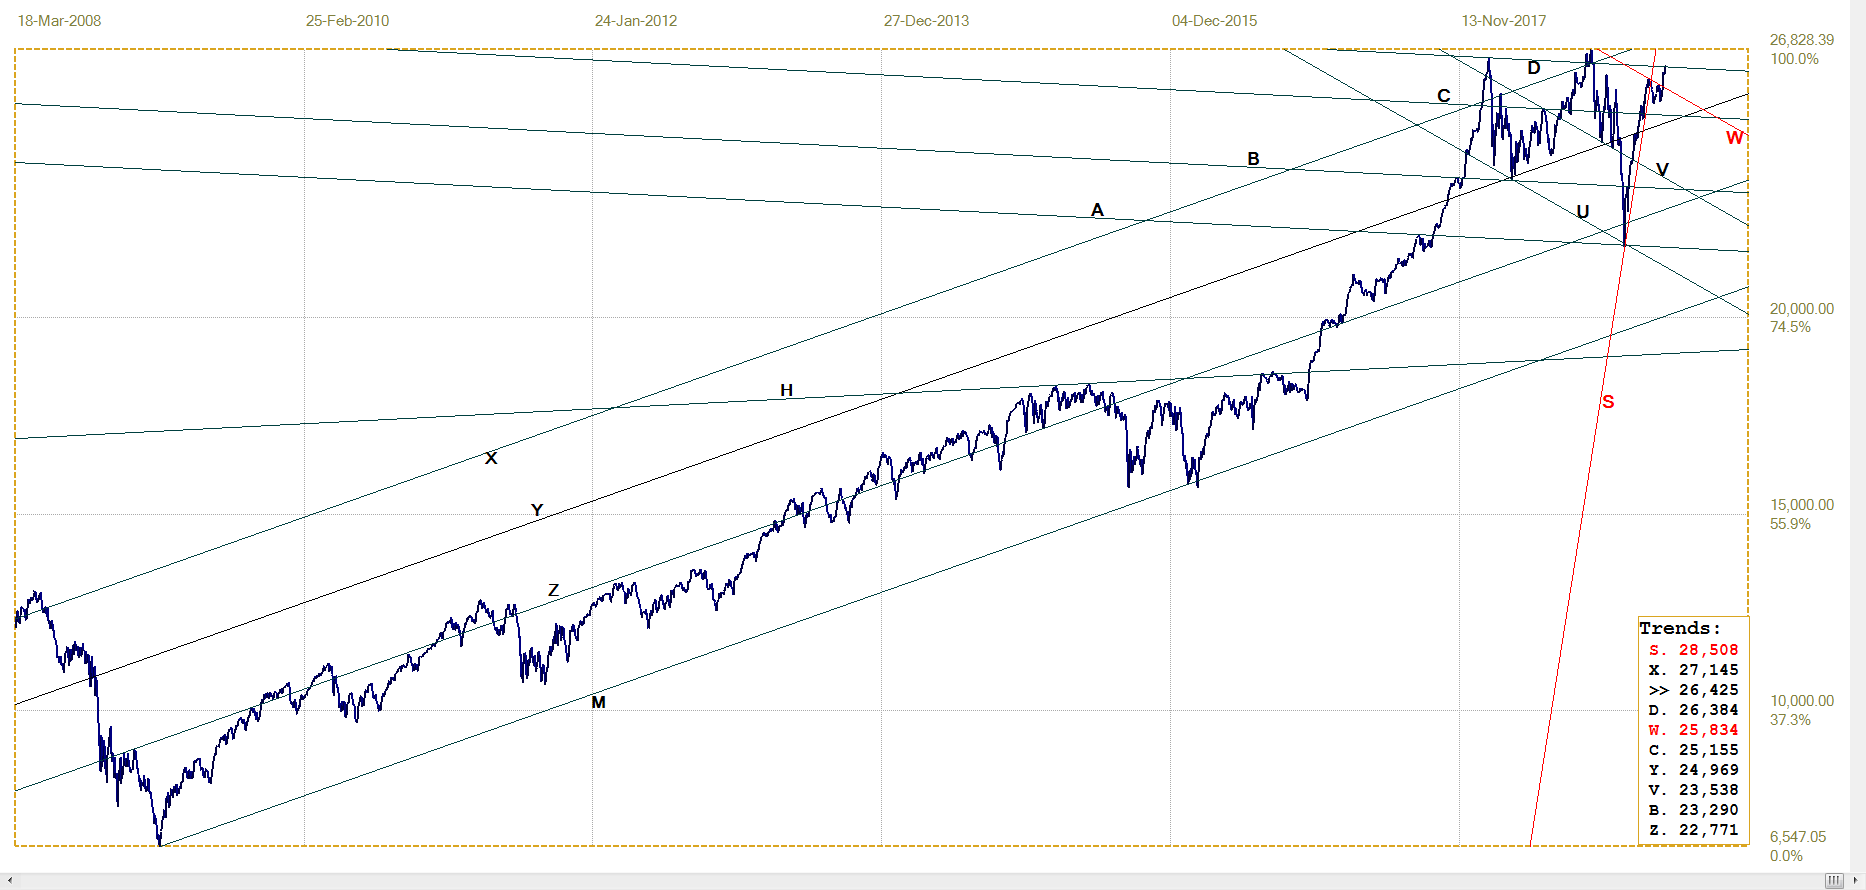
DJIA, last = 26424.99 (money.cnn.com)
Last week the DJIA broke above the bear channel UVW (25 834) where it had failed to break higher on a number of attempts. The break higher has broken marginally to above channel CD (26 384) and has to hold and extend to remain bullish – with line X (27 145) then as the next technical target. That would complete the move higher in the medium term bull channel XYM, with the potential to break above the channel for a third time. A reversal back below line D would introduce a bearish bias, which would have to be confirmed with a break back into channel VW.
Gold London PM fix – Dollars
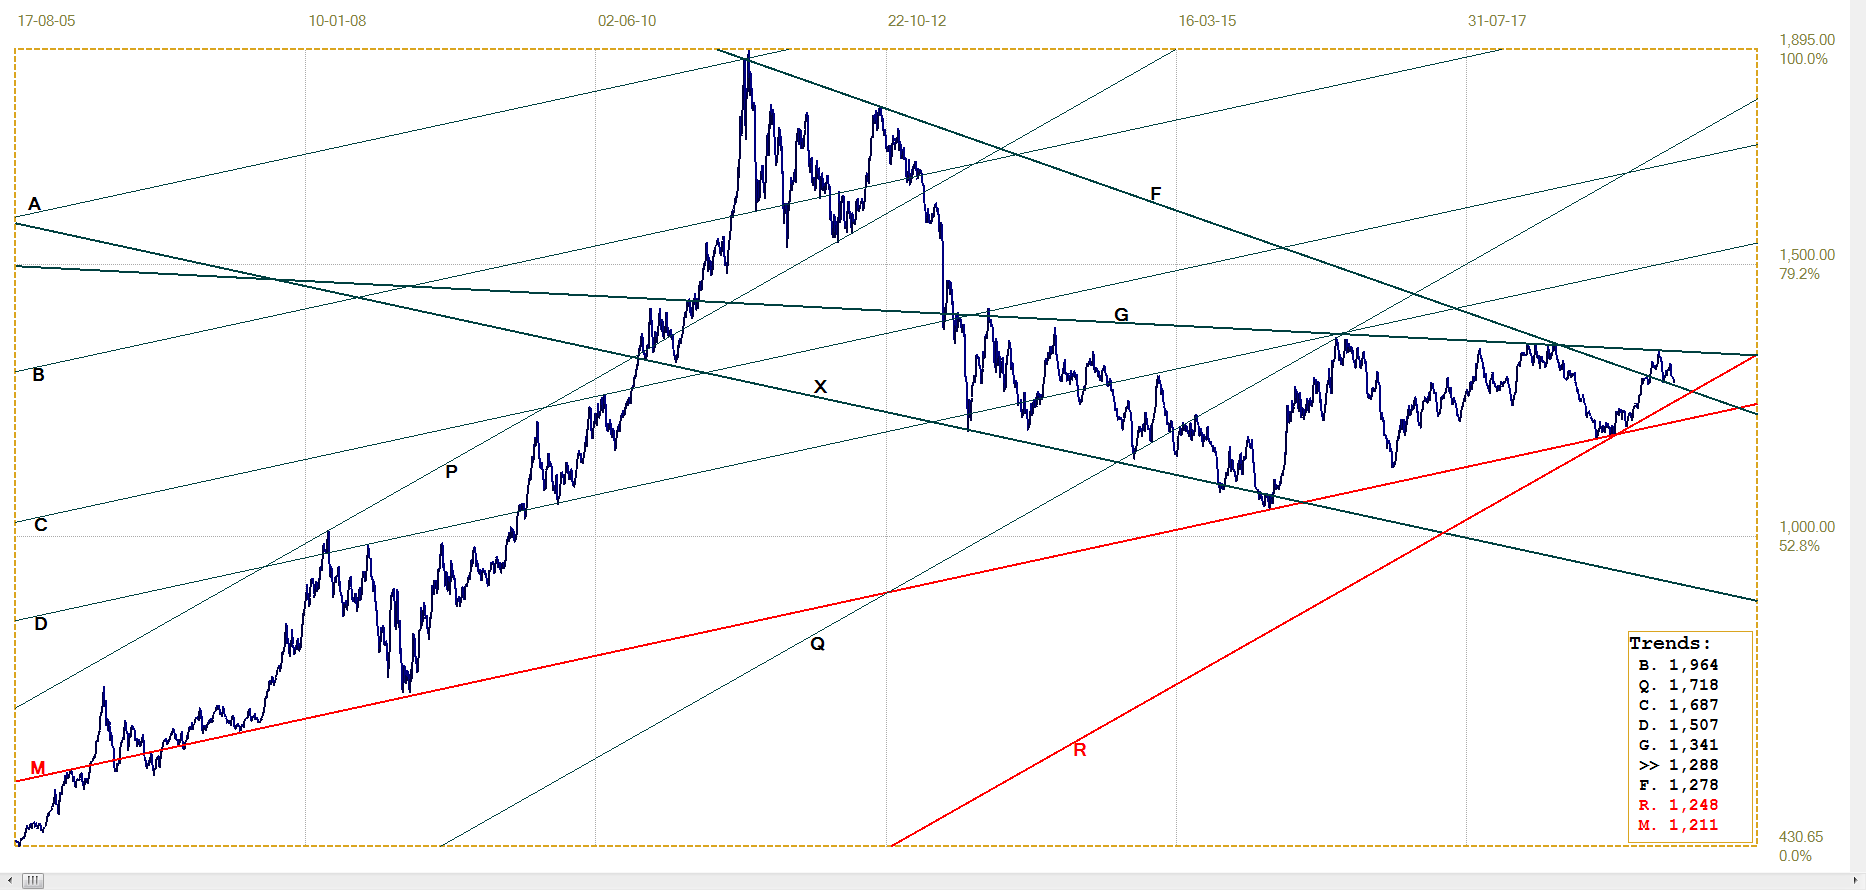
Gold price – London PM fix, last = $1288.45 (www.kitco.com )
A more complex analysis than in Chart 5 in the introduction and one that uses a different and longer term master gradient. The two triangles are FM and GM. Large triangle FM is about 13 years old and has completed normally, with a break higher above line F ($1278) at the end of the fifth leg. Line F is a steeper derivative of the master gradient M and the break higher should begin a significant rally.
So far, the top of bearish triangle GM has held the price in check, forcing it lower to what might become a goodbye kiss on line F if the rebound higher can break above line G ($1341). The price has to select between two possibilities: one is to break below line F and resume bearish leg 5 of triangle GM, later breaking below line M ($1211). The alternative is to resumes the rising trend after the goodbye kiss on line F, then to break prematurely above line G and extend the new bull market, with line D ($1507) as the likely target.
Euro–gold PM fix
Euro gold price – PM fix in Euro, last = €1148.01 (www.kitco.com)
The rally along line L (€1193) reached as high as line R (€1175) before reversing lower. Support at line Z (€1147) briefly failed to hold, but the rice soon recovered to hold just above line Z. The price now has to hold and extend to confirm the break above bear channel XYZ and then has to confirm at line R.
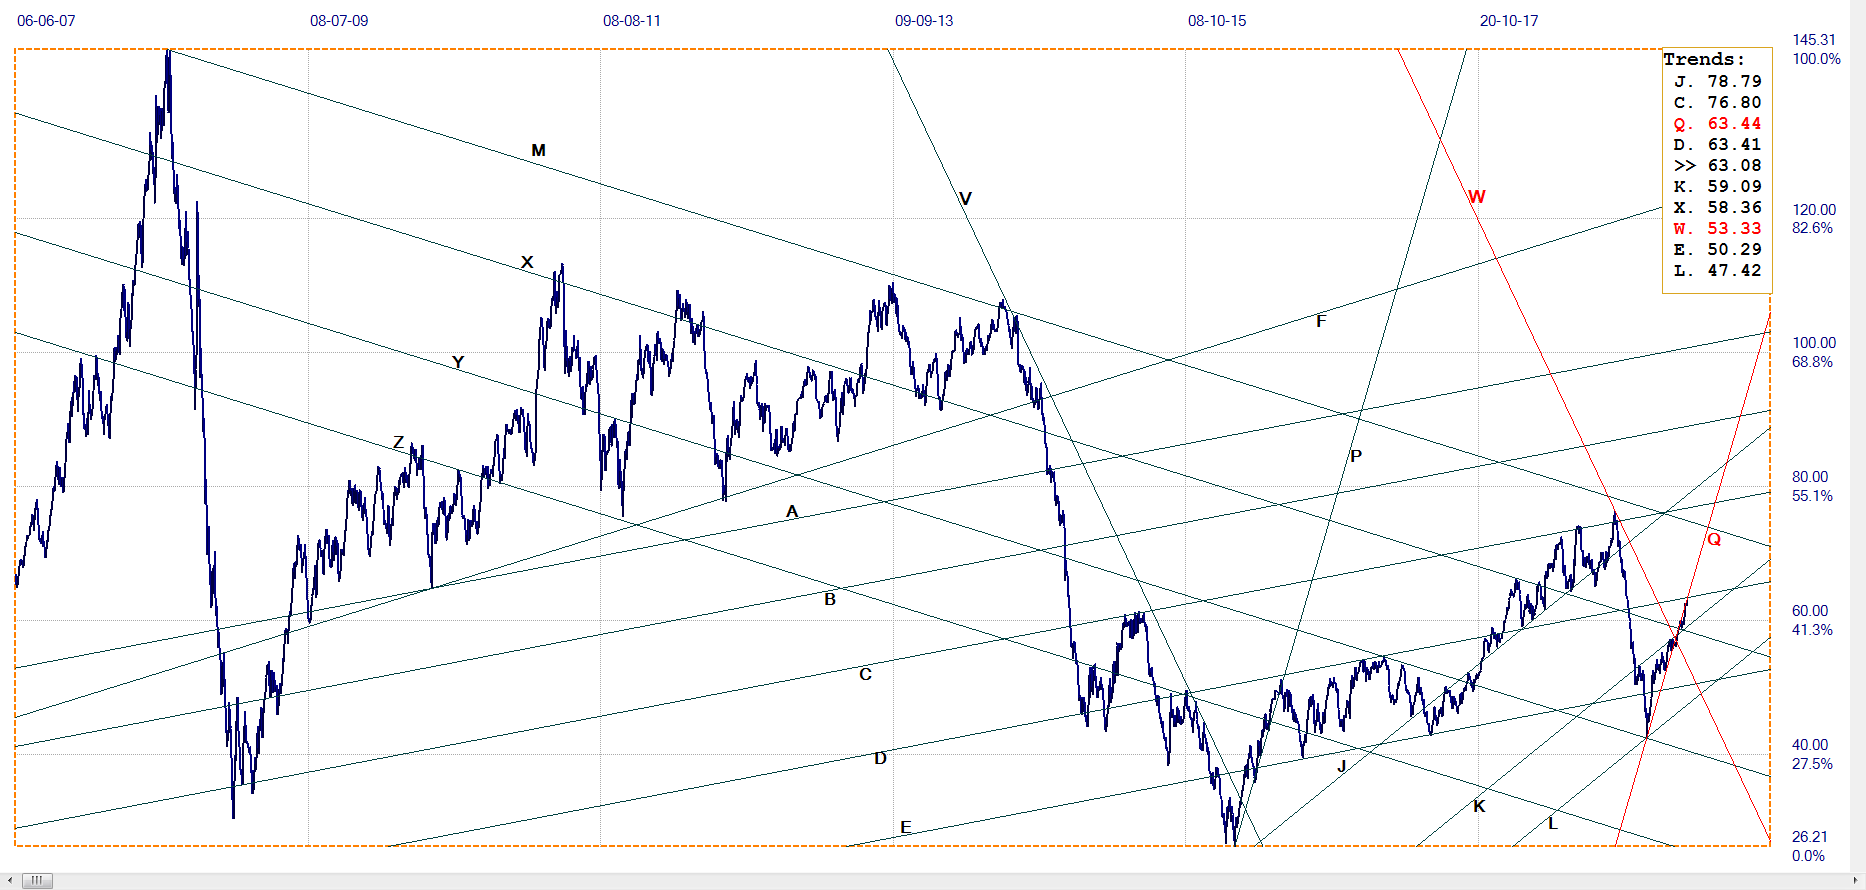
Silver Daily London Fix
The price of silver has already broken above steep term bear channel RS ($14.98) some time ago, but then failed to move higher and extend the break. The move lower broke below line E ($15.36) and then also briefly below line L ($15.18), but the marginal recovery above line L is not yet convincing. Neither is the break above line S which is also still marginal.
Triangle XD begins right off the low close to line D, which is not the usual. When it had completed leg 5, it reversed and also completed leg 6 before rising into leg 7 to break above the triangle – which break failed to hold and neither did the triangle. A triangle of 6 or 7 legs is more often, even if still rare, seen in currencies which, as is well known, are generally subject to manipulation. It has long been assumed that a longer than usual triangle or pennant indicates central bank intervention. That it has just happened to silver comes as no surprise. It now depends on whether bull channel KL can hold.
Silver daily London fix, last = $15.195 (www.kitco.com)
U.S. 10–year Treasury Note
U.S. 10–year Treasury note, last = 2.499% (www.investing.com )
The steep bond market rally JK (2.492%) then failed to hold the break below lines F (2.432%) and P (2.403%). The reversal higher mostly held in channel JK, but it is now testing line K, breaking a fraction higher. Previous breaks above line K have failed to hold and it remains to be seen whether the yield will return to the channel or whether a break will extend the new bear trend.
West Texas Intermediate crude. Daily close
WTI crude – Daily close, last = $63.08 (www.investing.com )
Still keeping mostly to the steeply rising trend along line Q ($63.44), now, just as the price approached resistance at line D ($63.41), just breaking marginally below that very steep line. While holding to line Q was bullish, a break sideways does not imply a new correction, that is, unless the resistance at line D holds to result in a new bearish trend. A break above line D is needed to confirm the bull trend.
––––––––––––––––––––––––––––––––––––––––––––––––––––––––––––––
©2019 daan joubert, Rights Reserved chartsym (at) gmail(dot)com
Copyright 1999 - 2019 Le Metropole Cafe. All rights reserved.
********


