Gold's Worst Week In 3 Months? Whoomp There It Is!


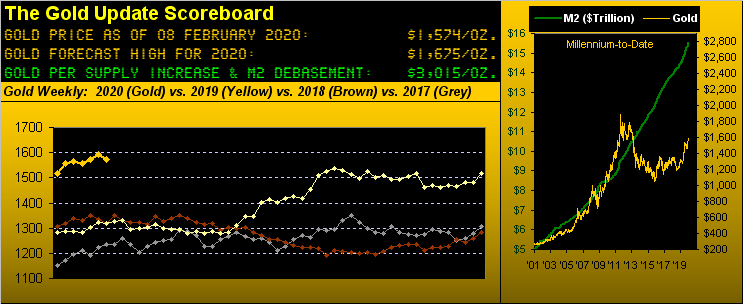
The price of Gold has been fairly firm these recent weeks, and rightly so given global goings-on. So it seems rather out-of-sorts to cite that Gold just put in its worst week of the last 13 (stretching all the back to that ending 08 November) in netting a -1.2% change by settling yesterday (Friday) at 1574. Which really is a testament to just how positive Gold has been of late: our sense of the week's price movement was its being basically ho-hum, rather than having amounted to the most negative net weekly loss in three full months ... "Whoomp! (There It Is)"Pardon our not having immediately picked up on that; instead, it took some key eying at the comparative closing nubs across Gold's weekly bars, followed for verification via worksheet calculation to ferret it all out. Indeed in looking below at said bars, hardly does the recent run look negative whatsoever:

Nonetheless, the oscillating global yo-yo of "Oh-no!" has produced some significant swings in Gold's price. Four weeks back, the US' precision strike in the Middle East brought on the "Oh-no we're going to war" fears and the price of Gold spiked from 1552 to 1613 only to return from whence it came in just 30 hours. Two weeks back, the deadly coronavirus proliferation from China brought on the "Oh-no we're going to die" fears and the price of Gold resurged to 1598 only to again settle back 'round today's present price. The upshot as made clear in the above chart is Gold's being in an price uptrend with still plenty of room for pullbacks without disturbing the ongoing upward glide of parabolic Long trend.
Indeed for the Gold trader, 'tis been two solid months of "buy the dip and enjoy the trip" ... were it only always this easy, eh? But as the late great Richard Russell would remind us, there's never a bad time to buy Gold ... to which we'd humbly edify unless price has well overshot debasement value, that as you no doubt noted in the opening Gold Scoreboard is now $3,015/oz., 92% above the current 1574 level; and we're looking (at least for this year) to merely 1675. Methodically modest may be our call.
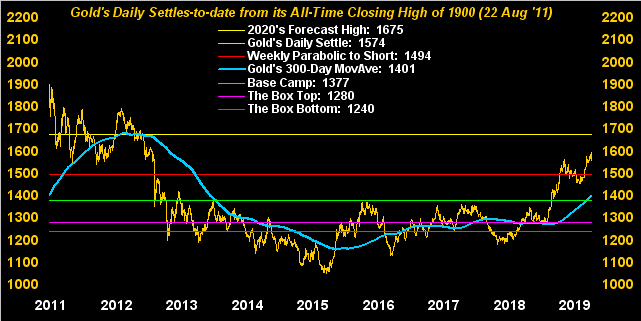
Moreover, from the "Nothing Is Easy Dept." there's always the "But, what if..." with which to deal. Even the most hardened Gold investor ought take note of price vis-à-vis its 300-day moving average, (the next graphic's bright blue line). At present, price (1574) is 12% above said average (1401); albeit more importantly the average itself is firmly rising. Still, on an absolute value basis (which for you WestPalmBeachers down there allows us to calculate distance of price from average regardless of their juxtaposition), the present 12% divergence is nearly double the millennium-to-date median. Just something of which to be wary. Wise as well per the website is to track distances from norms on both the Market Values and Market Magnets pages. Warnings notwithstanding, we like what we're watching:
Watching the economy has been a wonder to some, but it shows what can happen when a tax cut is done, and further, that another one is being Presidentially spun. What has been a wonder to us is: rather than the incredibly overvalued S&P 500 (red line) succumbing (as traditionally 'twould) to the level of the Economic Barometer (blue line), 'tis as if they've paired up on the ole tandem bicycle and are riding along in synchronized style. And the data doesn't lie: StateSide job creation is solid, and as a positive precursor, January's manufacturing Index from the Institute for Supply Management moved back above the key 50 level for the first time since July, indicative of expansion resuming following months of contraction. Here's the Baro:
Specific to the S&P 500, despite our "live" price/earnings ratio (by trailing 12-months earnings) being at 40.7x -- which means earnings have to double to get down to the "forward" P/E of 20x (and by Q4 Earnings Seasons they're nowhere near doubling, the median S&P 500 constituent's year-over-year bottom line being but +6.7% for the 299 companies having thus far reported) -- money is being thrown at this market. Out of China and into the US is helping. Per the website's Moneyflow page, the case is made that the S&P 500 (at present 3323) could well be some 200-300 points higher that 'tis! Regularly of late, folks ask us: "How much longer can this keep going?" Answer: as ridiculously overpriced (understatement) as the market is, the trend is your friend; just keep nudging up your underlying stops as well. "What are stops?" (There's another Gold-positive "Oh-no!").
Speaking of positive, only three of the eight BEGOS Markets are in 21-day linear regression uptrends, two of them (ironically to some observers) being Gold and the S&P 500, along with the Bond. Here we go 'round the horn for the entire bunch from one month ago-to-date. The baby blue dots denote the day-to-day consistency of the respective diagonal grey trendlines.
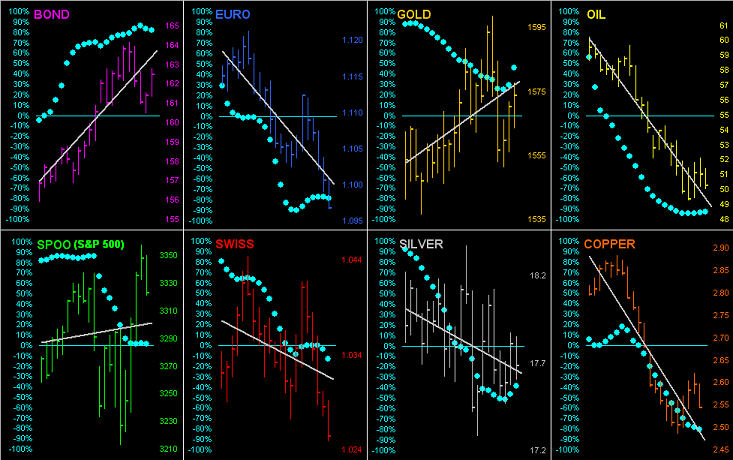
And specific to Gold, what else has been rising in practical parallel by trendline? The Dollar Index. "What?" Here are the percentage tracks of both the yellow metal and the buck also as measured from one month ago-to-date, their respective dashed trendlines nearly on top of one another. The state of their union warrants tearing up the treatise on their trading in opposition:
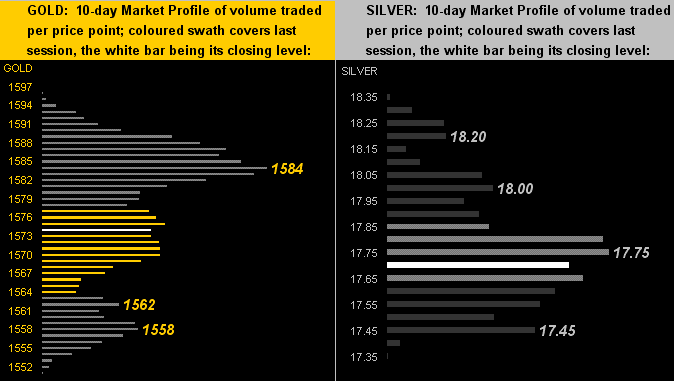
Finally, to the 10-day Market Profiles of the precious metals we go with that for Gold on the left and for Silver on the right. And compared to price positioning from a week ago, we find Gold's having dropped from top to center, and Silver's having slipped from center to nether. No wonder the Gold/Silver ratio at 89.0x remains 'round historical highs. Both markets' more dominantly-traded prices are as labeled:
The next parade of incoming economic data is significantly skewed into the new week's latter stages, Valentine's Day alone bringing in reports on Retail Sales, Ex/Im Pricing, Industrial Production/Capacity Utilization, Business Inventories -- and just in time for that romantic dinner cooing -- The University of Michigan's Sentiment Survey. Notwithstanding your honey, make Gold deserving of your money!
www.deMeadville.com
www.TheGoldUpdate.com
********

Mark Mead Baillie has had an extensive business career beginning in banking and financial services for two years with Banque Nationale de Paris to corporate research for three years at Barclays Bank and then for six years as an analyst and corporate lender with Société Générale.
For the last 22 years he has expanded his financial expertise by creating his own financial services company, de Meadville International, which comprehensively follows his BEGOS complex of markets (Bond/Euro/Gold/Oil/S&P) and the trading of the futures therein. He is recognized within the financial community of demonstrating creative technical skills that surpass industry standards toward making highly informed market assessments and his work is featured in Merrill Lynch Wealth Management client presentations. He has adapted such skills into becoming the popular author each week of the prolific “The Gold Update” and is known in the financial website community as “mmb” and “deMeadville”.
Mr. Baillie holds a BS in Business from the University of Southern California and an MBA in Finance from Golden Gate University.


