Gold/Silver Ratio Tops 80x - What Happens Next...


Throughout this millennium, the rare instance of the Gold/Silver ratio topping 80x has always bode well for the white metal. We'll show you.
But first, this short (pun!), swift statement on the stock market: at last Sunday's Investors Roundtable, in suggesting that the S&P 500 had just put in its high for the year and then querying if anyone else might agree, "No no no!" they laughed. We'll see if they show up tomorrow, (albeit one participant admitted as being "engendered with a sense of doom").
Now: for just the fourth time (give or take some immaterial flutter) since 2001, the ratio of gold's price to that for Silver has just crossed above 80x. Gold settled out the week yesterday (Friday) at 1335.2 and Silver at 16.555. That puts the ratio at 80.7x. Here's its chart, noting in red the three prior eclipses of the 80x level, and now the fourth:

What happens next? Here's the history of the three prior occurrences looking forward six months in each case:
■ 1st - 02 June 2003: Silver settles at 4.540; within six months it settles at 5.485 (+20.8%)
■ 2nd - 17 September 2008: Silver settles at 10.52; within six months it settles at 14.420 (+37.1%)
■ 3rd - 23 February 2016: Silver settles at 15.300; within six months it settles at 20.665 (+35.1%)
"But how did gold do during those same periods, mmb?"
Squire poses the perfect question. Here's the answer: from those three exact dates, gold settled higher within six months respectively by as much as: +10.3%, +18.3%, +11.8%. The defense rests.
'Course, from the "Past Performance Does Not Guarantee Future Results Dept.", one has to only look at the stock market. Earnings (or lack thereof) suggest it ought have crashed nearly three years ago, yet 'tis only just starting now. But specific to the Gold/Silver ratio, should the white metal again score increases of 20%-40% within the ensuing six months, the leverage that infuses into mining company stock prices ought see them turn white hot.
As for the stock market in general, in having a week ago cited its vertical "Blow-Off Top", an astute investing friend of ours then suggested the S&P 500 as literally poised to keel over backward as we see per the red curve here in this 30-year-to-date view, (the actual "damage" of this past week being so comparably infinitesimal that you can barely see it):
So all that's just for openers. It now being month-end (plus two trading days) here are the young year-to-date standings of the BEGOS Markets. Note that the S&P is still actually up ... at least for the moment. 'Course, the key component in the stack is the last-place Bond, the longer-end of the interest rate curve on the ascent. The yield on the 10-year U.S. Treasury Note closed out 2017 at 2.405%: 'tis presently 2.854% ... and you'll receive the Note's par value in return at maturity. The yield on the S&P is presently 1.823% ... and you've no idea what you'll actually get back once you capitulate. (Yeah, we're feelin' a bit bearish out there). Here are the standings:
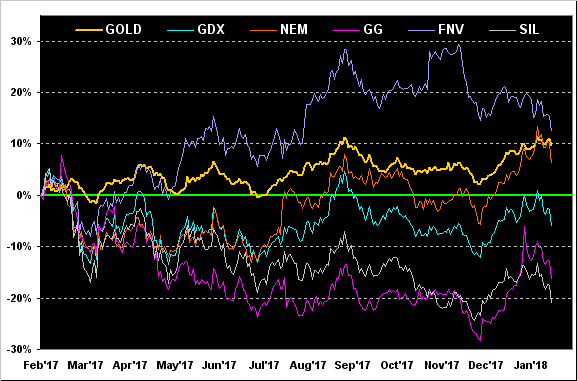
On to gold's daily percentage track from one year ago-to-date coupled with those of these precious metals equities: Franco-Nevada (FNV) +12%, gold itself +10%, Newmont Mining (NEM) +6%, the VanEck Vectors Gold Miners exchange-traded fund (GDX) -6%, Goldcorp (GG) -16%, and the Global X Silver Miners exchange-traded fund (SIL) -21%. Did we mention the Gold/Silver ratio is +80x? I believe we did:
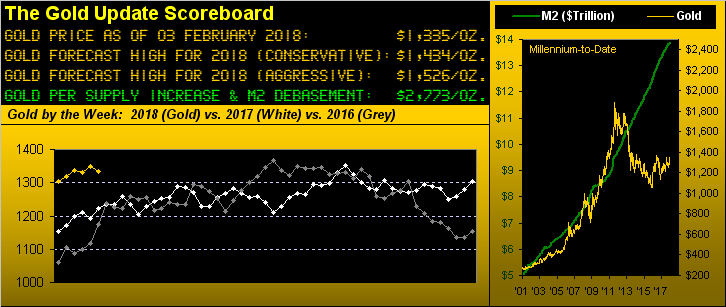
Specific to gold itself, here are its weekly bars from a year ago-to-date. Quite dubious we were a week back about gold being able to score a seventh consecutive "higher-high", which indeed did not materialize. Blame it part on the Dollar Index firming just above the critical support we showed a week ago 'round the 88.150 area, going on to settle yesterday at 89.045. More importantly, upon gold's having already taken out 2017's high (1362) on 25 January, every precious metal eye in the world sees price having neared the vaunted Base Camp 1377 level, in turn bringing the clarion call to be careful. Rather, we view it as the rallying cry to get ready! Our "conservative" forecast high of 1434 ain't sittin' up there in the scoreboard fer nuthin'! 'Specially should the parabolic Long trend (rising blue dots in this chart) just be gettin' started:
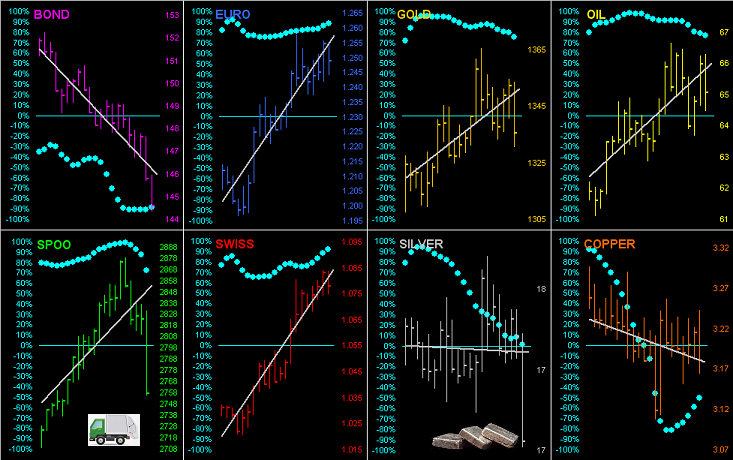
Speaking of dots and given the increasing volatility (per a gander at our Market Ranges page) across the BEGOS Markets, here for all eight of them are the daily bars of the past 21 trading days, their respective grey trendlines, and their "Baby Blues" depicting the day-by-day consistency of those trends. Might someone please notify Sister Silver to stop imitating the stock market? After all, she's a hard asset, not a wastebasket:
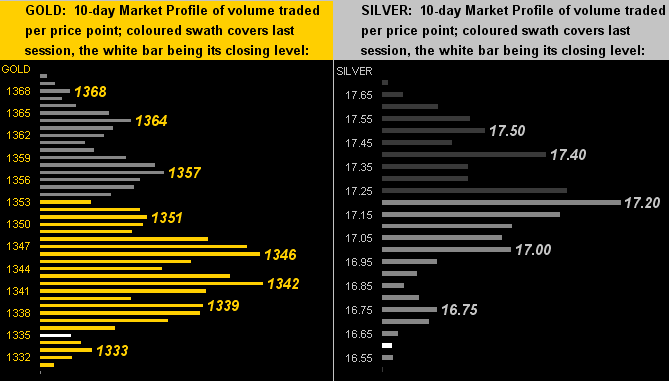
As to the near-term trading view for the precious metals, here next are their 10-day Market Profiles. For gold on the left, price has traveled deep into its Profile lows, yet has stayed above the low from two weeks ago. But in the case for Silver on the right, we've an "Oh-no...", price having taken out the prior four weeks' lows:
And no, we've not forgotten the Econ Baro, for which we've quite the view below, the S&P 500 commencing a correction due both years and thousands of earnings reports ago. Still, the Economic Barometer put in a pretty robust week, highlighted by gains from December's Factory Orders and January's Non-Farm Payrolls ... albeit Hourly Earnings growth did not accelerate and the Average Workweek actually shortened. However, fueling the inflation front came an increase not just in December's Personal Income, but also in that month's PCE (Personal Consumption Expenditure) Price Index. Here's the Baro:
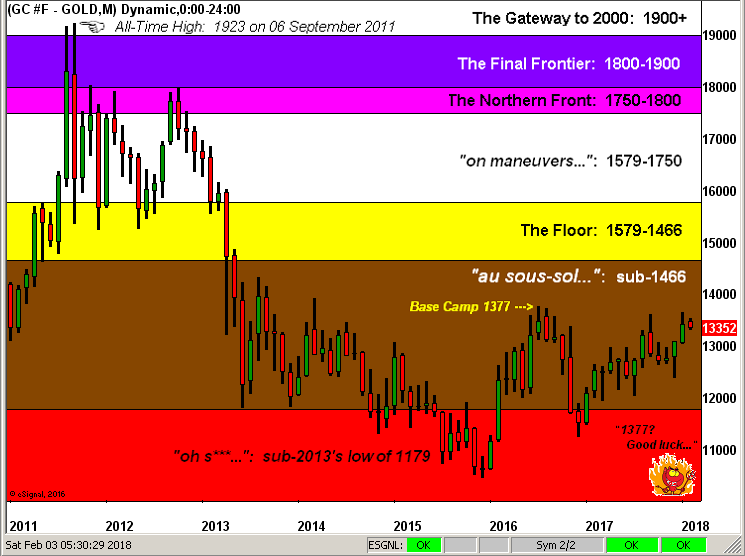
So with another month in books, plus two February trading days (the rightmost red nub), we wrap it up with our Gold Structure as charted by the month since price's All-Time High of 1923 (06 September 2011), all those lovely upside defined layers waiting in the wings. And again we can't say it enough: the doors really open wide once gold takes out Base Camp 1377 in stride:
To close, 'twould not appear we've one's garden-variety ride 'round February's financial circuit this year. So pull firmly down on that shoulder harness, make sure your helmet and attendant "HANS device" are firmly set in place, give due deference to managing the tyres, and hopefully you'll bring it home lookin' Golden!

Mark Mead Baillie has had an extensive business career beginning in banking and financial services for two years with Banque Nationale de Paris to corporate research for three years at Barclays Bank and then for six years as an analyst and corporate lender with Société Générale.
For the last 22 years he has expanded his financial expertise by creating his own financial services company, de Meadville International, which comprehensively follows his BEGOS complex of markets (Bond/Euro/Gold/Oil/S&P) and the trading of the futures therein. He is recognized within the financial community of demonstrating creative technical skills that surpass industry standards toward making highly informed market assessments and his work is featured in Merrill Lynch Wealth Management client presentations. He has adapted such skills into becoming the popular author each week of the prolific “The Gold Update” and is known in the financial website community as “mmb” and “deMeadville”.
Mr. Baillie holds a BS in Business from the University of Southern California and an MBA in Finance from Golden Gate University.
More from Gold-Eagle


