Here Comes The Stagflation; (Got Gold?)


Just in case you've forgotten (or weren't around yet), the mid-1970s were marred by stagflation, the cost of living in rampant rise whilst the economy suffered demise. Specific to the three-year run from 1973 (and its intolerable lines for gasoline) through 1975, the annual Consumer Price Index came in respectively at 6%, 11%, and 9%, (kinda akin to this past year). The price of Gold settled 1972 at 58; come 1975, it settled at 141: that's a three-year net increase of +143%. Got Gold?
Then came President Peanut, (with a resurgence of petrol queues), and by 1980 Gold in a hyper-spike traded up to 873, (before unraveling to 300 by 1982 as President Gipper and the Economic Recovery Tax Act stimulatively kicked into gear).
Fast forward to today and we ask what's next? In this time of investors and sovereigns being disinterestedly impervious to any and all Gold stimuli, who knows? To the hardened analyst, everything that used to work no longer does, as algorithms -- bereft of all that is fundamental and even at times technical -- are running the show. But common sense -- as is its historical wont -- shall return along with positive interest rates (savings accounts), acknowledgment of non-supportive earnings (S&P "dip"), and recognition of real value (Gold and Silver).
Indeed, the FinMedia Word of the Week was: "7% inflation for 2021!" they shrieked. "Fastest pace since 1982!" they screeched. "It is far different this time!", they preached.
Sheesh. 'Course, statistical selectivity set up the staggering story. Obviously the "7%" came from simply summing 2021's 12 individual monthly top-line CPI increases. What if, instead, we summed 36 months: that gives us "10.5%", a total less than the "11.3%" into the summer of 2008. Takes some of the edge off that four-decade drama, doesn't it? After which what happened? The S&P "dipped" -48.8% over the ensuing six months, (or if measured from October 2007's high, -57.7%), as the shearing of Lehman et alia came to pass, (following which the price of Gold rose +108% into 2011).
But let's get to the point of the present, for 'tis the unmentionable that wrecks the whole story:
■ This past October's CPI pace was +0.9%;
■ It then slowed a pip to November's pace of +0.8%;
■ And now in turn for December it cooled to +0.5%.
In other words, the pace of CPI inflation growth is actually slowing!
"But you can't make a trend out of just three months, mmb..."
Watch us, Squire. Linearly trendline those three months and come March 2022's CPI pace 'twould actually be DEflationary! But to your point, we are not predicting that. Inflation is all around us.
Still, did you notice that December's wholesale Producer Price Index (PPI) pace -- which logically leads the CPI -- was just +0.2%?
Either way, be it inflation -- or more likely stagflation -- with a doubling of the Federal Reserve's overnight lending rate in the balance, we recall: "Double double toil and trouble. Fire burn and cauldron bubble." --[W.S., 1623]. Move Macbeth to modern-day and with the muted real increase in earnings we've Acte I of "Has the S&P Crashed Yet?"
"Muted, mmb?"
Clearly so, Squire. The "live" price/earnings ratio of the S&P 500 is now 47.7x. Its lifetime median is 20.4x, (and the average is 22.1x). To align with that as has always historically happened, if the ever-stubborn "P" refuses to go down, then the lackluster "E" needs to go up: indeed more than double!
Is it happening? No. With Q4 Earnings Season underway, five major Banks reported yesterday (Friday). Their average earnings increase over a year ago? +11%. That's it. Zip, Zero, Nada. Even as the FinTimes reported on Wednesday that "US companies tipped for strong earnings season..." (Do call their editor and inform them of what "strong" need be, i.e. over well over +100%).
But wait, there's more (or better stagflatingly-stated, less). We'll get to Gold's perpetually sleepy analytics in a sec, but first if perchance you haven't already looked at the website, here is the Economic Barometer. Not so great for President Ohno:

That rightmost drop is the vastest five-day oscillative plunge in the Econ Baro since March of last year, and moreover (should you be scoring at home) it ties for second worst in the past six years. Amongst the low-lights of the week's incoming metrics, Retail Sales actually shrank via their second-worst December in the 24-year history of the Baro. "What happened to Christmas?" The month's Industrial Production shrank as well. "I can't get the proper equipment!" --[Algernon, "Help!", '65].
Then from the Fed came nothing but calls for an urgent end to stimulus, with rate rises in the balance. (Still nursing that variably-priced debt? Get ready). From Chair Powell himself to Fed officials Barkin, Bostic, Mester, Brainard and Evans (after whom we stopped counting): flocking together are those birds of a feather. And again we opine: why are they waiting for 16 March when they "ought" just pull the trigger a week Wednesday, 26 January?
'Course the Fed could fool us and raise rates inter-meeting, à la Paul Volcker's 06 October 1979 "Saturday Night Massacre", following which the S&P fell a full -10% in just 15 trading days; (if you're still scoring, that in today's "Dow" terms would be a 3,600-point drop).
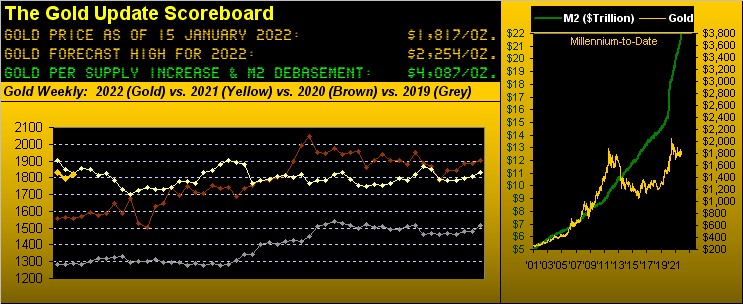
Further for the record, Gold settled that prior day (05 October 1979) at 393, from which it lurched +122% to the aforementioned 873 come 21 January 1980, (i.e. in less than four months). Again we query: "Got Gold?". Repeat same today and from 1817 we'd see 4034, practically smack-on today's opening Gold Scoreboard "valuation" level of 4087! Not so far-fetched after all, is it? No 'tisn't.
However, then there's "The Now", indeed the "Sleepy Now". A week ago we made a fairly iron-clad technical case for Gold to fall near-term some "62 points, suggestive of 1735". 'Twas based on Gold's daily MACD ("moving average convergence divergence") having approximated such drop on the prior 12 like negative crossings. But as stated above: "...everything that used to work no longer does..." So rather than drop, Gold netted a sleepy up week as we next see per the rightmost weekly bar:
Puts us in mind of George Kennedy's observation of the north face climbers in "The Eiger Sanction" (1975): "...they won't be able to come down... they won't be able to go up... they'll be stuck..." That's Gold these days.
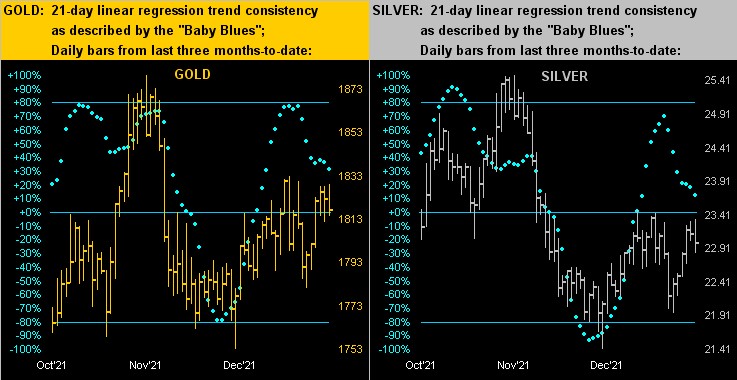
Next, we break it down into the last three months of daily bars for Gold on the left and Silver on the right. Whilst both precious metals are for the moment in linear regression uptrends, the declining "Baby Blues" depict such respective trends as weakening:
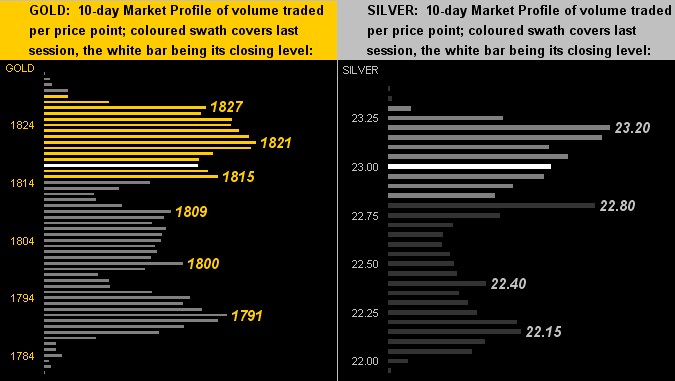
Then we've the 10-day Market Profiles for Gold (at left) and Silver (at right). If you get out your Funkin' Wagnalls and look up the definition of "hodgepodge", you'll see these two charts:
And for what 'tis worth in a stagnant market -- albeit with stagflation lurking in the balance -- here's The Gold Stack:
The Gold Stack
Gold's Value per Dollar Debasement, (from our opening "Scoreboard"): 4087
Gold’s All-Time Intra-Day High: 2089 (07 August 2020)
Gold’s All-Time Closing High: 2075 (06 August 2020)
The Gateway to 2000: 1900+
2022's High: 1833 (06 January)
Trading Resistance: 1821
Gold Currently: 1817, (expected daily trading range ["EDTR"]: 19 points)
Trading Support: 1815 / 1809 / 1800 / 1791
The 300-Day Moving Average: 1807 and falling
The Final Frontier: 1800-1900
The Northern Front: 1800-1750
10-Session “volume-weighted” average price magnet: 1783
10-Session directional range: down to 1781 (from 1833) = -52 points or -2.8%
2021's Low: 1781 (08 March)
The Weekly Parabolic Price to flip Short: 1768
On Maneuvers: 1750-1579
The Floor: 1579-1466
Le Sous-sol: Sub-1466
The Support Shelf: 1454-1434
Base Camp: 1377
The 1360s Double-Top: 1369 in Apr '18 preceded by 1362 in Sep '17
Neverland: The Whiny 1290s
The Box: 1280-1240
Finally: we bid a fond farewell to LIBOR. During our three-year stint with Barclays back in the 80s, 'twas really cool to talk LIBOR. It was like being "in the know", a real cocktail party attention-getting dazzler versus boring old "Prime": "We're international, baby. The Big Time!" And now 'tis gone. But today with stagflation in the offing, we primed to see Gold become The Big Time!
www.deMeadville.com
www.TheGoldUpdate.com
*******

Mark Mead Baillie has had an extensive business career beginning in banking and financial services for two years with Banque Nationale de Paris to corporate research for three years at Barclays Bank and then for six years as an analyst and corporate lender with Société Générale.
For the last 22 years he has expanded his financial expertise by creating his own financial services company, de Meadville International, which comprehensively follows his BEGOS complex of markets (Bond/Euro/Gold/Oil/S&P) and the trading of the futures therein. He is recognized within the financial community of demonstrating creative technical skills that surpass industry standards toward making highly informed market assessments and his work is featured in Merrill Lynch Wealth Management client presentations. He has adapted such skills into becoming the popular author each week of the prolific “The Gold Update” and is known in the financial website community as “mmb” and “deMeadville”.
Mr. Baillie holds a BS in Business from the University of Southern California and an MBA in Finance from Golden Gate University.


