A Hint Of A Flame!


Last week started with the gold PM fix holding above the $1080 level that was seen as key long term support. The great concern was about what would happen on last Friday – the infamous monthly NFP report on Non-Farm Payrolls. This report, which is said to the most watched economic data of all, has become a regular Nemesis for the community of gold bugs. In their minds, a ‘good’ NFP report was one that saw gold fall on that day by less than $10, even though that view seems more historical than recent. What a pleasant surprise to find Friday’s PM fix almost $4 up on what it was on the Thursday. Granted, the NFP figure was a little disappointing, but there was a time when even a bad NFP figure was a death blow to gold. The silver fix is in the morning in London, well before the NFP is released; the fix at $14.75 was up on earlier fixes, and it got slaughtered down to $14.60 later, but silver then recovered to record a high above $15.00 – before the usual softer close.
Still nothing to get excited about, but a slow and steady start is much better than a spike higher that cannot be sustained. While gold bugs are keen to see gold assume its rightful place among investments, those investors who have been riding the tall wave on Wall Street – some of them with maximum margin loans they can afford – cannot be happy. For months now, if not years, waves on Wall Street have become choppy, sudden sharp declines that hardly happen before the trend reverses again to seek new highs. But it now seems the wind that was driving the stock market to these consecutive new highs is losing force. To carry the analogy a little further, it seems the tide is now going out of that market.
With a slightly adjusted analysis to fit channel ratios better, silver held right at its support and is starting to improve again. The metal has been more buoyant, if also more volatile, than gold. My suspicion that silver is the greater problem than gold in the control of the precious metals – and has been so for more than a year remains unchanged. Perhaps if the support holds for both metals and prices begin and hold to a bullish trend, the reason for this difference in behaviour will be revealed.
The price of WTI crude is an a new downtrend and approaching significant support at $44.59. The last official price is $45.25, for 3rd August, but it was reported at a low of $43.77 on Friday. That is below the key support, but has to be confirmed. If the price holds near these low levels – or decline even further? – the outlook for a majority of the shale oil operators face a difficult future. Most have very large loans for operating capital outstanding and are unable to service these adequately given a price below breakeven. That would mean trouble for the banks that extended the loans as well – and could become a major problem in the months ahead.
October is creeping closer and investors who work on seasons and cycles would not be too comfortable with that fact. October as a time of real stormy weather for Wall Street is however so well established in the US psyche that very few Americans who follow stock prices will not be worried at all as October approaches.
Euro-Dollar Chart
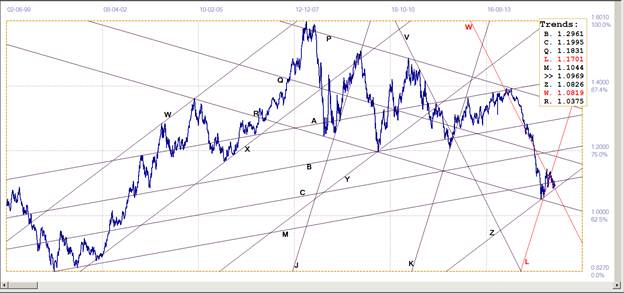
Euro-dollar, last = $1.0969 (www.investing.com)
The euro held resolutely above support in long term bull channel, XYZ ($1.0826). However, under influence of Greece inspired fears, the euro currency failed to hold to the new and steep bull channel, KL ($1.1701) and tried hard to break back into the steep bear channel VW ($1.0819). Brief successes failed to hold and the euro is now again above the resistance of line W.
The situation is however still fragile; the euro requires a break above resistance at line M to put in a claim for a resumption of its earlier bull trend. The gradual slope of bull channel YZ does not hold promise of a steep trend – unless the dollar suffers badly from a possible decline on Wall Street.
Dow Jones Industrial Average (DJIA)
A new analysis of the DJIA brings some interesting features to light, which will be a topic for a new essay on market manipulation. Briefly, it has been frequently noted in these reports that whenever there happened to be a spike lower on Wall Street, it did not last long before the stock market found a new life to surge to fresh highs. In the process, the DJIA established consecutive rising wedges – reversal patterns that signalled a bear trend when penetrated to the downside – only to break higher again and develop a new rising wedge. Those interested can examine the patterns KX, KY and KF; all are rising wedges the broke lower to give a bearish signal, only to have the DJIA resuming the bull trend.
The break below steep bull channel XYZ (18024) also at first failed to hold, but the DJIA has now broken marginally below line B (17474) to look more bearish; a break that should be confirmed with a break lower at line P (17243) to add confidence in the new trend.
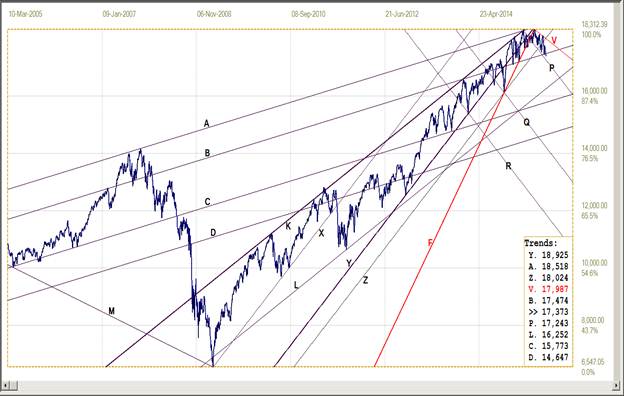
Dow Jones Industrial Index, last = 17373 (money.cnn.com)
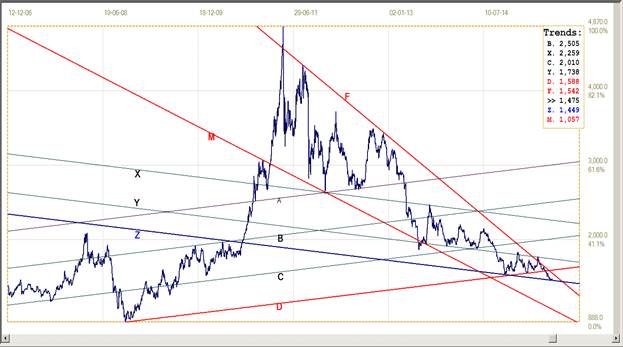
Gold PM fix - Dollars
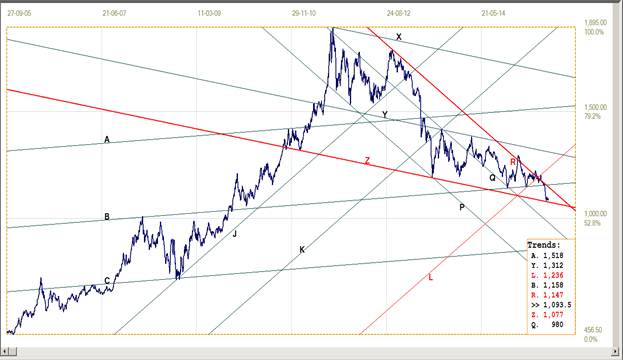
Gold price – London PM fix, last = $1093.50 (www.kitco.com)
While there gold can still move sideways and lower in the pennant RZ (R: 1147, Z: 1077), the fact that gold has already completed leg 4 within that pattern and is now holding above line Z, is reason for optimism. Now a recovery back above the major support along line B ($1158) that has held firm on two recent occasions, first would require a clean break above pennant RZ. This, with leg 5 of the pennant then also having been completed, would give a long term bull signal.
Line Z is still key support so that, while line Z holds, bullish expectations remain in force. There is ample room to move sideways, probably well into October!
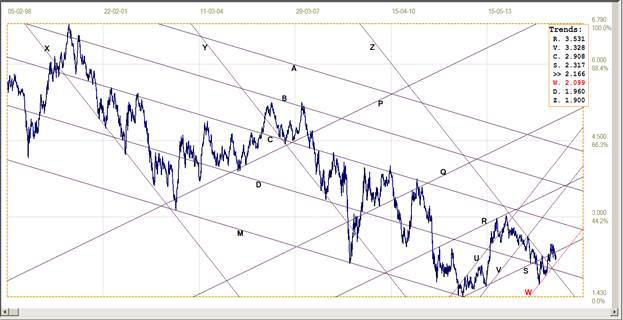
Gold PM fix - Euro
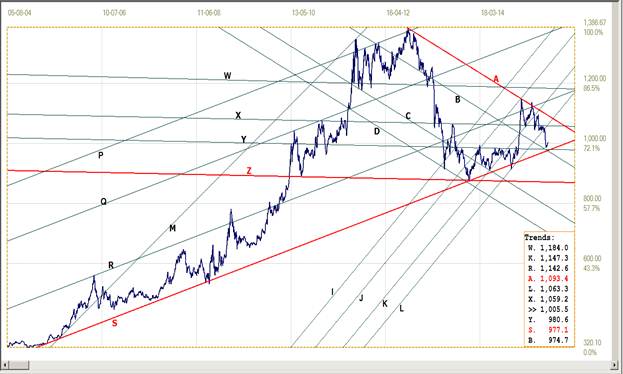
Euro gold price – PM fix in Euro, last = €1005.5 (www.kitco.com)
The euro price of gold moved sharply lower when it broke below the stranglehold of the tightly range bound sideways trend just below line X (€1059) – to decline clear below bull channel KL (€1063) in one fell swoop. The decline ended above support at line Y (€980.6) and held steady there, just off the bottom of the large triangle AS (€975.9).
This still leaves leg 4 of that large triangle incomplete. Now that the price is ticking higher, this becomes a real possibility. Nevertheless, a strong surge in the value of the euro without a corresponding improvement in the price of gold could still have leg 4 completing. If normal development of the triangle should continue, without a break below line S, the new bull market is now effectively in place.
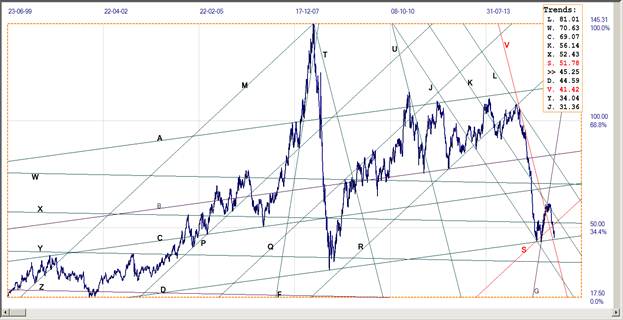
Silver Daily Fix Chart
Channel XYZ has been slightly adjusted to improve the channel ratio – a feature of channels that assist in the proper location of the trend lines. The picture for silver now bears close resemblance to the dollar price of gold as the price has completed leg 4 by touching the lower boundary of the chart formation. The chart shows three major narrowing formations, which are, with their support: a pennant FM ($10.57), the pennant FZ ($14.49) and the triangle FD ($15.88). Leg 4 in pennant FM has a long way to go, while in triangle FZ that leg has completed and the price is holding steady above the support.
A break above the top of pennant FZ will complete leg 5 and it should resume the long term bull market. Getting closer, but still requiring a break above significant recent resistance at the $15.00 level. And then also needing a break above line D ($15.88) for confirmation.
Silver daily fix, last = $14.75 (www.kitco.com)
U.S. 10-year Treasury Note
The yield on the 10-year Treasury note is still in its volatile, mostly sideways trend, reaching down to a recent low at 2.166% this past Friday. This resulted in a fresh recent low, closer to the bottom of steep bear channel VW (2.099%). Similar to the 18000 level that seems to be of strategic importance for the DJIA, a bearish trend in the yield on the US 10-year Treasury note appears to be capped near 2.40%. At the 2.0% level, on the other hand, a bullish trend seems to attract such an increase in supply that the yield is pushed higher again. This implies a mainly sideways and range bound trend for the US 10-year Treasury note – at least until either the bulls or the bears take final control of the market, the odds favouring the bears.
U.S. 10-year Treasury note, last = 2.166% (www.investing.com)
West Texas Intermediate crude. Daily close
The latest official EIA price is for 3 August. The steep bear trend is still in place and the question is whether support at line D ($44.59) can hold again. Early evidence is that the price will break even lower, with line Y ($34.04) then a possible target.
West Texas Intermediate – Daily close, last = $45.25 (3 August)
©2015 daan joubert, Rights Reserved chartsym (at) gmail(dot)com
More from Gold-Eagle


