How Long Before the US Situation Becomes Untenable?
 share
share
 share
share
 share
share
 share
share
 share
share
The NFP on Friday came in as a shocker; while economists anticipated 728 000 new jobs, only 235 000 were created. A miss by 67.1% in such an important statistic really is no joke. Two possible explanations for this major error could both claim to be true. Either of them point to a major crisis ahead for the USA. If both happen to be true, the magnitude of the crisis to come escalates to the disaster level. One symptom of the path of self-destruction on which the US appears to have embarked is persistence in maintaining Covid-19 policies in the face of mounting contrary evidence.
The opening quote of Friday’s Midas bears repeating, because it is eminently relevant to the discussion below: "Facts are stubborn things; and whatever may be our wishes, our inclination, or the dictates of our passions, they cannot alter the state of facts and evidence. (John Adams)
The reasons why the estimate of the NFP was way out by 67% can be that economists are stupidly optimistic about the economic recovery, or the statistics they use for their estimates are faked. It seems that both of these are true. The measure that serves to best describe the progress of the US down the path of self-destruction on which it embarked more than two decades ago, is the ‘progress’ that the US has made to curb the effects of the Covid pandemic. The facts on this speak clearly and loudly!
Covid statistics have the total number of US cases at 40 703 374 on September 3 – 18.4% of the global total of 220 616 345, despite being less than 5% of the global population. No economic measure states as clearly that the US is in a terrible position because it has no effective counter to the pandemic, while the facts show others have done so with great success. Yet the US persists with an ineffective strategy that allows the situation to worsen whenever a new wave of infection builds – as it is doing at the moment and has since early in July.
The longer the pandemic dominates life in the US, with a nominal fourth wave still in progress, the greater the cumulative damage to the US economy and its psyche will become. This is happening to the US at the worst time during the past 3 decades, with China ready to challenge the US for the dominant position in global affairs the US has occupied since WWII.
One would have expected US leadership to have searched out all avenues to reduce the effect of the pandemic right from the beginning. This was not done. Granted, there was a learning curve to climb, but this consisted largely of hit and miss copies of what China had been doing and secondly, putting blind faith in the ability of Big Pharma to produce a vaccine. Then, in late March, India started to challenge the US for its no 1 position on the pandemic global hit list. By mid April India was on its way to success as the number of new cases hit 275 306 on 18 April, with the US on 70k as its third wave tapered down. On 6 May India peaked at 414 433 new cases.
India’s most populous state, Uttar Pradesh, broke from the standard US protocol for treating Covid cases, distributing ivermectin widely to its 240 million population to prevent infection and for early treatment of the infected. The success UP was having had India’s medical authorities recommending all states on April 28 to use ivermectin as the means for prevention and treatment and most of the states complied.
The effect on the infection rate was almost immediate. The peak infection rate for all of India on 6 May was reached within a few days and a month later on 6 June it was down to 101 232; by 6 July it was much lower at 43 957 – still high. However, with a population about 4 times that of the US and with some states still sticking to the old outdated and ineffective protocol, this was a major achievement. On August 5, Uttar Pradesh, with only 5% of people vaccinated, had 26 new Covid cases and 3 deaths. The US, where the new wave of infections was still climbing, had 130 611 new cases on 5 August, reaching a new peak at almost 200 000 cases on 27 August.
In Japan, medical authorities noticed that African countries near the equator where ivermectin had long been used against parasitic infections, had fewer new cases and their deaths was a small fraction of the numbers in parts of Africa above and below the equatorial belt. They then must have experimented with Ivermectin and seeing the rapid improvement of patients, announced on 29 August that doctors must use ivermectin for all Covid treatment.
Again, as had happened in India, amazing results were achieved in a matter of days. The weekly chart below shows Japan’s new cases compared to new recoveries.
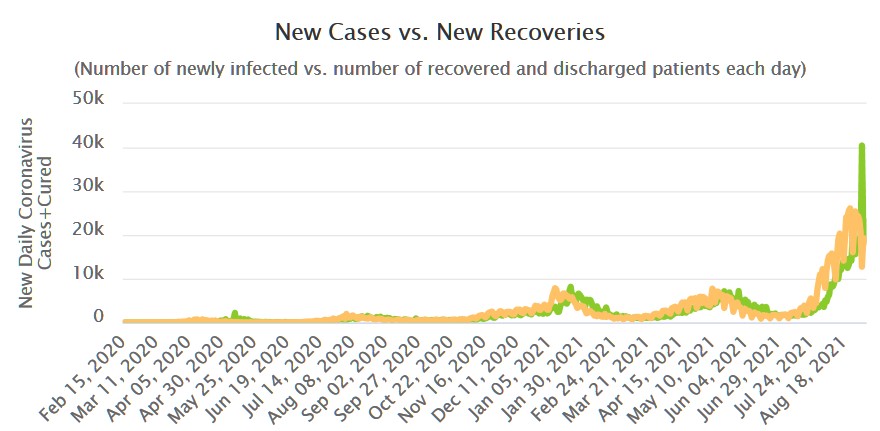
Prior to the week ending September 3, new recoveries (green) lagged new infections (yellow) by one to two weeks, as seen elsewhere as well. Then, for the week ending on Friday, new recoveries spiked dramatically higher and new infections plummeted, both during the same week. Ivermectin helped recoveries to catch up to infections!
Evidence of an effective treatment for prevention and treatment of Covid has been mounting for many months, in some countries in South America, from Africa and from trials run by medical practitioners. These doctors who are first responders to Covid do not have the resources in time and funds to launch a large professionally managed trial for new medications that take many months to complete – and which the medical authorities in the US require to authorise the use of new medication. Despite the fact that the current vaccines did not undergo such large long lasting trials!
Ivermectin is not recognised as appropriate treatment for Covid; the mass and social
media have been conscripted to push propaganda that ivermectin is useless against the virus, that it is a “horse medicine” despite having being cleared for human use by the FDA; and even that it promotes liver and kidney failure despite being a “safe wonder drug” as described by the Nobel prize committee. The propaganda is so pervasive that some pharmacists in the US refuse to fill doctors’ scripts for ivermectin.
The ineptitude, if not criminal negligence, of government with respect to Covid is not the only factor that describes how official policies and practice are smoothing the way for the US to lose its dominant position in the world. It is said that one cannot clear a swamp while being hip deep in crocodiles. When faced with a major task, it must be a priority to first clear away anything that makes it too difficult to complete the job.
Rebuilding the economy after the ravages of Covid, without incurring inflation along the way, requires cheap and ample energy. It therefore was shortsighted to introduce measures to combat the low priority risk of global warming by restricting exploitation of oil reserves and to cancel a project to obtain oil from Canada. Further, because opening the money spigots was successful in ‘kicking the can down the road’ during past crises, the Fed et al persisted in doing the same again in the current situation. Except this time the road is getting closer to the edge of a familiar cliff that had seen Germany in the 1920s, Zimbabwe and some other countries more recently, descend into financial and social chaos.
Even worse, at a time when the US is facing its most challenging problem since WWII, the country is being prompted by the powers that be and their mouthpieces to split into two strongly divisive and antagonistic groups; almost as if the official mantra has become that of kings and dictators: “to ensure loyalty from one’s subjects, create an external threat.” Except that in this instance the perceived threat is half of the US population, not one that is external and therefore serves to unite the people.
In the past I have expressed my concerns about the implications for America should the new Democrats of the kind bred by the Clintons and Obama regain political control of the country. The pandemic is an complicating unforeseen factor, yet a scant 2 years ago it would have been difficult to imagine the path the US is following now – almost as if a conspiracy is working to ease China’s way to the top of the global pyramid.
Or, perhaps, could there really be a globally coordinated effort to bring about the New World Order in which – as is often quoted – ‘nobody will own anything, but everybody will be happy’? A world complete with Modern Monetary Theory and Universal Basic Income, enabling the masses to enjoy all the free leisure time they could ever desire.
Last week’s US Markets had the weekly chart of the silver price and OI on Comex still showing the gap island low. Now the gap has been closed with an increase in the price of silver to above $24 – after the September options and futures have expired. This is still bullish, but not as positive if the gap island low had remained intact. The net OI of the Commercials increased to 37 967 from 36 126 the prior week and from 35 490 the week before that. The quite visible effort of the Big Banks to reduce their net short position is clearly failing.
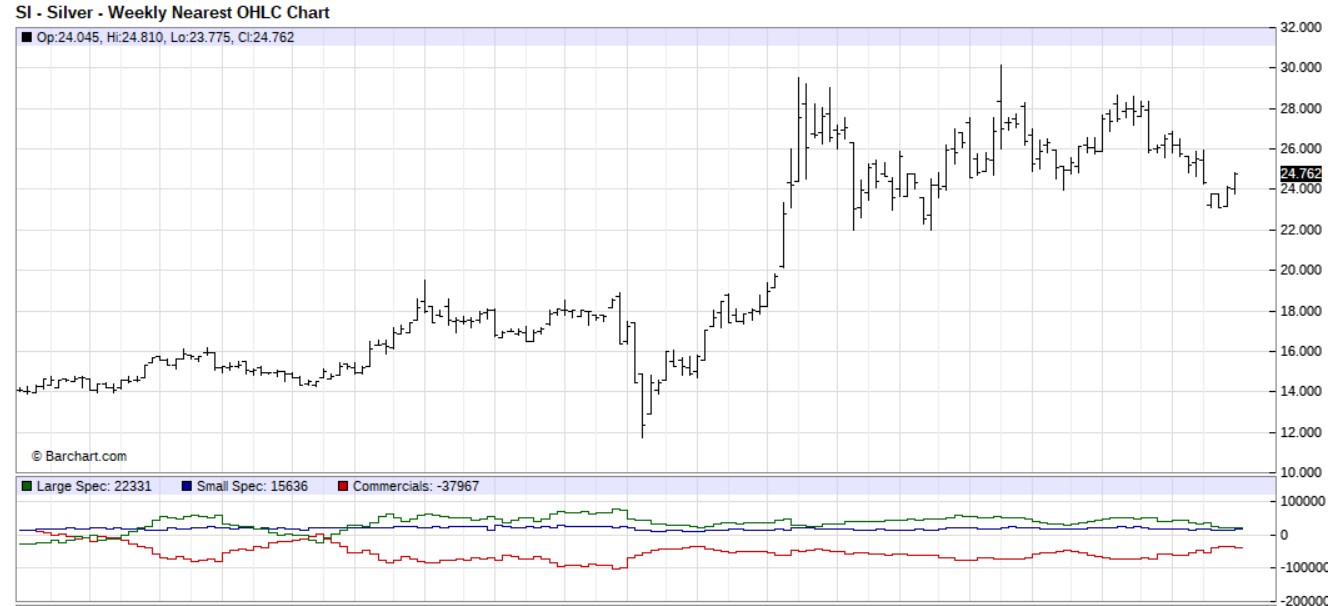
The respective net long positions of the large and small specs are now 22 331 and 15 630 compared to 21 861 and 24 265 the week before. The large specs are no longer going short, but are also not buying in quantity. The small specs have reduced their net long position somewhat, yet it is still quite substantial compared to the net long position of the large specs.
The silver Bulls were in a ‘wait and see’ attitude while the price of silver languished below $24, but this should change in next week’s CoT report now that the long held barrier at $24 has been breached – and provided the break higher holds.
Euro–Dollar
A week ago, the euro had reversed off the bottom of its bull channel PQRS to hint that the bear trend is over. Last week, the euro strengthened more to break into shallower bull channel CD as confirmation of the new trend – while the break holds, of course.
Channel ABCD has shown itself as an important feature since August last year, when it acted as key support on the four occasions it was tested prior to the new break lower which served as confirmation of the stability of the steeper bull channel. Now a break to above the potential bear channel KL will add further confidence in the recovery of the euro and also to imply that the dollar should remain weak for some time.
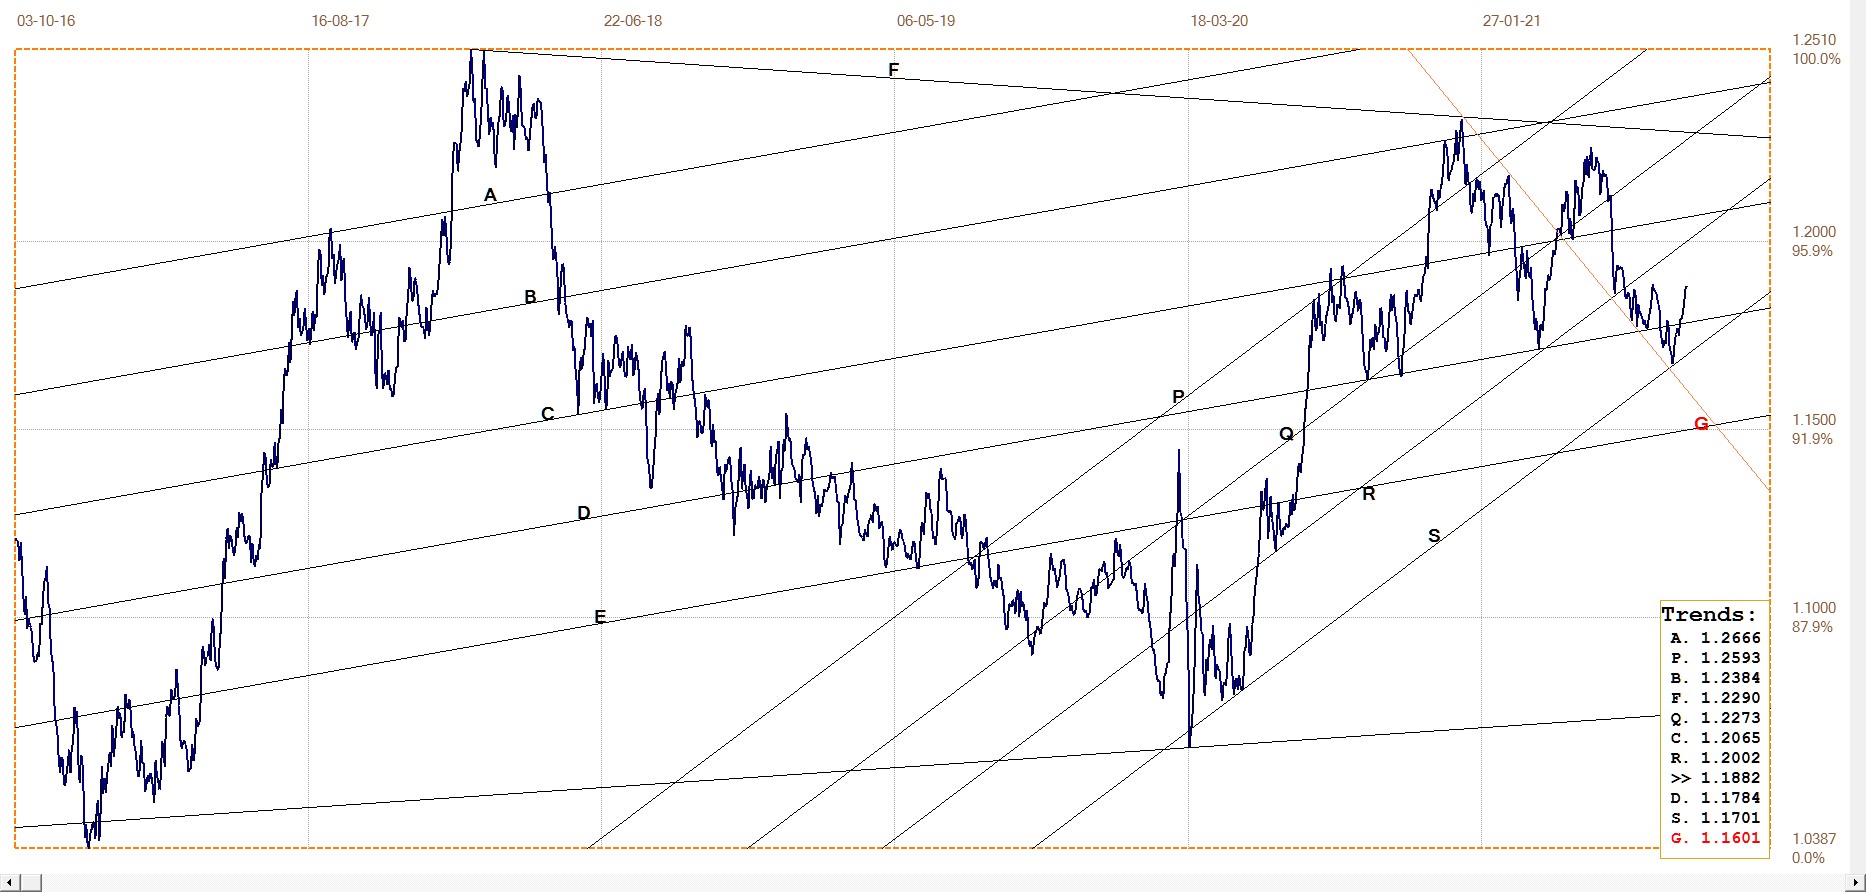
Euro–dollar, last = $1.1882 (www.investing.com)
DJIA daily close
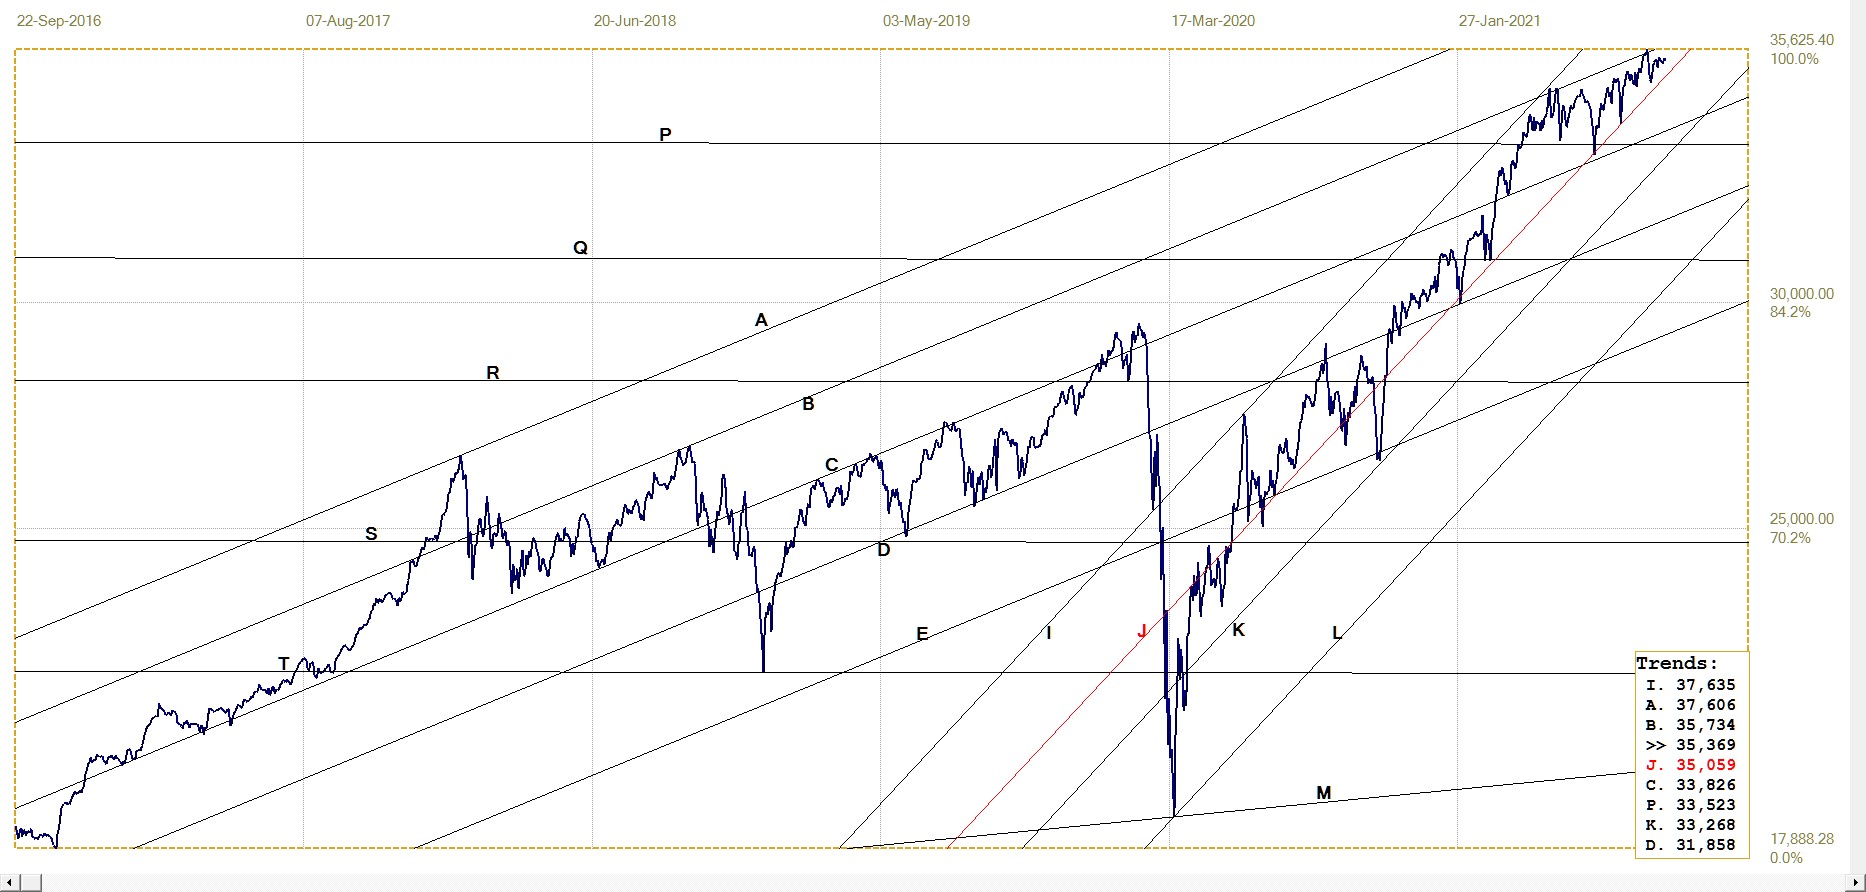
DJIA. last = 35369.09 (money.cnn.com)
The DJIA is hovering within its top range, but it is no longer achieving serial new all time highs. In fact, last week saw red letter closes on four days – only a manufactured rally on Thursday preventing four weaker closes in sequence.
Wall Street is also one of the contrived economic indicators employed to promote the perception among economists, investors and journalists of all kinds that the economic recovery is proceeding apace. While for some months the NFP and new unemployment claims were still below expectations, the pandemic offered a good excuse for poor less than exciting job-related statistics. The unexpected poor NFP number on Friday, which sent Wall Street into the red, offered a glimpse of the real situation in the economy.
While one has to remember that the levitating force on Wall Street has deep pockets, a time will come when consensus about the stock market becomes so pervasive that the flood gates of selling will open to make it near impossible to prevent a major sell-off – with a strong bear market rally to explode later at an opportune moment in time.
Gold London PM fix – Dollars
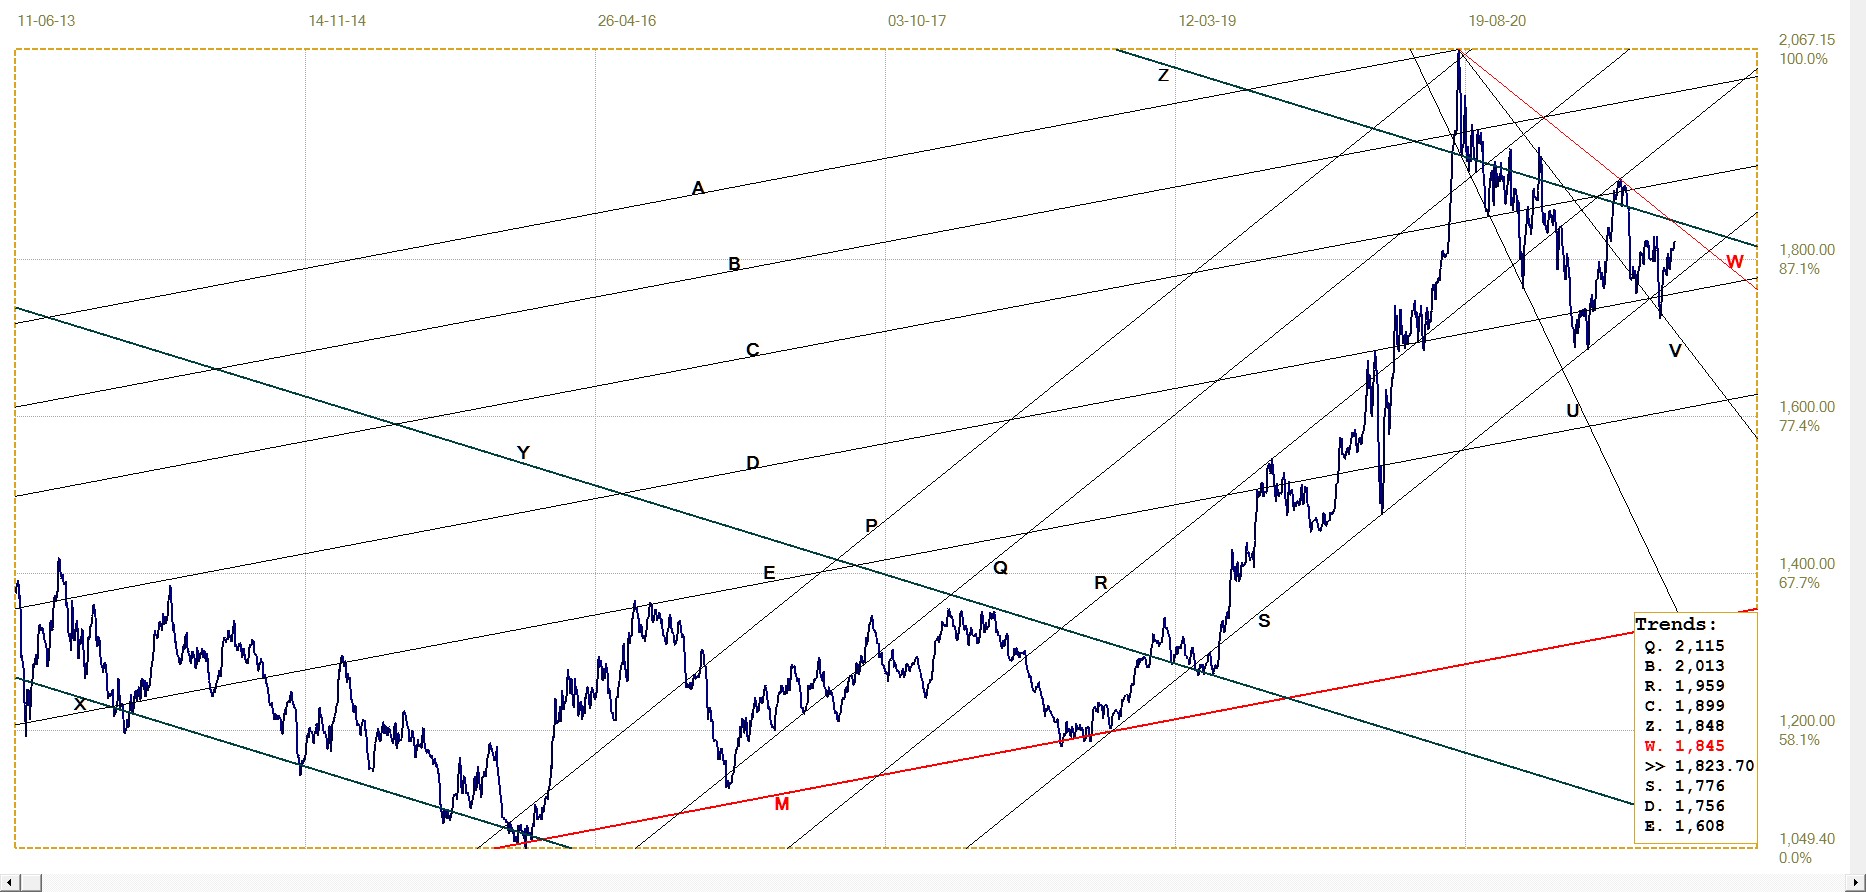
Gold price – London PM fix, last = $1823.70 (www.kitco.com)
The price of gold is back above the $1800 mark after the decline down to support at line Y and a rebound there that also has the price back in bull channel RS. Whether $1800 will continue to hold is a moot point – the Cartel’s behaviour has not revealed any sign that they are ready to let gold and silver rally without constraint. In time this is bound to happen, but for now selling pressure is to remain for gold in particular as it acts as a trend indicator for the price of silver. If the price of gold can manage to break above channel YZ, this should change.
Euro–gold PM fix
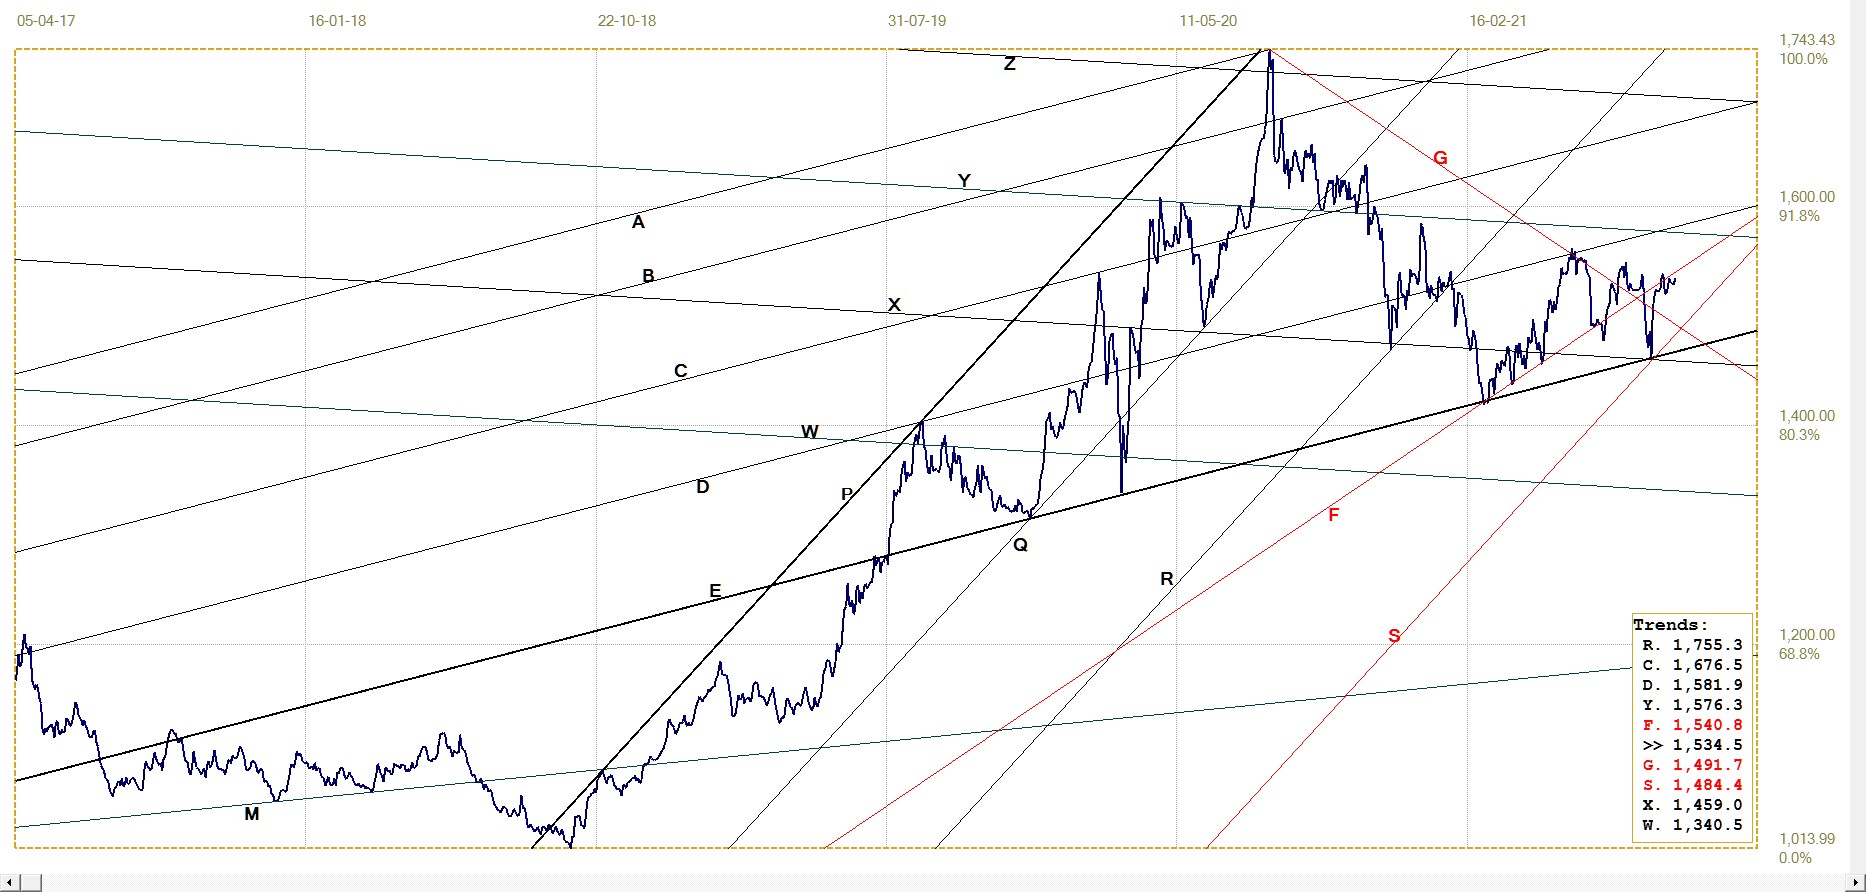
Euro gold price – PM fix in Euro. Last = €1534.46 (www.kitco.com)
Last week, a stronger euro was countered by an improvement in the dollar price of gold to keep the euro price of the metal within reach of the resistance along line F. Under the circumstances that is as much as one could wish and all the gold bulls in Europe have to keep twirling their thumbs and continue to wait for a good rally in dollar gold before they can expect a good reason to smile.
Unless gold can break free of the stranglehold on its price, the euro price of gold will begin to feel the full effect of a weaker trend in the dollar – to the extent that this is allowed by the powers that be once the dollar takes on a life of its own. Until then the euro price of gold will be largely determined by a stronger euro.
Silver Daily London Fix
The price of silver has completed its stay between lines S and X, which corresponds to the gap island on the weekly chart of the price of silver. The gap was closed and there is no gap island anymore; the price of silver is technically set free to increase further, if allowed to do so.
It is holding in bull channel KL, but has ample room to move sideways before the channel support is challenged. This implies one should not expect fireworks soon in order to remain within the steep bull channel.
Silver daily London fix, last = $24.055 (www.kitco.com)
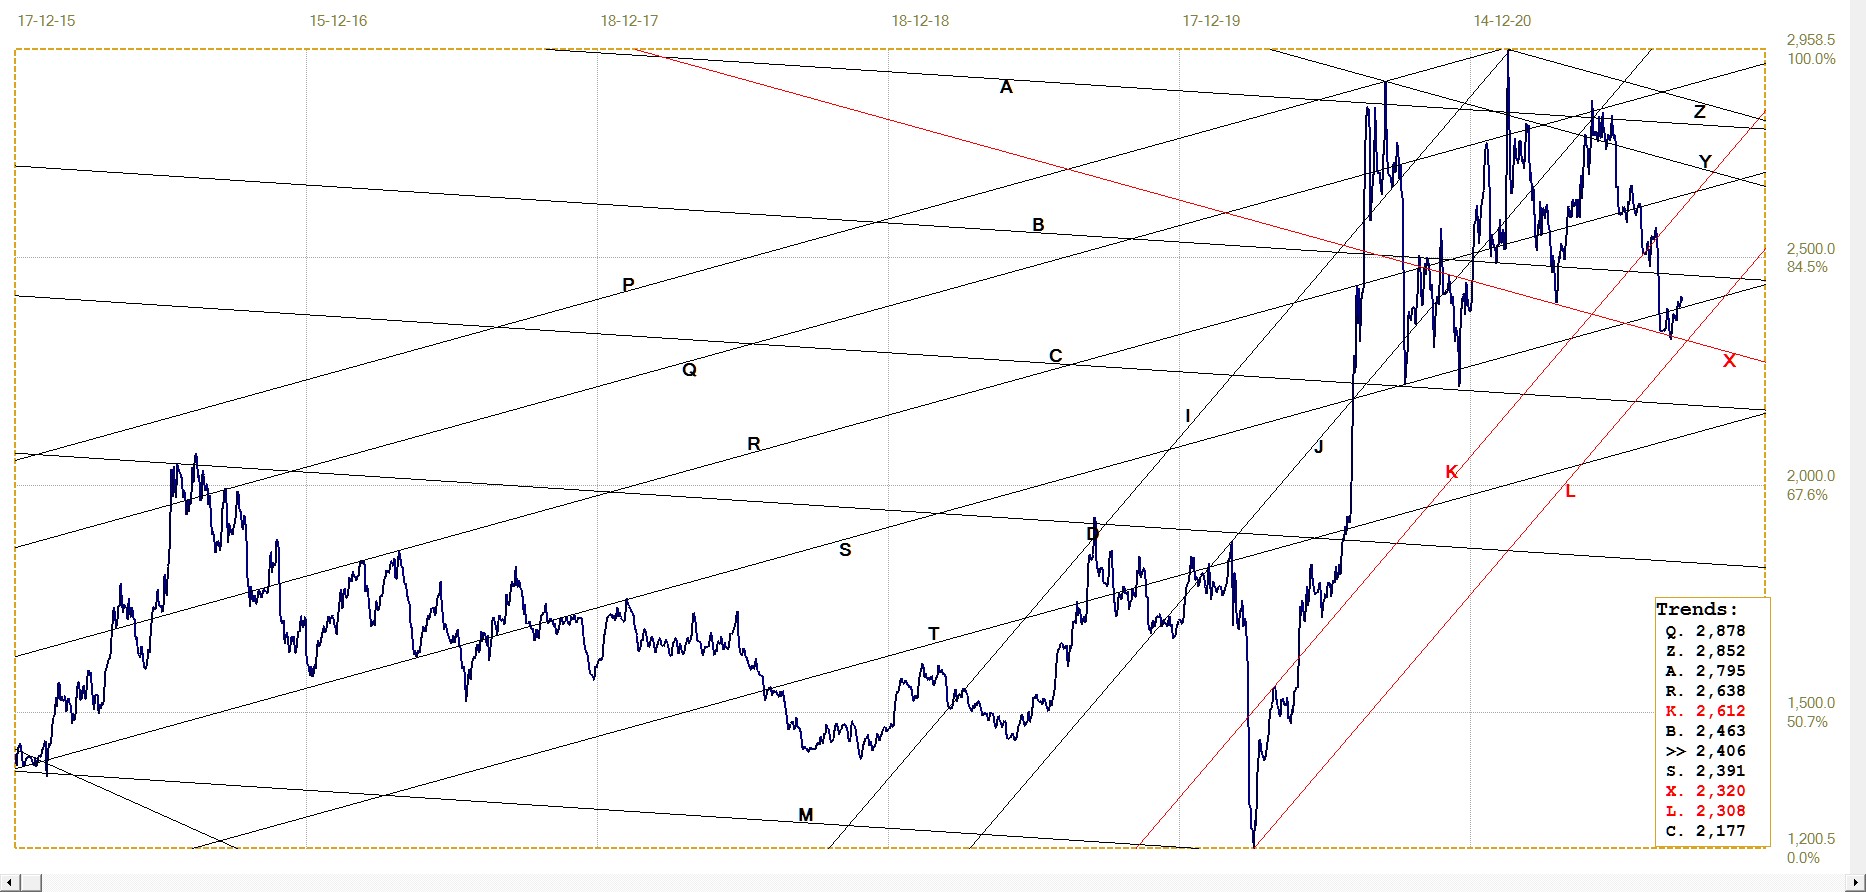
U.S. 10–year Treasury Note
U.S. 10–year Treasury note, last = 1.326% (www.investing.com )
The rebound off line S has ended the 10-year US Treasury note’s trend towards lower yields, at least for now. But there has also been no indication during the past few months that the market anticipated much higher inflation. The market probably has much faith in the Fed’s undertaking not to increase interest rates until perhaps in 2023. One has to wonder whether that promise will mean anything should the CPI begin to approach a double digit number.
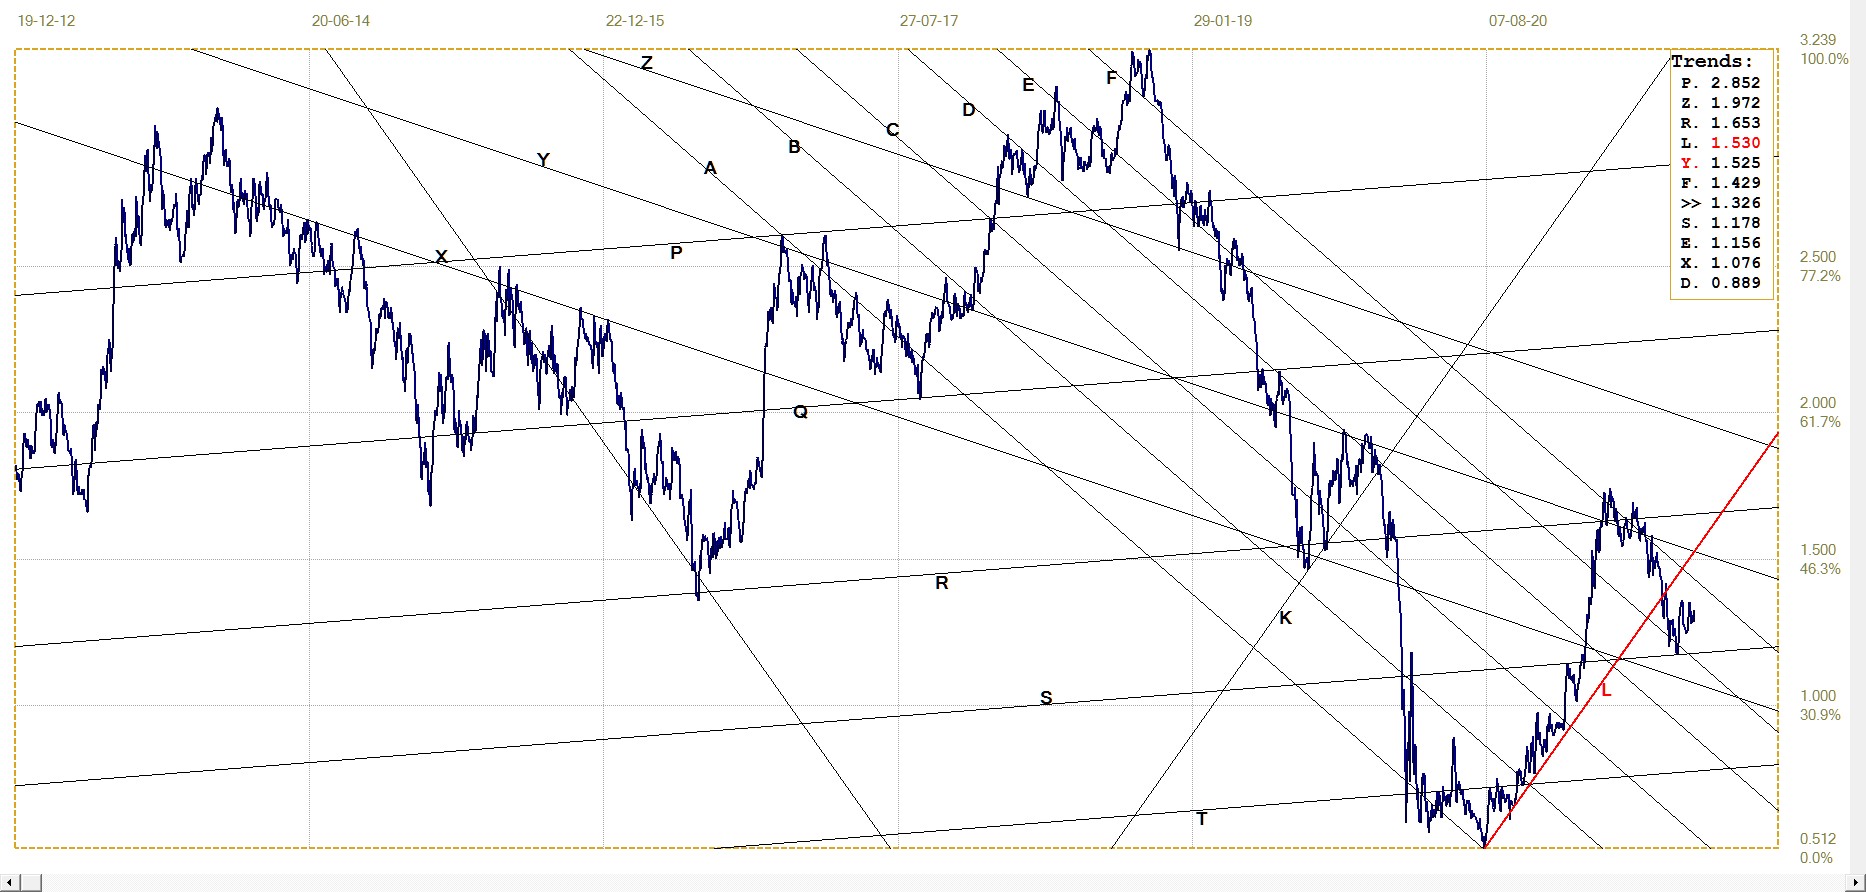
West Texas Intermediate crude. Daily close
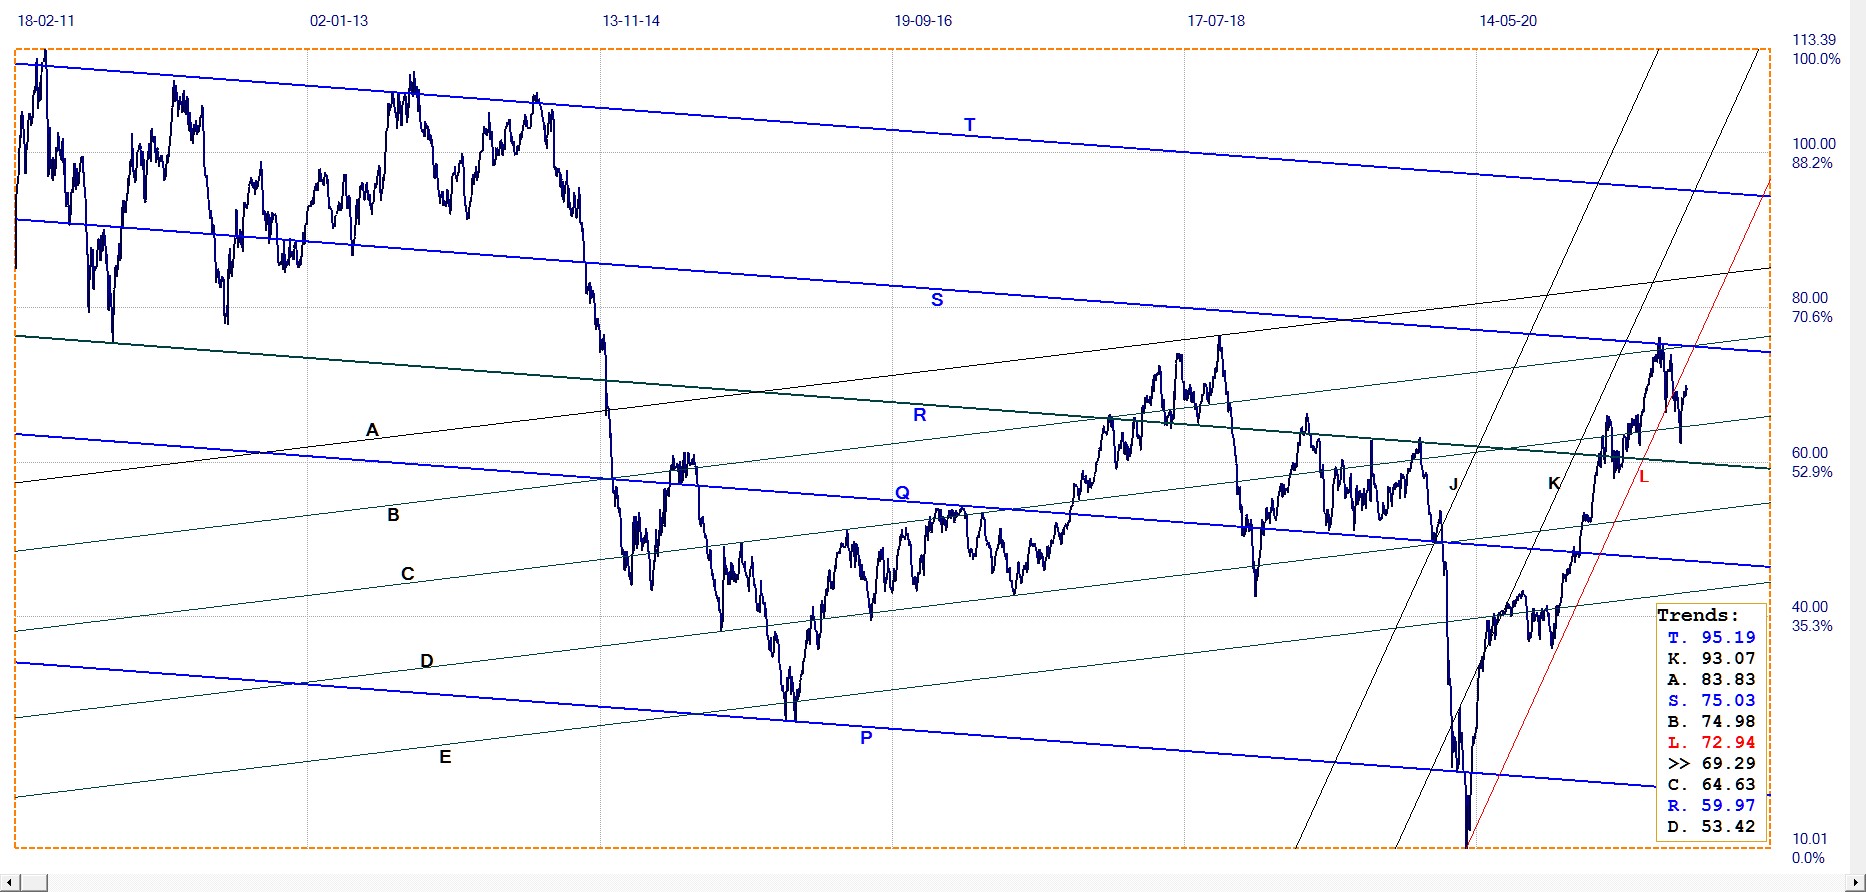
WTI crude – Daily close, last = $69.29 (www.investing.com)
The break below bull channel JKL is still in place despite a steep recovery from below line C. The latter half of the rally in the price that occurred in 2021 is at least in part a result of the reduction in available oil supply that resulted from the prohibition of oil extraction from certain parts of the US and the disappointment of when the pipeline to obtain oil from Canada was canceled.
The reversal off line S and the break below bull channel JKL probably has to do with fresh awareness in the energy market that the economy is not growing as fast as the official statistics and pronouncements and the state of Wall Street are suggesting. It is known that the number of currently employed workers still fall far short of the number of workers from before Covid, which must have the effect of lowering demand for all kinds of energy, including fossil fuels. The economy still has some way to go.
©2021 daan joubert.
*********
share
share
share
share
share


