How to Trade Natural Gas, Crude Oil & Gold ETFs


How to trade hot commodities like natural gas, oil and gold - We should see big moves in the coming weeks as gas bottoms, and oil & gold breakout or breakdown. A lot of money is going to be exchanging hands quickly and the key is to be on the receiving end of things. Below are some charts showing where these commodities are trading.
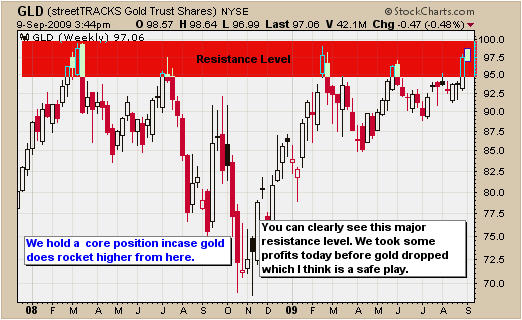
How to Trade Gold - Weekly Chart
How I trade gold is relatively straight forward. I use a simple trading model which allows me to identify the down side risk for a potential gold trade. I also use the same model for trading oil, gas and silver.
Beyond finding good entry points, it is crucial to know when to take some profits off the table. The weekly gold chart clearly shows gold trading at a resistance level which means there are going to be more sellers than buyers, hence the reason it is called resistance:.
To trade gold I enter with my low risk entry points and sell half my position once I reach a resistance level. Today for example gold moved up into this long term resistance level and then started to head south. We took some profits off the table before gold dipped in the late afternoon for a healthy gain. Taking profits is a must or you'll simply hold onto winning positions until they eventually turn into a loser.
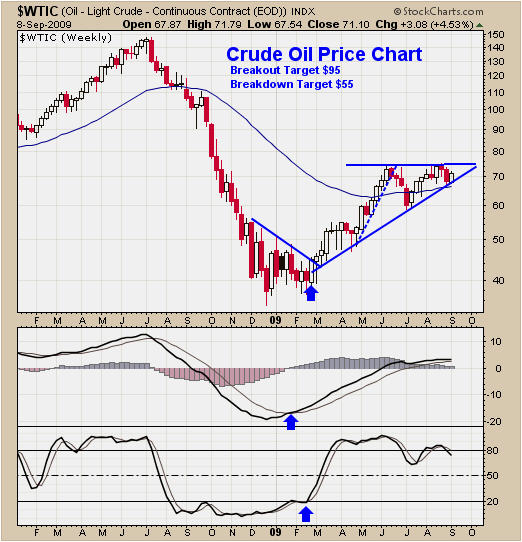
How to Trade Crude Oil - Weekly Chart
Trading crude oil is exciting because it moves much faster than gold. How to trade crude oil with low risk can be done by using my simple trading model which is a combination of indicators like momentum, support & resistance, volume, price patterns and media coverage. All these things combined allow for highly accurate trades with minimal down side risk.
Crude oil looks ready to make a big move. The odds are pointing to higher prices because oil has a multi month bullish price action and the falling US dollar helps increase the price of oil. I can see oil breakout and rally into the $95 per barrel level if things go that way in the coming weeks.
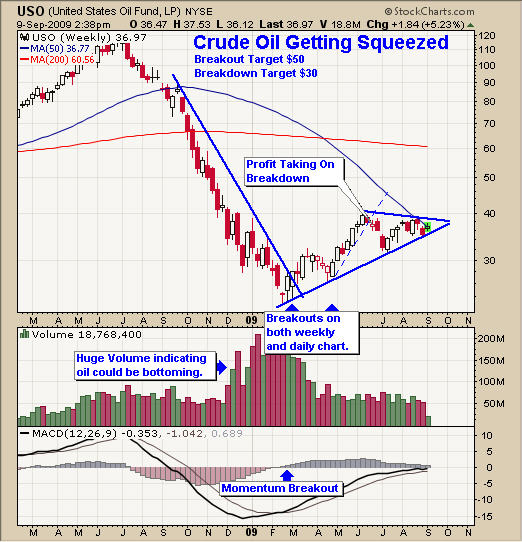
How to Trade Oil (USO Fund) - Weekly Chart
USO tracks similarly to the price of crude oil and it provides some great trades for both swing traders and day traders. I focus on trades that bounce off support with low downside risks, which occur on both the daily and weekly charts.
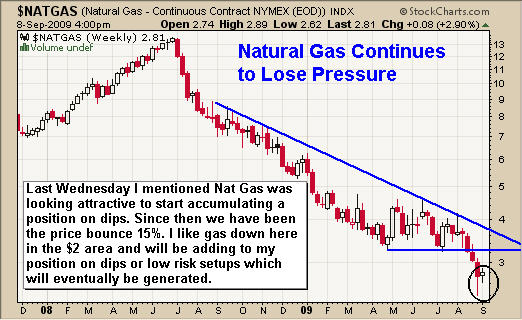
How to Trade Natural Gas - Weekly Chart
Natural gas is looking ready to bottom here. If you go back to the early 90's the $2-3 range is a major support level. While I don't generally try to pick bottoms, there are some signature price patterns and volume patterns that have proven to be very profitable for catching sharp bounces.
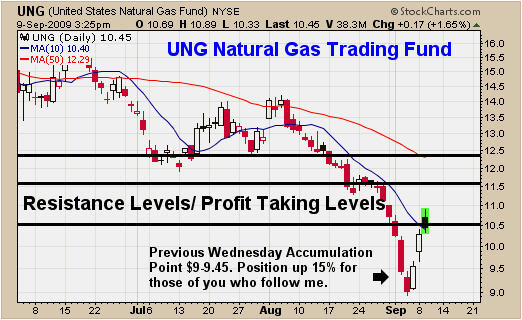
How to Trade Natural Gas - Daily Chart
The daily chart shows a perfect waterfall sell off with the price of natural gas dropping to a long term support level. This pattern combination shows panic selling which indicates a short term bottom is close.
The extreme panic selling and sharp decline in price, removes much of the down side risk. Scaling into a position over a few days, if the price continues to move lower, is important for this strategy to work its magic.
The black horizontal lines show my resistance levels for taking profits. If the price were to drop below $10 then I would exit the second half of the position to lock in the rest of the profit.
How to Trade Commodities Conclusion
Trading commodities is very simple with all the ETF's and funds available. The energy funds like oil and gas have some issues with following the prices of their underlying commodity but I do not find it a problem with my style of trading.
I would really like to know the entire story about what is going on with the oil and nat gas funds which have crazy contango issues??? Why do other commodity funds like GLD (gold bullion) and SLV (silver bullion) not have these issues?? Why can't they make a fund which follows oil and gas properly? All I know is that there are a lot of dishonest people in the financial industry taking honest hard working peoples money.

Chris Vermeulen has been involved in the markets since 1997 and is the founder of Technical Traders Ltd. He is an internationally recognized technical analyst, trader, and is the author of the book: 7 Steps to Win With Logic
Through years of research, trading and helping individual traders around the world. He learned that many traders have great trading ideas, but they lack one thing, they struggle to execute trades in a systematic way for consistent results. Chris helps educate traders with a three-hour video course that can change your trading results for the better.
His mission is to help his clients boost their trading performance while reducing market exposure and portfolio volatility.
He is a regular speaker on HoweStreet.com, and the FinancialSurvivorNetwork radio shows. Chris was also featured on the cover of AmalgaTrader Magazine, and contributes articles to several financial hubs like MoneyShow.com.


