HUI Index: Bull Pullback Or Bear Rally? (Part 1)


Call us Gold Bugs if you wish - it's OK - really.
We have a firm belief that the precious metals, Gold and Silver, are the only real money on planet Earth. We also believe the metals are in a secular bull market that has several more years to run.
Yes, holding these opinions places us in a minority group that is way outside the mainstream of financial "thinking."
Over a beer we might have a conversation with you about the mainstream sheeple and how their blind acceptance of fiat currency will lead them to financial ruin.
But that is a conversation for another day.
Today we want to look at the HUI Gold Bugs Index (our namesake index!) and how it is performing.
Precious metals have been in a downtrend for three years now but a cyclical bear market in the middle of a secular bull market is to be expected - that's how financial markets work. Secular cycles are 10 to 20 years long while cyclical cycles run 1 to 3 years. The cyclical downturn in the precious metals is most likely reaching its end.
So how do we determine when a downtrend has ended and a new uptrend has begun? Let's start by defining terms. A downtrend consists of a series of lower highs and lower lows. An uptrend is marked by a series of higher lows and higher highs.
If we look at the daily chart of HUI below we see that, in the big picture, price has been making lower highs and lower lows - that's the definition of a downtrend. But focus now on the right side of the chart. Notice that since the low in November 2014 price has been making higher lows and higher highs - this meets our definition of an uptrend.
The key question we need to examine is whether this three month old uptrend is the start of a new bull cycle or just a bear market rally in the ongoing bear cycle.
Unfortunately there is no definitive answer to our key question. All we can do is look at the clues available to us and then make an informed decision as to how we want to position our hard-earned capital.
The first clue we have is price behavior. Look at the left side of the HUI chart and notice how price is moving in relatively long, flowing legs. Each of these legs is roughly three months long and there are no definitive price swings within the legs.
Then we get to the right side of the chart and find that price behavior has changed. Instead of legs that are three months long we are now getting legs that are only 2 weeks to 5 weeks long and these legs are creating a series of definitive swing highs and swing lows.
Price behavior changed in November 2014 - that is clue #1 and possibly the most significant clue we have.
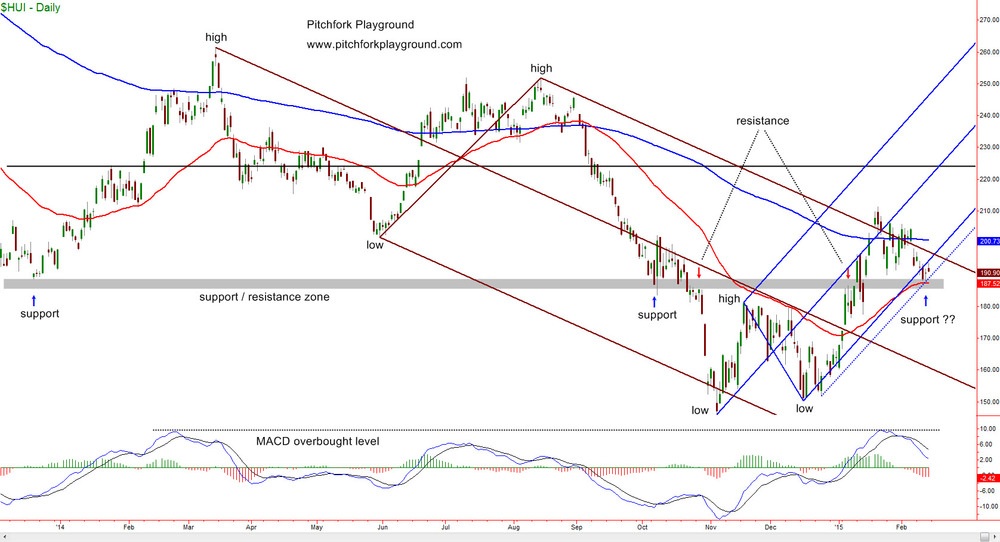
Our second clue involves Andrew’s pitchforks. To draw a high quality fork we need a series of three swing points or pivots. On the left side of the chart we have three obvious pivots and we use them to draw the red, downward sloping Andrew’s fork in the chart above.
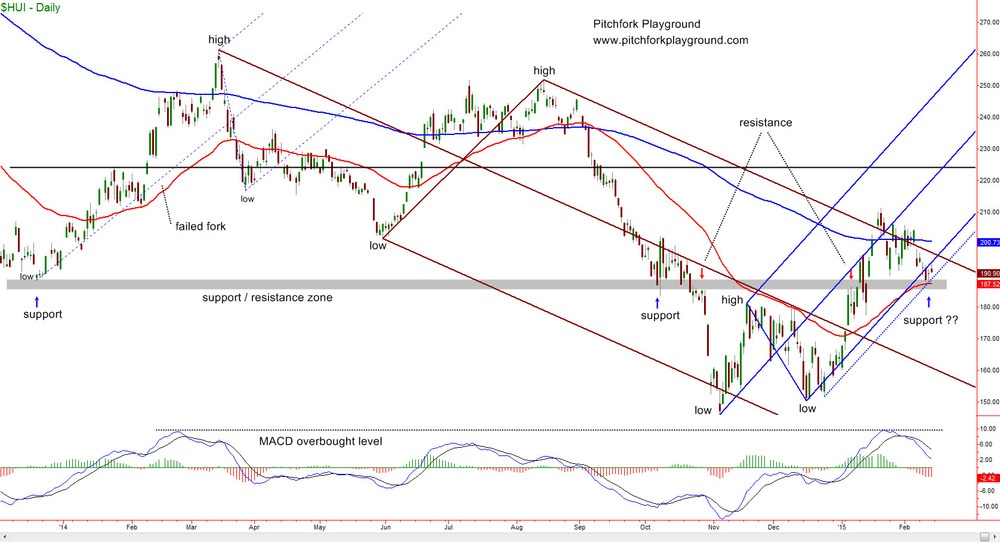
On a shorter time frame there was an upwards sloping fork in early 2014 (chart below) but that fork failed fairly quickly and price resumed its downtrend.
The next opportunity we had for drawing a good and upwards sloping pitchfork came in December 2014 after price made a higher low and then confirmed that low swing point with a move higher. Ironically, the confirmation of this swing low came on December 24 and 26 - quite the Christmas present for Santa to bring to us Gold Bugs.
So that is clue #2: we now have an upwards sloping Andrew’s pitchfork that is accurately describing the price behavior.
We will continue examining clues tomorrow.
********
Courtesy of http://www.pitchforkplayground.com/


