HUI Index: Bull Pullback or Bear Rally? (Part 2)


Yesterday we looked at the daily chart of the HUI and found two significant clues to help us investigate how this vehicle is performing. Those clues are:
1. Price behavior
2. Andrews pitchforks
Part 1 of our analysis can be found on the website: HUI Index: Bull Pullback Or Bear Rally? (Part 1)
We have three more clues to examine today:
3. Moving averages
4. Support / resistance
5. MACD
Moving Averages
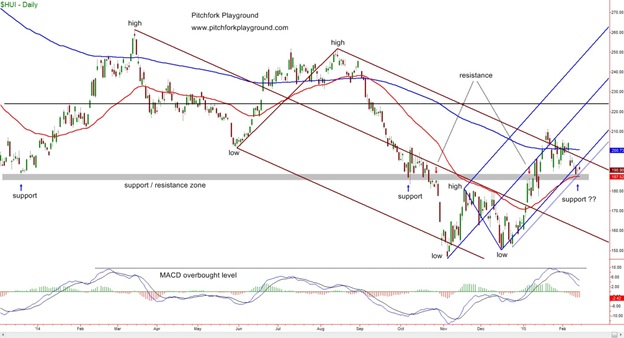
One of the simple ways of classifying a chart as being bullish or bearish is to look at price action relative to the 200 day moving average (DMA). If price is below the 200 DMA the chart is bearish. When price is above the 200 DMA the chart is bullish.
A refinement of the simple bullish/bearish classification involves comparing the 50 DMA to the 200 DMA. In a bullish chart we want to see the 50 DMA above the 200 DMA. When the 50 DMA is below the 200 DMA we can classify the chart as bearish.
There are periods of time when this method gives us mixed signals. Price can be above the 200 DMA while the 50 DMA remains below the longer average. This has occurred twice in the HUI over the past two years. Traders who went long during these periods were quickly disappointed when price dropped back below the 200 DMA and resumed the relentless downtrend.
Based on the moving average criteria the HUI clearly remains bearish at this point. Both price and the 50 DMA are below the 200 DMA. So there’s our third clue – based on the relative positions of price and the moving averages, HUI remains bearish.
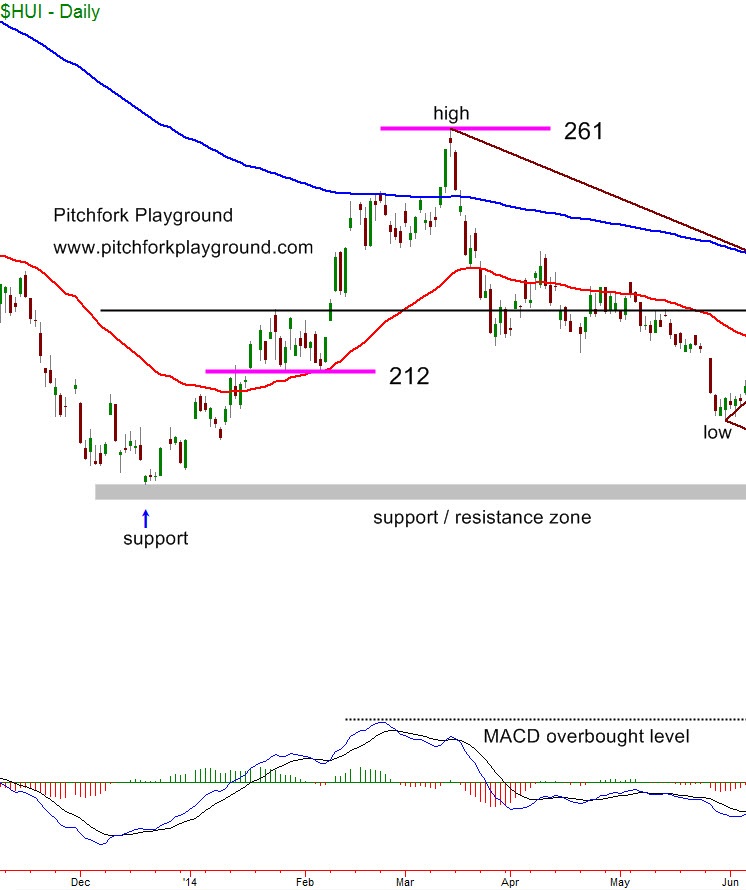
Before we give up on HUI because of the moving averages, however, let’s look at the previous times when price and the averages were in their current configuration. We have two of these to examine.
Going backwards in time we find the first rally off of the 50 DMA on the left side of our chart above – the chart below zooms-in on that action. On February 6, 2013 price tested support on the 50 DMA and then rallied higher for the next 5 weeks. This rally took us from 212 to 261 for a gain of 49 points or 23%.
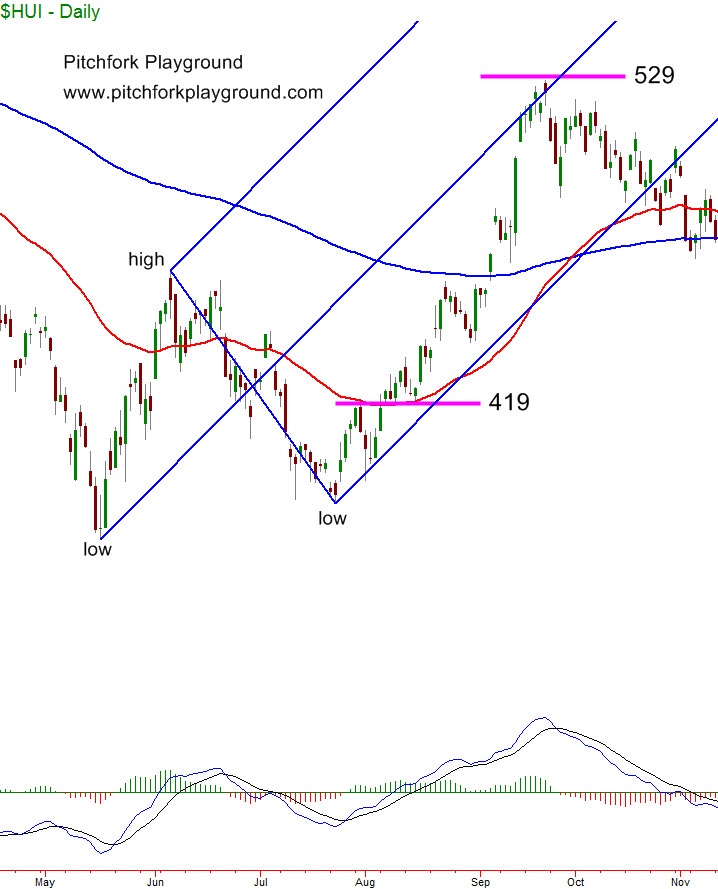
Continuing in our wayback machine we find the next rally of interest in the summer of 2013. Price tested the 50 DMA on August 15 and rallied for 5 weeks. This rally started at 419 and ended at 529 – that’s a gain of 110 points or 26%. Notice that the Andrews pitchfork accurately described this rally.
There are no easy answers when it comes to trading and investing. On the one hand HUI is bearish based on the current positions of price and the moving averages. On the other hand we have two examples of price rallying more than 20% from the current configuration. Let’s keep that in mind but move on for now and look at support / resistance.
Support / Resistance
When we are analyzing a chart we often look for support / resistance (S/R) levels with the assumption that price will interact with these levels in a meaningful way. Price might reverse in these areas, hesitate briefly before continuing or consolidate sideways for some time. As traders we want to be aware of these possibilities so we can manage our positions accordingly.
There are some obvious places to expect S/R to come into play: moving averages, round numbers like 200, trendlines and previous high / low points. Less obvious, but just as significant, are the median lines of Andrews pitchforks and Fibonacci retracement / extension levels.
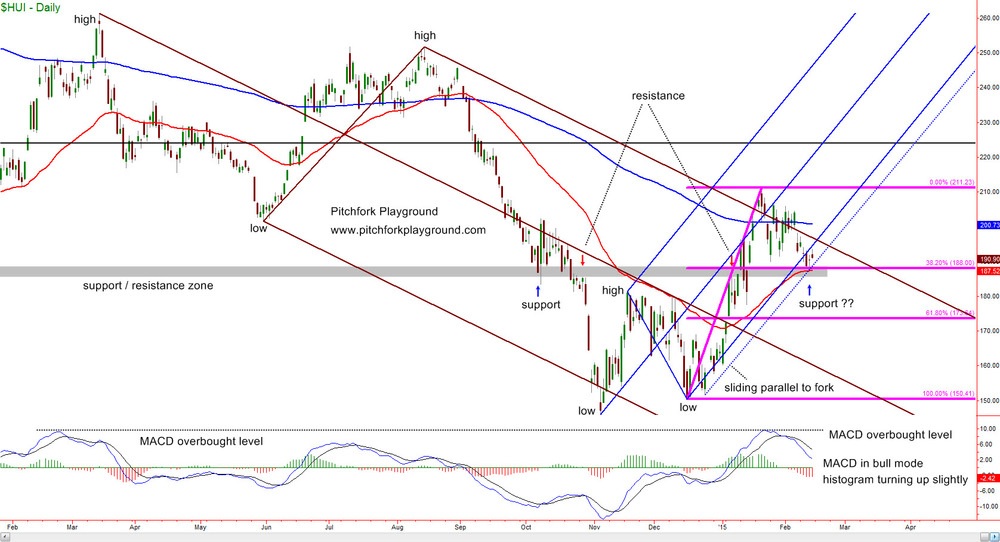
Sometimes S/R occurs along a discrete line but it can also show up in a zone as we see in the chart of HUI. This S/R zone starts around 185 and extends upwards through 189 or so.
Notice how the S/R zone in HUI has been tested from both sides. Price found support along this level in December 2013 and early-October 2014. In late-October 2014 and January 2015 price ran into resistance at the bottom of the zone.
S/R levels that get tested from both sides are of particular interest because they tend to be revisited in the future. In the case of our HUI chart we see price currently testing support along the top of the S/R zone. This test involved two candlesticks that found support at the S/R level. So far, the test has been successful since we have a third bar where price is moving higher.
Moving Averages
Price often interacts with the moving averages so we expect them to act as S/R levels. In our HUI chart there are numerous examples of price finding support or resistance at the 50 and 200 DMAs. Of interest to us today is the latest example where price has tested the 50 DMA from above, found support, and then moved higher.
Andrews Pitchforks
The median lines of a well-drawn pitchfork often identify areas where price will find support or run into resistance. The five rules for using Andrews pitchforks let us know how price is likely to interact with the median lines.
Sometimes price will overrun a median line before reversing direction. We see an example of this in our HUI chart on December 24. Price dropped below the fork’s lower median line before finding support and reversing to close above the line. This action doesn’t invalidate the fork but we want to be aware that price may overrun the line again before finding S/R. We use sliding parallels to keep track of these overruns.
A sliding parallel is simply a line drawn parallel to the median lines of a pitchfork. We then slide that line around on the chart to identify potential S/R levels - hence the name, “sliding parallel”.
In our HUI chart we draw a sliding parallel and place it below the low on December 24. Notice that price has just tested this sliding parallel where it found support and headed higher.
Fibonacci Retracements / Extensions
Price often reacts at Fibonacci retracement and extension levels. There is lots of debate about Fibonacci techniques. Some analysts maintain that the Fibonacci numbers describe a universal law of nature while others insist that they are a self-fulfilling prophecy. It doesn’t matter to us which of these views is correct, all we need to know is that price often reacts at the Fibonacci retracement levels.
In the chart below we have added the Fibonacci retracement tool to the upward move from late-December to late-January. Notice how price just tested the 38.2% retracement of this move and then moved higher. Whether it is natural law or not, it appears that price has found support at the Fibonacci retracement level.
Now we have our fourth clue: price has tested a confluence of multiple support levels and that test was successful.
MACD
MACD can provide valuable information but we want to be selective about how we use it. Review the website for a discussion of indicators and their shortcomings.
For our HUI chart we want to consider these aspects of the information provided by MACD:
- Bull vs bear mode
- Overbought / oversold levels
- Histogram
At the grossest level MACD provides us with a quick way to classify a chart as bullish or bearish. When both of the MACD lines are above zero the chart is bullish. If both lines are below zero the chart is bearish. Clearly our HUI chart is in bull mode based on the MACD indicator.
Another useful aspect of MACD is how it can identify overbought and oversold levels. The indicator isn’t bounded but we can use prior MACD highs and lows to predict where price may run out of energy and reverse. In late-January when price topped-out and reversed the MACD indicator had reached the same level of overbought-ness that stopped the upward move back in March of 2014.
The MACD histogram is the fourth derivative of price data as we discuss on the website. As such, we need to be very leery of making any decisions based on this information. With that said, notice that the histogram has started to flatten out and turn slightly upwards. This could be an indication that price is running out of downwards energy and now wants to move higher.
MACD gives us our fifth and final set of clues: HUI is in bull mode, we know when to watch for price becoming overbought and we have a very subtle indication that price may have run out of downwards energy.
Summary
We have five clues now to consider in regards to HUI and its potential action from this point going forward. Those clues are:
1. Price behavior
2. Andrew’s pitchforks
3. Moving averages
4. Support / resistance levels
5. MACD
We will summarize all of these clues and draw some conclusions in Part 3.
Bryan
Editor-in-Chief, Pitchfork Playground
More from Gold-Eagle


