I Bought A Stock (AU) At 20; Now It’s 23 – Am I Rich?


I BOUGHT A STOCK (AU) AT 20…
…Now, it’s 23. I must be rich. That sounds ridiculous and it is. But, that is how some gold bulls sound when talking about “new highs” for the yellow metal. At least one analyst mentioned the “four year wait” for gold’s breakout, so let’s go back to 2020. More precisely, August of 2020. If anyone had bought a stock which was predicted to “break 20 and go straight to 30” would it have generated the same excitement that predictions for gold to go from $2000 to $3000 did? Not likely; but that did not stop the torrent of predictions and hyped expectations for the rocket launch that some expected. Calls for $5000, $10,000, and higher stoked the fever and emotions of anxious investors. Alas, we all had to wait for almost four years. Now, those same anxious investors are hoping the rocket launch hasn’t aborted – again.
As has been said before, “once gold breaks $2000, or $2050, or $2100, etc., nothing will keep it from going straight to $3000.” Maybe; maybe not. If it does reach that number, will that be good enough to compensate for the time spent holding gold in anticipation of that price objective?
Referring to our stock analogy once again, if you bought a stock at 20 earlier this year and it goes to 30 within the next year, it would certainly be worth it. The trouble is that most people who are the most anxious to see something more glorious and fabulous happen on the upside, are those who have been predicting and expecting it for years. Most stock investors are not that patient. Furthermore, the waiting game has been very costly.
Let’s go back further. In August 2011, our stock peaked at just under $19 per share. Thirteen years later, it is at 23. Are we rich?
Up to this point we have been referring to nominal prices. Let’s review those first and then we will consider the effects of inflation and the volatility. Below is a chart (source) showing the gold price since August 2020…
Gold Prices – 2020-24
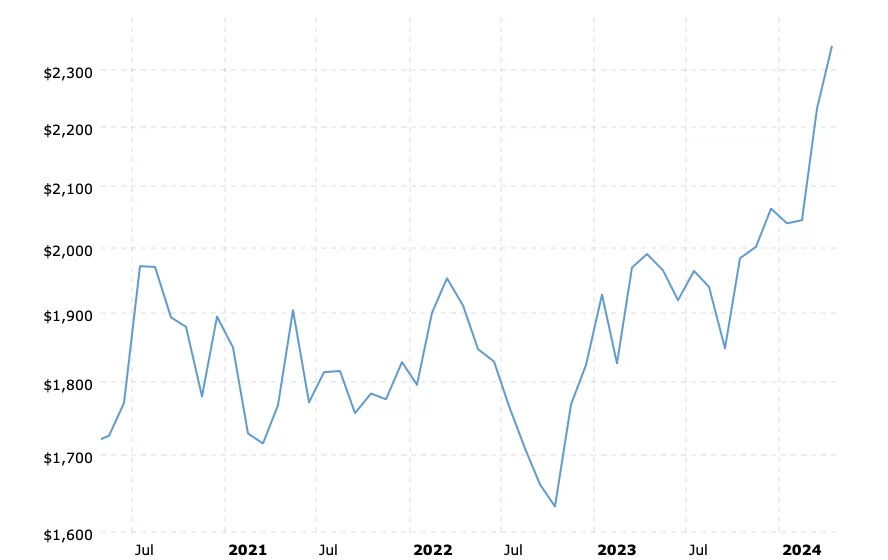
From the peak shown on the chart for August 2020 at $1971, gold is up $373 (19%), at today’s close of $2344. Using the round numbers from our title ($20/2000) and $23/2300) and being reasonably conservative, the gain is a more modest $300, or 15%. Of course, if you were smart enough to pick off gold at $1650 in late 2022, then your gain is closer to $700 oz. which is 42%.
Now let’s l0ok at a second chart. This one shows the gold price over the same time period, but with the price adjusted for the effects of inflation…
Gold Prices (inflation-adjusted) 2020-24
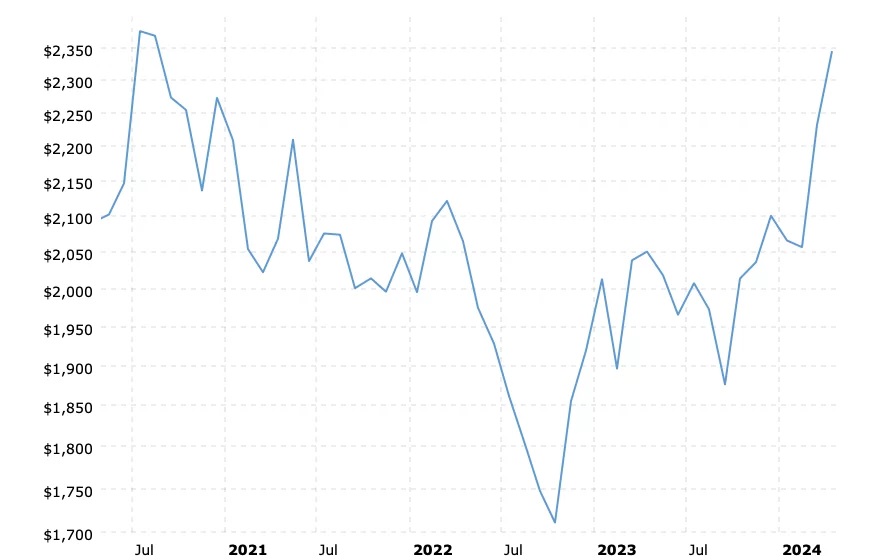
Here we see that the effects of inflation since August 2020 have stripped away the nominal gains. The end result is a net loss of $31 oz. The $1971 peak from August 2020 is now $2375 in today’s cheaper inflation-adjusted dollars. When allowing for the effects of inflation, gold at $2344 today is cheaper than it was almost four years ago at $1971. Real profits are the net result of nominal price increases minus the effects of inflation.
As for volatility, if the stock you bought at 20 dropped to 16 two years later, would you have been patient enough to wait for almost two more years just to get back to breakeven?
Our third chart dates back to 2011 and references the gold price action since then…
Gold Prices (inflation-adjusted) 2011-24
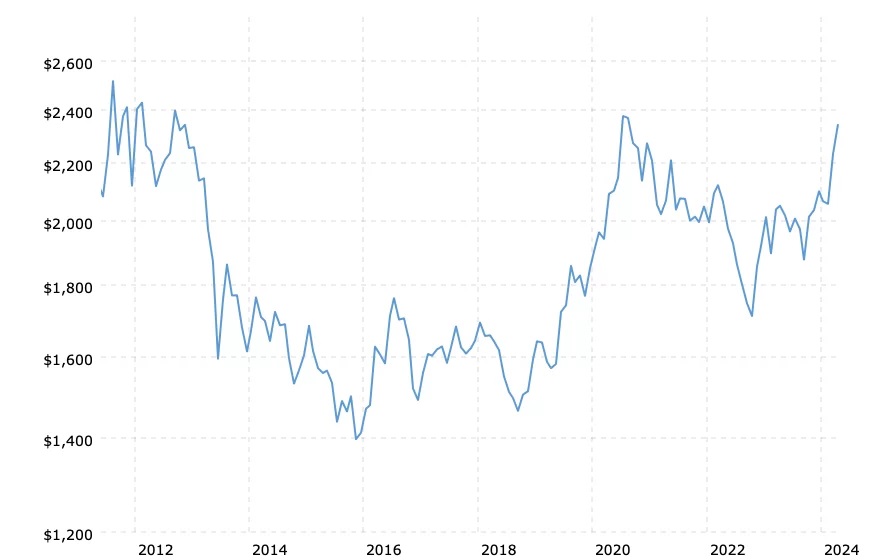
The nominal gold price peak in August 2011 was $1825 oz. At the current price of $2344 oz., the gain is $519 oz. or 28% (annual rate is 1.9%). When allowing for the effects of inflation as shown on the chart, the gain of 28% is actually a net loss of $172 oz. or -6.7%.
CONCLUSION
Some analysts think that gold’s solid breakthrough of $2000 oz. is especially significant and portends a much higher price. That is possible, but expectations of such higher price action are rooted in belief that gold is influenced or affected by various factors such as interest rates, geopolitical concerns, financial and economic turmoil, social unrest, etc., mistrust of governments and central banks, etc.
It is more likely, however, that the recent gold price increase is just a matter of accounting for the effects of inflation which have been absorbed into the economy since 2020. Historically speaking, that is all that has been reflected in gold’s previous price peaks. The most recent price action reinforces that pattern and is shown on our final chart below…
Gold Prices (inflation-adjusted) 1980-2024
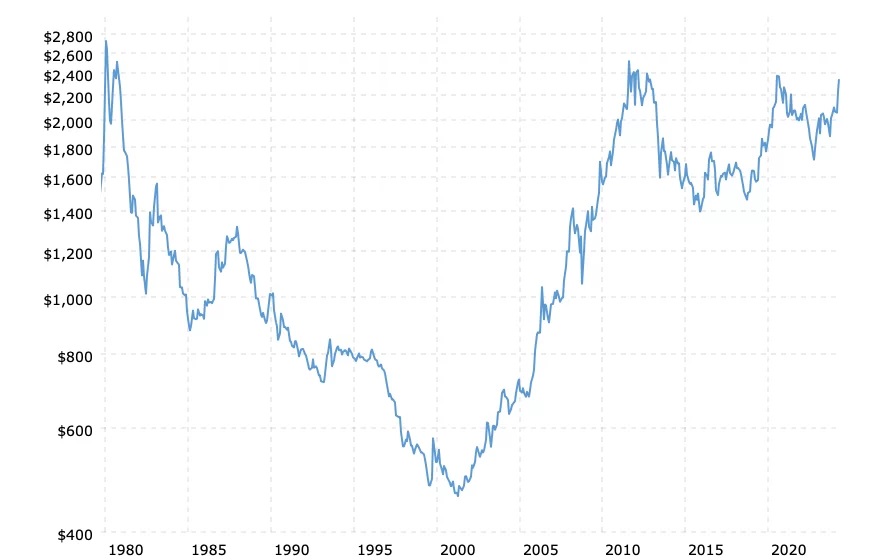
The average monthly closing price for gold in January 1980 was $677 oz. Today’s closing price for gold is $2344 oz. The total increase is almost 250%. In nominal terms, of course. Yet, after calculating the effects of inflation, which are shown on the chart immediately above, the gold price of $677 oz. in 1980 is currently $2722 oz. That means that in real, constant dollars, gold is still cheaper today than in 1980. The current gold price needs to be higher than $2700 just to match the 1980 price peak in constant dollars.
The higher price for gold is not about gold. It is a reflection of the effects of inflation which show up as a loss of purchasing power in the U.S. dollar; and is always in hindsight. All of the previous gold price peaks are at or slightly below the same point – the most recent inflation-adjusted price based on current U.S. dollars. It is realistic to expect that gold is approaching or has already reached that point in its current thrust upwards to $2300-2400. ALL of the other price action up or down, is simply a retracement of previous price paths.
Gold is priced in US dollars. Since the US dollar is in a state of perpetual decline, therefore, the U.S. dollar price of gold will continue to rise over time. There are subjective and changing valuations of the U.S. dollar from time-to-time and these changing valuations show up in the constantly fluctuating price of gold in U.S. dollars.
Gold is not going anywhere, but the U.S. dollar continues to erode. New higher gold prices are not really new highs for gold. They represent new lows for the dollar. (also see What Happens To Gold Price If Fed Doesn’t Cut Rates?)
Kelsey Williams is the author of two books: INFLATION, WHAT IT IS, WHAT IT ISN’T, AND WHO’S RESPONSIBLE FOR IT and ALL HAIL THE FED!
********


