Inflation Has Become a Hidden Menace


I’ve warned that the inflation numbers put out for CPI by the Bureau of Lying Statistics were going to become an aberration that fails more than ever to report the rising inflation I’ve said we would see this fall due to tariffs. Sure enough, while the inflation rate did creep up a notch, it did not go up as much as expected by economists, who were largely predicting tariffs would increase inflation. It went up even less than I was expecting, though I had not put a firm number on it.
Now we know why. I had already stated that the bureau’s numbers would fall short because it has admitted to collecting a lot less data now that DOGE fired many of the bureau’s workers. Its data, we could all predict, would become even more emaciated as a result of almost everyone at the bureau being laid off during the past 20+ days of the government shutdown.
The government called back just enough workers to try to hammer out Friday’s belated report because that report will be used for setting social security benefits for next year. It will also likely be the last CPI report to come in before the Fed’s final rate-setting meeting for this year in December because the Social-Security necessity won’t be there to push the next report during whatever time is left for the shutdown. It is, of course, also in the self-hobbled government’s best interest to keep inflation low in the report that will be used for adjusting all of next year’s Social Security benefits, or the debt causes of the shutdown will become worse.
Patched together like Frankenstein’s monster by a lot fewer hurried and harried workers than normal and with fewer cities being researched for inflation data, this was certain to become the Bureau of Lying Statistics least reliable data to date. Many economists were already questioning whether they would be able to rely on the data, but one economist stands out for me because he’s one I think well of, AND he’s one who has been saying tariffs will not cause any significant inflation, so he has been running opposite of most economists on this issue and certainly has been opposite of me.
Therefore, Wolf Richter’s take is the most interesting to me because he finds several profound reasons for stating the slight rise in Friday’s reported inflation rates was FAR less than it should have been and is definitely a huge aberration. When those who disagree with you on the cause of inflation agree on what is now happening with inflation—when doing so would tend to undercut their own position—it’s a strong corroboration, in the very least, about what the inflation rate is really doing.
The delayed release of the Consumer Price Index today, cobbled together with perhaps not all the staff and means that the Bureau of Labor Statistics has normally available due to the government shutdown, was perhaps the best that could be done under the circumstances.
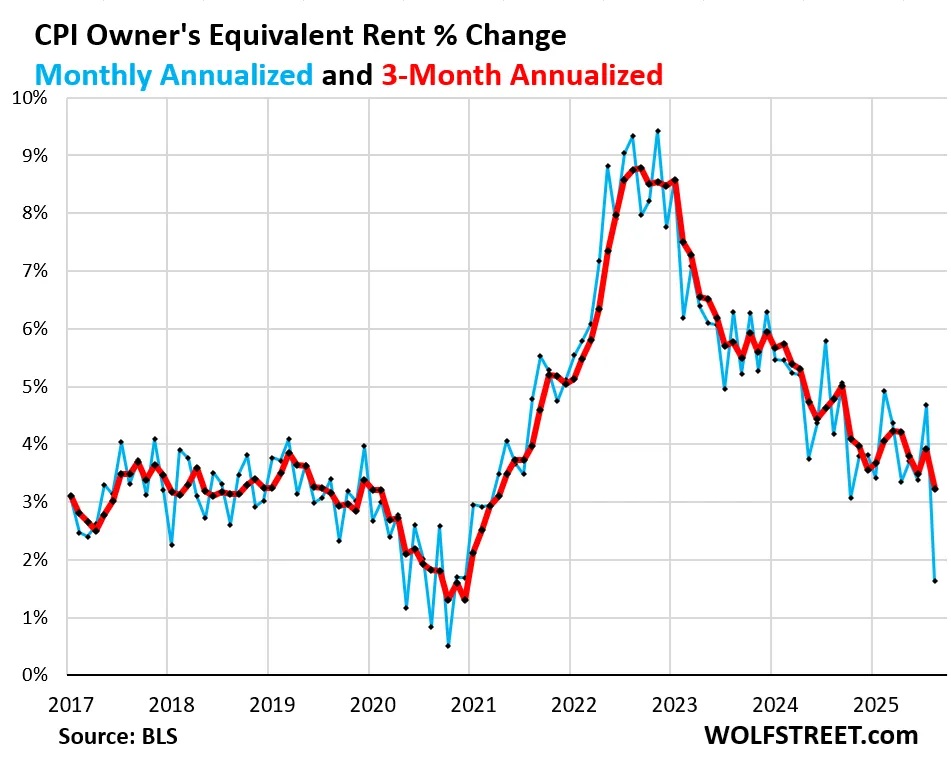
But there were a few things that were off, the most important of which was Owner’s Equivalent of Rent (OER), a huge component in CPI, accounting for 26% of overall CPI, for 33% of core CPI, and for 44% of core services CPI: It was a massive historic outlier.
OER rose by only 0.13% in September from August (blue line in the chart), according to the BLS today, compared to 0.38% in the prior month, and compared to the 12-month range between +0.27% (May) and +0.41% (July). Something went wrong there, and given its huge weight, OER significantly pushed down the month-to-month readings of overall CPI, core CPI, and core services CPI.
That means, without this huge and errant help from OER, the little jump in the inflation rate would have been a large jump in the inflation rate. OER is the BLS’s flawed (in the first place) way of measuring the cost of homeownership. I’ve explained why it is flawed before. This time, I’ll let Richter explain what it is made of:
OER is not a measure of rent. The measure of rent is the Rent CPI. OER is a stand-in for the costs of homeownership. OER indirectly reflects the expenses of homeownership such as homeowners’ insurance, HOA fees, property taxes, and maintenance. It’s the only measure for those expenses in the CPI. It is based on what a large group of homeowners estimates their home would rent for, with the assumption that homeowners would try to recoup their cost increases by raising the rent.
Notice there was nothing even in that about the cost of buying the home. The thing to keep in mind is that there are no set rules for how these homeowners should determine what their home would rent for, so they may also include some idea of the cost of their home that they would want to recover; however, even when the cost of homes falls, OER shouldn’t fall by anywhere near as much, because 1) it includes a lot more than the cost of the home; and 2) the majority of people reporting OER bought their homes long before recent price drops, so today’s falling prices and falling rents have nothing to do with how much they are paying in mortgage interest or principal.
You can see on Richter’s graph that the one-month plunge in the flawed-by-design OER was larger than any other monthly plunge over the past eight+ years that are shown on the graph:
If this situation with OER hadn’t happened, the inflation readings today would have been a lot hotter than they were, particularly core services CPI where OER weighs 44% and core CPI where OER weighs 33%.
The story, however, gets worse, because, even though the rise in the rate of inflation was less than expected by economists, who almost all expected a large rise due to tariffs, it was actually STILL a hefty bump, even with the help of the fake-news OER reading:
Overall CPI rose by 0.31% (+3.8% annualized) in September from August. So not a benign inflation reading, but the second worst since January. And yet it was pushed down by the OER outlier situation (blue in the chart below).
As for the drop in core inflation, which the Fed pays the most attention to, Richter says,
with 44% of it gone haywire in some way, it doesn’t really indicate anything for September.
Given how messed up the core services CPI is due to the outlier situation of OER, it doesn’t make much sense to delve into services inflation further at this point.
In other words, he considers 44% of the derived core inflation rate to be so far off it is not worth considering. As far off and unexplainable as Richter finds just that one measure inside of overall inflation, there are many other ways in which Friday’s inflation reading was lower than the truth, and I will lay out the rest of hidden spooks in the data in the remainder of this article where you’ll see there is a lot of interesting and sometimes suspicious-looking stuff going on.
Remember, the people who make this report now all know, based on what just happened to their last boss, they had darn well better put out favorable reports, or their jobs will be eliminated at a time when new jobs are harder to find because lots of other people’s jobs, especially in government, are being eliminated, too.
*******

David Haggith publishes The Daily Doom and writes satire. The Daily Doom contains economic, social, and political news about our troubled times--a non partisan weekday collection of the most consequential stories about our complex times with insightful editorials and weekly economic analysis. As an equal-opportunity critic of America's sharply divided, two-ring political circus, David divides his satire into sister publications so you can pick the one you find agreeable and ignore her sassy sister.
Support David Haggith by subscribing on Substack.


