Lessons To Be Learned From Trump’s Election


What happened during the course of US elections sent a very clear message for analysts around the world: Technical analysis might be the most reliable tool for understanding market behavior. 2016 US election was one of the most unpredictable mega-events of our time. Consequently, we are going to show you how technical analysis could help you make proper decisions during such periods of uncertainty. In order to build a decent case, let’s take a closer look at the sequence of events, which ended in election of Trump as the next President of United States.
Earlier this year, Gold had already topped and was in correction phase. While everyone was confidently betting on Hillary’s victory, the October Surprise shook the markets. FBI director James Comey dropped a bombshell into the markets announcing his administration’s decision to re-open the Hillary Clinton email server investigation. Hillary’s campaign was devastated and polls were smiling to Trump for the first time. Consequently, Gold soared from 1250 to 1308 and US Dollar Index dropped from 99 to 97 in a matter of a week. Yet after 10 days, Comey decided to “re-clear” Hillary from any criminal charges…and everything was “normal” again. On Monday Nov 7th (day before election), traders were joining the party, US Dollar opened with a gap and kept on until the results began to slowly surface and boom.
Trump Became The President
Trump as the President was un-predictable enough. However, what happened next seems to be in contradiction with fundamental analysis predictions; the gold price kept falling…and the US Dollar Index has been soaring ever since…!!!
- But why were the market reactions so different in the aftermath of Trump’s election…?
- Why did the Dollar rally and gold plunge…was it really that unpredictable…?
- With respect to technical analysis, how many rules have been broken so far…?
Here we are going to establish the fact that markets’ reactions was amazing, following technical analysis rules…not fundamental analysis which is the most reliable choice for prediction of the markets’ behavior in periods of uncertainty.
US Dollar Index
Long-Term View: First, let’s take a look at the big picture. As you can see in weekly chart below, in 2014 and after the significant impulse move from 79 level, a clear bullish consolidation (continuation) pattern has been developing (and even completed). From T.A. point of view, It was clear that the Dollar is gaining momentum for its next rally (which might have already begun).
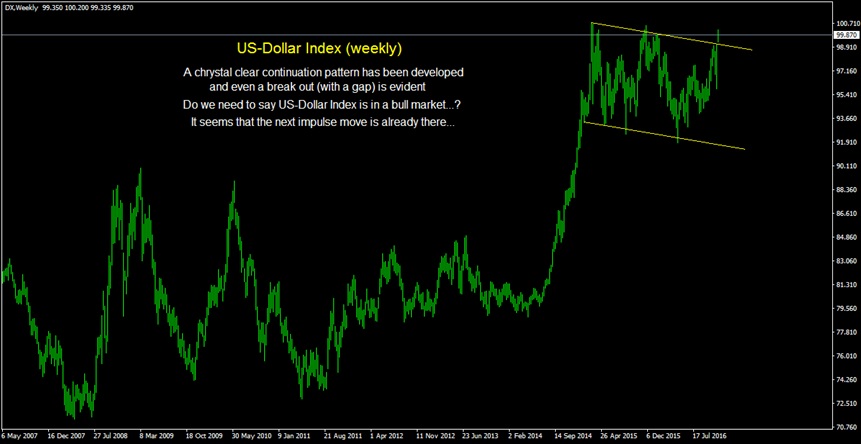
US-Dollar Index (Weekly Chart)
A Textbook Bullish Consolidation (Continuation) Pattern
Election Period: As we established in previous paragraphs, since February 2015, the Dollar has been trapped in a channel moving between 90 and 100. Moreover, with elections ahead it was about time for the world’s reserve currency to reveal its metal. A clear bullish consolidation pattern (equidistant channel) had already been developed (and almost completed) in US-Dollar index weekly chart. Any technical analyst would say that another rally is imminent. Now, let’s focus on the price action within this channel to see if we can find any kind of confirmation.
During mid-summer, a nice inverted Head & Shoulders pattern appeared in US-Dollar Index daily chart, while gold was consolidating above $1,300. Not surprisingly, the break out occurred on October 4th when the Dollar subsequently soared. Back then, Trump campaign was in trouble and Hillary’s victory seemed a certainty. Therefore, nobody was surprised to see US Dollar index breaking out of its H&S pattern to reach the target (and beyond) until FBI Comey’s announcement changed everything. Then the US Dollar reversed…and now it was time for gold to soar. While everybody was following this news, it was interesting to note that the reversal in US Dollar occurred exactly on the channel’s main trend-line (upper red line).
Trump’s victory had become a real possibility for the first time when Comey stepped in again with his second announcement to clear Hillary from potential charges. Naturally, the dollar reversed on this new development and interestingly enough for technical analysts, it bounced after testing the H&S break-out level. The dollar has kept rising in such a strong move that even the huge surprise of Trump’s victory could not diminish its momentum. The US Dollar is in a rally now - and it seems that it has freed itself out of the consolidation channel. Consequently, it is a nice text-book break-out. You can see a long bullish candle with a sizable opening gap in the daily chart at Break-out level. It’s there. How about that for a surprise…?!!!
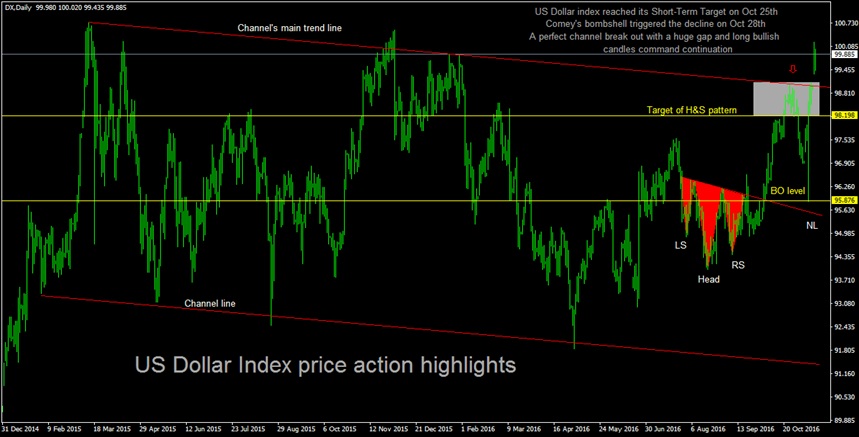
US Dollar Index Daily Chart
So it seems that we are at early stages of a new rally in US Dollar Index…
(Warning: Although everything is pointing to that conclusion, do not rush into conclusion too soon; as it is critical to wait for more confirmations)
Now wait a minute…
I know that US Dollar nicely followed technical analysis predictions…but come on, Trump has won…
Wasn’t Dollar supposed to fall now that Trump has been elected…?
Why are the markets acting like Hillary had won…?
Don’t you think this is an isolated incident…?
Why don’t you talk about other markets…?
Gold must have been skyrocketed to the ionosphere, right…?
OK Let’s see how gold reacted to the events.
(Note: I always use XAU/USD for analyzing gold, it works for me)
Gold
After a considerable number of attempts to break up above the long-term downtrend in summer, gold bulls had to give up and with elections coming. To be sure a deeper correction seemed more imminent. On October 4th gold dropped below $1,300 (the very same day the US Dollar broke out of its H&S pattern) and reached $1,250 three days later. Of course many traders looked at this development as a buying opportunity -and they were right. After all, $1,250 was the 38.2% Fibonacci Retracement level of “the new rally”. Besides, nothing was supposed to change; Hillary was not going to scramble the scene and gold was in a bull market after those dreadful years. Therefore, this had to be a correction, right…?
$1,250 was a Potential Reversal Zone - and it seemed to work well for those buyers who entered the market at that point. Then Comey came just in the right moment…and soon gold reached $1,300 level where it faced resistance. At this time, Comey’s second announcement reversed the gold price (just two days before the election). But when you look at it from technical analysis point of view, gold had bounced from 38.2% Fibo Retracement level - and was actually testing the triangle break out level. This was nothing a technical analyst did not expect, even without Comey’s surprise.
Election day was finally there. Subsequently, when the results began to surface, everyone was in total shock. Yes, Trump won and gold soared to $1,338 as it should, a freaking 6% rise in a matter of hours. However, it was far from over. Subsequently, the rally lost steam right after touching the very exact trend-line which had stopped gold from rising so many times before. Then gold dropped so hard that it closed below the daily open…and has even reached $1,214 (50% Fibo Retracement level) on Friday November 11th. Now how about that for technical analysis accuracy…?!!!
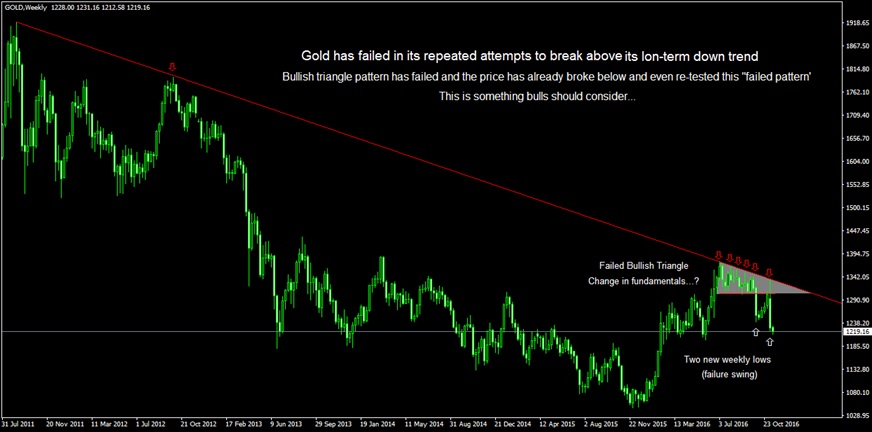
Gold Weekly Chart And The Down Trend Resistance
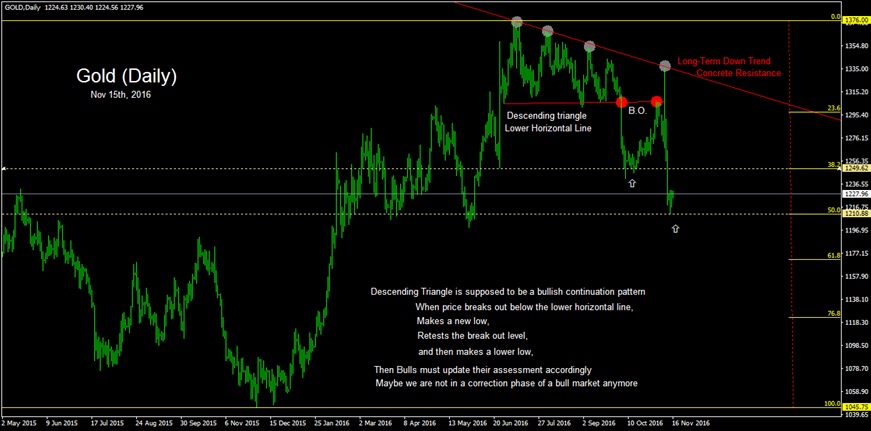
Gold Daily Chart And The Price Action During Recent Months
Conclusion
I sympathize with those who believe that markets’ behavior have been unpredictable…especially after the election of Trump. But if you were a dedicated technical analyst like myself, none of these price movements should have caught you off-guard. The US Dollar Index has already been a strong bull market - and it was in the final stage of completing an even more clear consolidation (continuation) pattern. Why should any trader be surprised now that US Dollar has begun to rally…and continue its well-established up-trend…?
On the other side of the markets, gold has been in a five year down-trend. Moreover, this extra-valid trend line has consistently stopped gold price from rising. Especially during 2016. To be sure it has been tested six times on the roll and has never allowed price to go beyond this concrete sealing. So why should you be surprised if it did the same and also confirmed the price movements of the al-mighty US Dollar index …? Furthermore, a failure swing in the gold price confirms the fact that maybe we are not in a gold bull market…and the dreadful down-trend might still be in charge…
I am confident that in the future, technical analysts and investing gurus will issue numerous articles and reports about “lessons to be learned from 2016 US Presidential Election”. But in my opinion, all we have to learn is to change the way we look at technical analysis in our investing process. It is more than just paintings on the charts; It can provide you with the wisdom which cannot be found anywhere else…

Ramin Kondori is a recognized Markets Technical Analyst from Iran. He is an IUT graduate in Civil Engineering and holds PG-Diploma in Welding Engineering. Since 1993, his fascination with gold and stock markets has led him to undertaking intensive studies and trading, parallel to his engineering business in the oil and gas industry. He also manages separately managed accounts for individual clients and is dedicated to helping investors boost their investment performance. Being a Quality Management professional, he has adopted a set of his own Investment Quality Assurance And Control Principles, which have proved to perform satisfactory results in the extremely risky financial markets of Iran.


