Lifeless Gold Price Falls Outta Bed


Opening note: with respect to the above Gold Scoreboard we've upgraded the line colours to make them more visibly distinct, the thrust of the overall picture rather cynically showing us that Gold's price these past few years hasn't materially gone anywhere in spite of the ongoing proliferation of foundationless fluff, (i.e. Dollars). A tip of the cap to valued reader LdK.
As for lifeless Gold, price this past week became so flat-lined, indeed stuck in and just below "Neverland", (aka "The Whiny 1290s"), that the narrow trading range for the week's first full four days of only 10 points was less than Thursday's EDTR ("expected daily trading range") of 11 points. That's quintessentially lifeless.
Then come Friday (yesterday), lifeless Gold fell from its bed smack onto the top of The Box (1240-1280), settling out the week at 1281. With 13 trading days -- that's already 5% of the entire trading year (it goes fast, eh?) -- already in the books, not only has Gold spent a portion of each one in The Whiny 1290s, but moreover through these first three weeks of 2019, Gold's net changes have respectively been +3 points, +2 points and -7 points. Price is thus down a wee skosh year-to-date. Never to escape Neverland: been there, done that, and here we go all over again. 'Tis like a bad dream as we turn to Gold's weekly bars wherein lower highs are now creeping into the present picture:

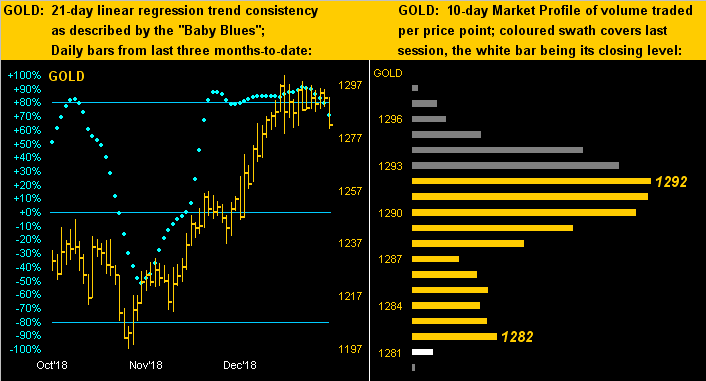
So 'tis back into The Box for a bit? If you follow the website's daily Prescient Commentary (or Gold page or Market Trends page), you're already aware that Gold's "Baby Blues" -- a measure of linear regression trend consistency -- have started breaking down as we see below left across the last 21 trading days (one month). Thus amongst yesterday's end-of-day BEGOS Markets reports came the panel below right:
'Course, Gold does have a hankerin' to go quiet when all is right with the world. Take for example the StateSide "partial" government shutdown for "non-essential" workers. It began effective 22 December, the S&P 500 Index having settled the night before at 2417: now 'tis 2670, an increase of 10% shutdown-to-date. Kinda like when a private sector company cleans house, earnings improve. Welcome to real life.
"But actually Gold is up too, mmb."
'Tis true, Squire, by not quite 2% for the shutdown stint. Beyond Gold's ultimate drivers -- i.e. the 3Ds of Debasement, Debt and Derivatives -- other Gold-supportive issues abound. For example with respect to interest rate rises, Chicago Federal Reserve Bank President Charles Evans yesterday put it to Bloomy TV quite eloquently: "We’re just at a good point for sort of pausing." But what really caught our eye earlier in the week was this Uh-Oh: "S&P/Experian Consumer Credit Default Indices show higher default rates for all loan types in December 2018." As well, the brutal boffing of Brexit ought bode well for Gold as the European Union maintains its behemothic bureaucracy. Then most telling is the Economic Barometer:
To be sure, the Baro did have a few positive inputs this past week: January index readings improved from both the Philly Fed and National Association of Home Builders along with December's Capacity Utilization ticking higher. But ignore thee not these negatives: for January, the New York State Empire Index and University of Michigan Sentiment Survey both severely slowed, as did Industrial Production for December, that month's core Export Prices and Producer Prices coming in as deflationary. Note above as well the rising S&P versus the falling Econ Baro: shan't last, never does.
In fact, let's take a quick peek at the S&P. Despite its recent gelandesprung, we're maintaining our 27% correction call from 2940 (22 September) to 2154 (a pre-2016 Presidential Election support point). As we've previously noted, 75% of said correction has already come to pass (down to 2347 on 26 December). Now at 2670, 'twould appear a Golden Ratio upside retracement to 2719 is nearly complete before the Index goes back over the cliff toward our target of 2154. Here's the visual with those key levels as noted:
And for all the excitement -- or lack thereof -- over the recent rebound in the S&P is the lack of moneyflow associated with the up move. Here from three months ago-to-date is the difference between the points change in the S&P versus its moneyflow regressed into S&P points. Think the S&P ought thus be 400 points lower than presently? That what's this graphic suggests:
As for the S&P's price/earnings ratio, Bob Shiller's "CAPE" for the S&P is 29.4x and our "live" (based on actual earnings) PE is 38.8x. But then in the wee hours of Friday morning came an analyst's voice from the bedside radio putting the PE at 14x-16x: 'course, that's based on earnings that haven't yet happened. And to get from 38x down to 16x meanings actual earnings must double. Are they? For the 24 S&P 500 companies having thus far reported in Q4 Earnings Season, the median improvement (and this includes the corporate tax cut effect) from the like period in 2017 is only +15% ... not +100% ... no net dough, no moneyflow, look out below!
In moving on with the precious metals (were that only the case), we earlier showed Gold's daily bars and "Baby Blues" from a month ago-to-date along with that attendant "sell" signal. Now at lower left is the picture for the past three months and the 10-day Market Profile at lower right. Should further selling in Gold ensue, there is structural support within The Box (1240-1280) at 1270, 1255 and 1247. Meanwhile, price barely appears at the base of the Profile:
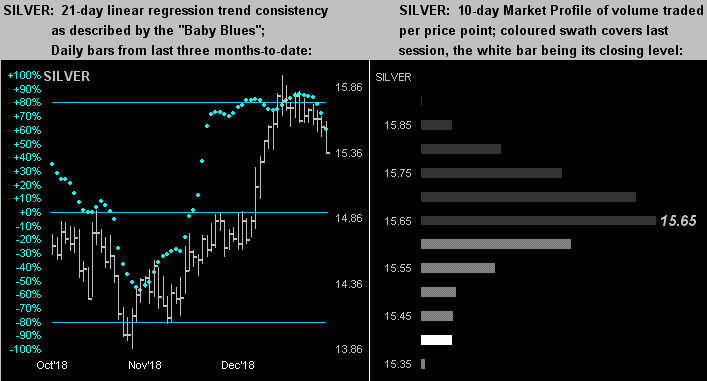
And then there's Sister Silver, (who earlier in the week also posted a "sell" in her signals cell), her "Baby Blues" (left) also accelerating lower with price buried at Profile's bottom (right). That doesn't do much for the Gold/Silver ratio which as noted above is at present 83.4x. Given it being that high for this long (now +80x for five full months) the millennium-to-date average itself has risen a full point from where 'twas a year ago at 62.9x to 63.9x today. Still, put to the current average, Silver now would be 20.05 rather than 15.36:
In closing, our local power utility, Pacific Gas and Electric Company, is going into bankruptcy. Thus our being sensitive that the lights may go out at any second, we'll try to squeeze in this closing quip per data compiled each week for our opening Gold Scoreboard. The U.S. money supply (per "M2") at this time a year ago was $13,852,500,000,000. Today 'tis $14,533,900,000,000 ... that's a year-over-year increase of $681,400,000,000. The budget for the so-called "Wall" is $5,600,000,000: thus in just one year there's been enough Dollar Debasement to budget 121 "Walls". Another day, another dollar, or as goes the tune "All in all you're just another brick in the wall..."--(Pink Floyd, '79). Instead, hopefully you're gathering your own supply of bricks: Gold bricks!

Mark Mead Baillie has had an extensive business career beginning in banking and financial services for two years with Banque Nationale de Paris to corporate research for three years at Barclays Bank and then for six years as an analyst and corporate lender with Société Générale.
For the last 22 years he has expanded his financial expertise by creating his own financial services company, de Meadville International, which comprehensively follows his BEGOS complex of markets (Bond/Euro/Gold/Oil/S&P) and the trading of the futures therein. He is recognized within the financial community of demonstrating creative technical skills that surpass industry standards toward making highly informed market assessments and his work is featured in Merrill Lynch Wealth Management client presentations. He has adapted such skills into becoming the popular author each week of the prolific “The Gold Update” and is known in the financial website community as “mmb” and “deMeadville”.
Mr. Baillie holds a BS in Business from the University of Southern California and an MBA in Finance from Golden Gate University.


