Looking Into Gold’s Future With The Japanese Crystal Ball


In today’s globalized economy no market can move entirely on its own. They are all connected in one way or another. But not all links are equal – some are barely noticeable, while others are so strong that it’s impossible to dismiss them. In case of the gold market, there are many connections with other markets, but the relationship with the Japanese yen is one of the strongest. And at this time, the implication that the currency has for the gold market, is also one of the most important ones.
Since they both move in tandem, if something major is likely to happen in one of them, it’s very likely that it will also happen in the other. The reason why we are discussing all this is that something very important has recently taken place in the Japanese currency (and we informed our subscribers a week ago), and something even more profound is likely to follow. The initial implications for gold have already played out, but it seems that the biggest shockwave remains to be seen.
So, what did the yen do?
It broke below an important support level. And then below another one. And then below a critical long-term support. And now it’s successfully verifying the breakdowns and each day makes the situation more and more critical.
Let’s take a look at the details (charts courtesy of http://stockcharts.com).
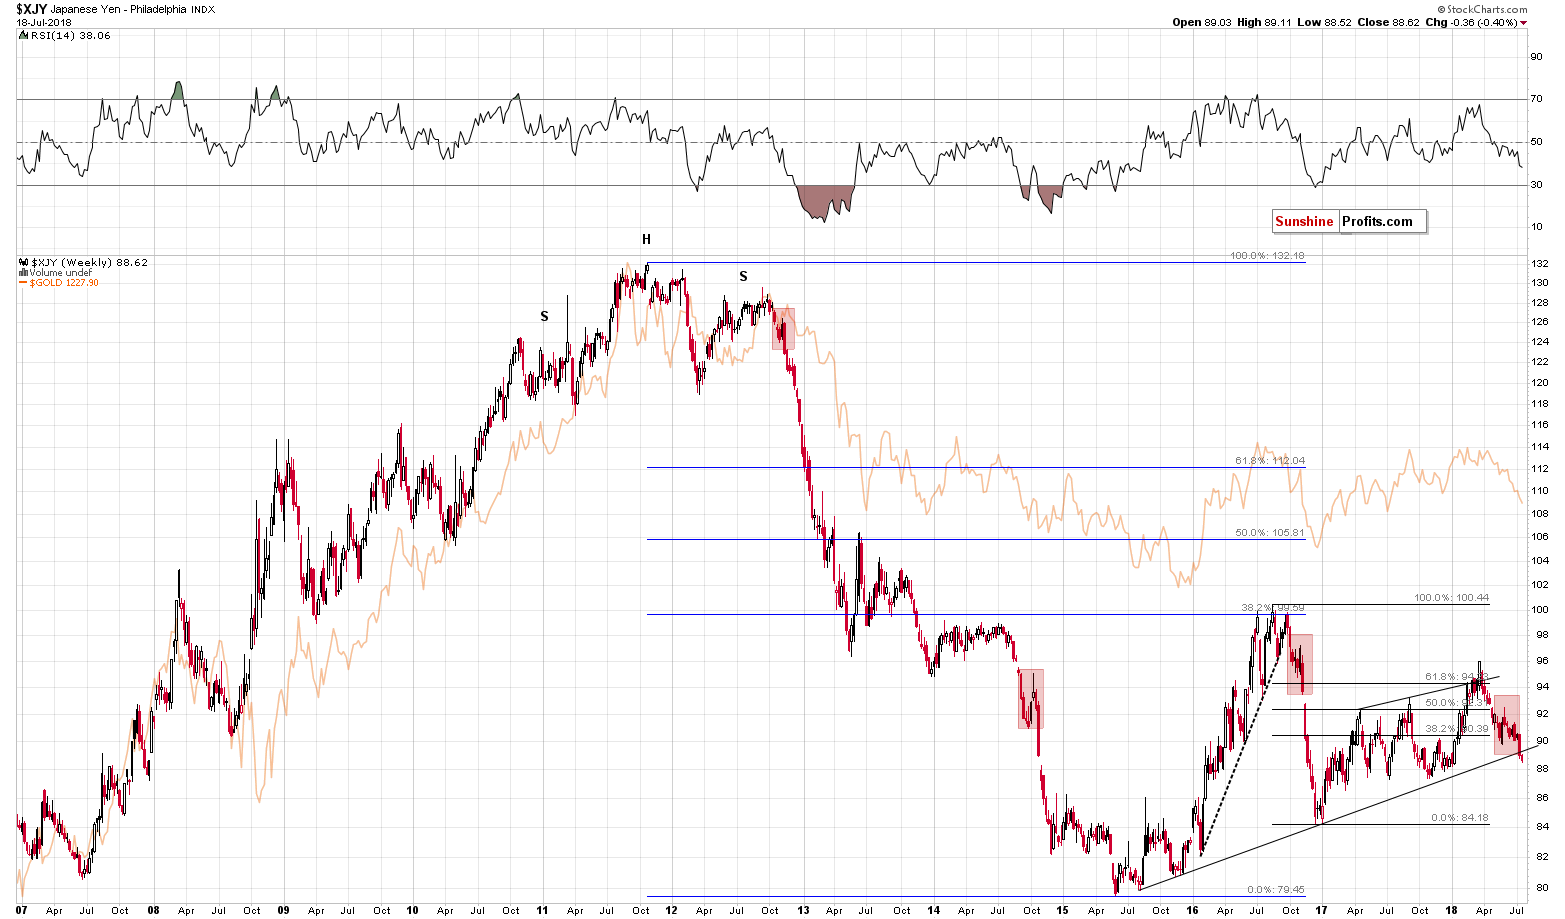
The first thing that one can see on the above chart is that gold and the yen move in near-perfect tune. Naturally, the moves are not 100% identical, but it is almost always the case that the medium-term moves are aligned. Therefore, while there may be short-term deviations, and very long-term ones (after all, gold could skyrocket in case of a geopolitical crisis and rally much more than the yen), the big, medium-term moves are extremely likely to be similar. They are also likely to take place at similar times.
Now, moving to the key development of the above chart, the Japanese yen just broke below its key long-term support line. Moreover, when viewing the currency while using the linear scale instead of a logarithmic one, this breakdown took place even sooner.
This is the most profound development on the long-term yen chart since the late-2016 breakdown. The results are clearly visible – a huge decline in the currency. And in gold.
There are multiple factors pointing to very bearish gold price predictions for the next few months and this breakdown is one of the most important ones. Naturally, all breakdowns need to be confirmed, before their implications are completely bearish and the breakdown in yen is no exception from this rule. But, let’s keep in mind that the currency is already after short- and medium-term breakdowns and their confirmations.
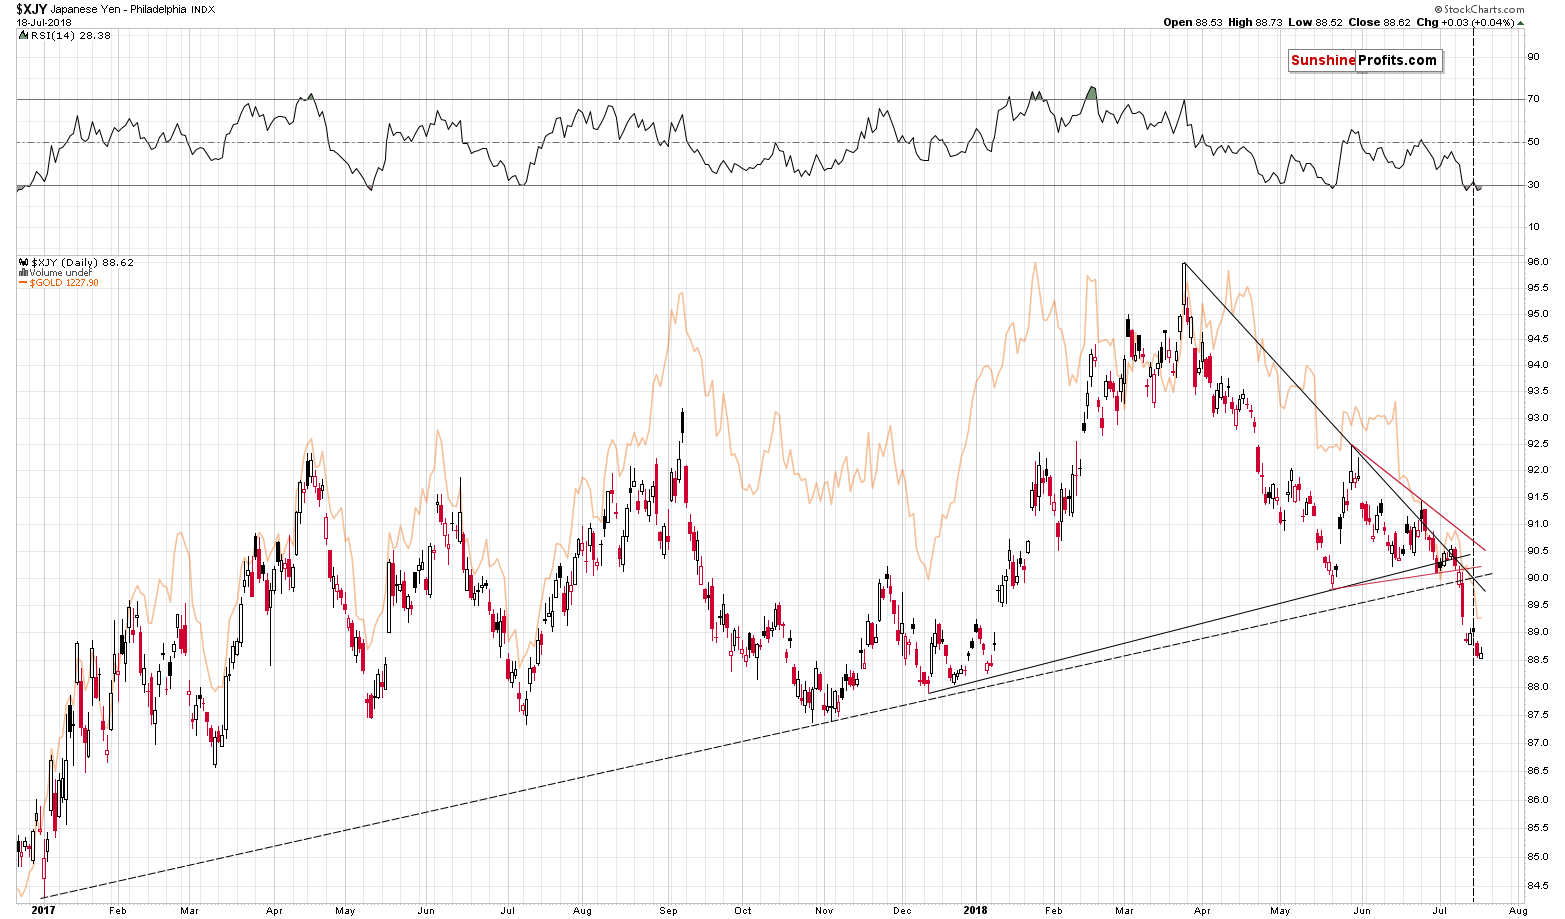
The breakdown below the red triangle is definitely confirmed and the same goes for the move below the rising dashed line. They are both confirmed by more than three consecutive trading closes below the previous support levels and by the size of the decline that followed the breakdowns
So, based on the short- and medium-term breakdowns, we are likely to see a full confirmation of the long-term breakdown. This makes the outlook already very bearish.
In fact, in a way, the long-term breakdown is already verified as we saw over three consecutive closes below it, but since the line that was broken is so profound, it might be more appropriate to wait for at least 2 weekly closes below this line before stating that the breakdown is indeed confirmed.
Let’s keep in mind that we recently saw a triangle-apex-based reversal, which may still trigger a corrective upswing. This is not very likely, but it may happen and if it does, there’s no need to be stressed about it – it would be a normal course of action.
Action that we think is best to be left ignored – i.e. we don’t think that adjusting the profitable short positions would be a good idea based on this factor alone (naturally if there are no signals from other important indicators). Why? Because of what happened after similar situations in the past. Please take one more look at the long-term Japanese yen chart. There were three similar cases to the very recent one and we marked them with red rectangles. All corrective upswings after these similar patterns were so tiny that they are practically invisible on the above chart. In all these cases it was much better to just hold on to a position than to try to time every correction. That’s what we plan to do in the near term with regard to our positions in the metals – unless something major happens we’ll likely stick to the short positions.
Summing up, the outlook for the precious metals sector was already extremely bearish before yen’s breakdown and based on the latter, it became even more bearish. The medium-term outlook is so bearish that it’s becoming problematic to write about it – there are not many words that can be used to further increase the intensity beyond the word “extreme”. Naturally, the short-term outlook may change, just like it did in late June, but betting on the corrective upswing may be difficult, as the signals that work in most cases (like the RSI), may not work in this environment.
We hope that you enjoyed the above analysis. If you’d like to receive follow-ups, we invite you to sign up to our gold newsletter. You’ll receive our articles for free (plus some extra details not available elsewhere) and if you don’t like them, you can unsubscribe in just a few seconds. Sign me up!
Przemyslaw Radomski, CFA
Founder, Editor-in-chief, Gold & Silver Fund Manager
Sunshine Profits - Gold & Silver Investment
* * * * *
All essays, research and information found above represent analyses and opinions of Przemyslaw Radomski, CFA and Sunshine Profits' associates only. As such, it may prove wrong and be a subject to change without notice. Opinions and analyses were based on data available to authors of respective essays at the time of writing. Although the information provided above is based on careful research and sources that are believed to be accurate, Przemyslaw Radomski, CFA and his associates do not guarantee the accuracy or thoroughness of the data or information reported. The opinions published above are neither an offer nor a recommendation to purchase or sell any securities. Mr. Radomski is not a Registered Securities Advisor. By reading Przemyslaw Radomski's, CFA reports you fully agree that he will not be held responsible or liable for any decisions you make regarding any information provided in these reports. Investing, trading and speculation in any financial markets may involve high risk of loss. Przemyslaw Radomski, CFA, Sunshine Profits' employees and affiliates as well as members of their families may have a short or long position in any securities, including those mentioned in any of the reports or essays, and may make additional purchases and/or sales of those securities without notice.
 Przemyslaw Radomski, CFA, is the founder, owner and the main editor of SunshineProfits.com. You can reach Przemyslaw at: http://www.sunshineprofits.com/help/contact-us/.


