Market Dynamics And The DJIA


Consider the hypothesis that, all things being equal, a price will maintain its ruling trend indefinitely. This is irrespective whether the trend is up or down or sideways, or steep or shallow. Since we know prices changes are determined by the ratio of supply to demand, it implies the ratio tends to remain relatively constant over time, as real and potential buyers and sellers continue to react as they have been doing for some time. Temporary changes in the ratio causing temporary deviations from the main trend. When the ratio undergoes a significant change, the trend changes. For fifteen months, the ratio of supply to demand on Wall Street have remained much the same, resulting in a very steep sustained trend. Now this has changed.
For a rising trend to top out, supply must increase substantially relative to demand. For a falling trend to bottom out, demand must increase relative to supply. When a price is constantly bullish, it is easy to deduce that demand is consistently greater than supply. It also follows that sellers are retreating before the increasing price, holding back, so that during the rising trend turnover is relatively low. Similarly, in a sustained bear trend, most potential buyers are retreating all the time and again turnover is low for the duration of the trend. This is so obvious and logical for all normal market behaviour it seems near impossible that a market can consistently increase in a steep trend for all of 14 months while weekly turnover has remained almost doubled from what it had been previously for many years.
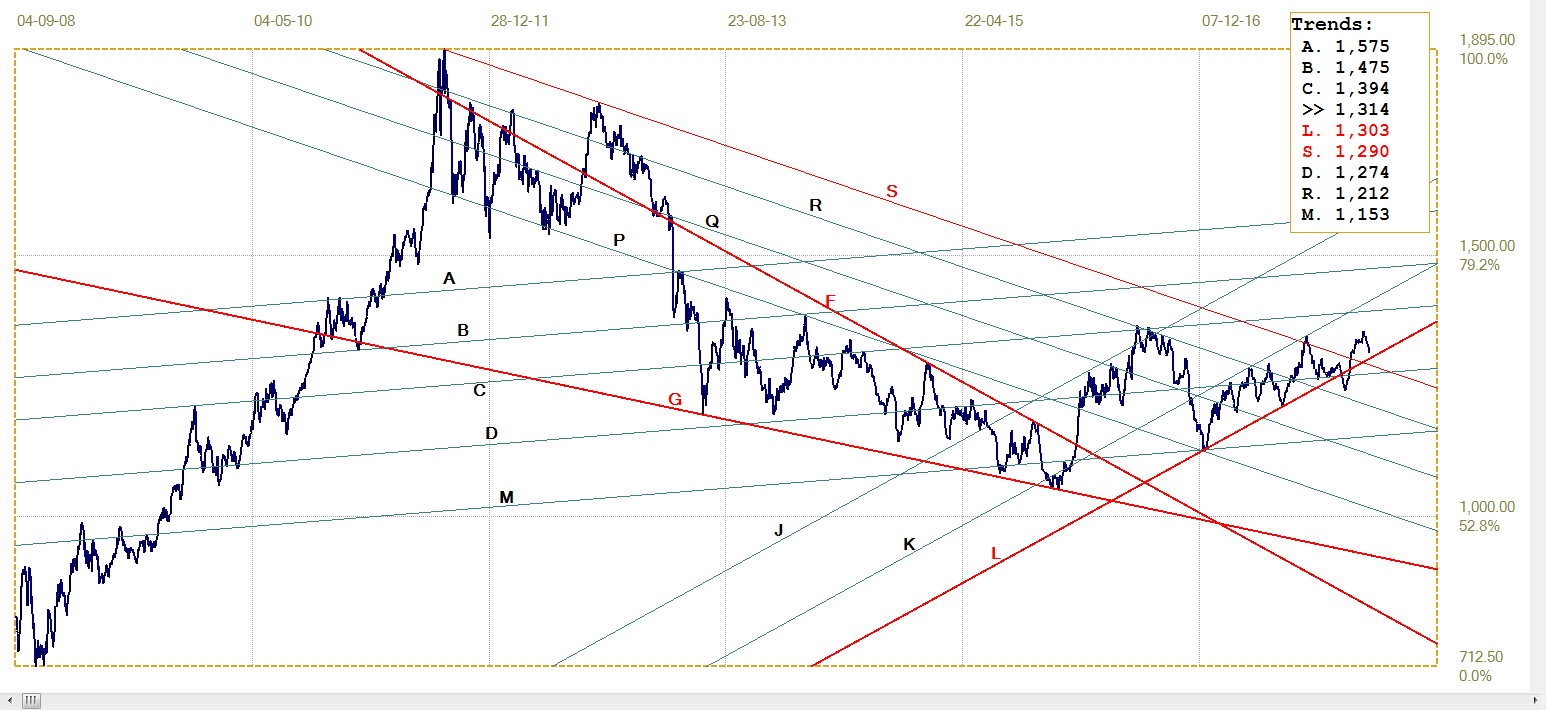
As a sustained trend changes, either to reverse or level off, it does so because the ratio of supply changed, which means an increase in turnover, often starting before the actual change in the trend occurs. Observe in the chart of the DJIA below the very high turnover at the time of the end of the 2008/9 bear market.
In late September of 2008 panic hit Wall Street; early sellers found lots of bargain hunters to take up supply, at steeply lower prices. By October the market settled and turnover dropped, but renewed selling early in 2009 had prices falling again, also on increasing turnover presumably from bargain hunters. In mid-February the volume jumped even higher and the bear trend reach its bottom, which it held into March. After September 9, on news of the Fed’s massive rescue, a new bull market started, still on high turnover from sellers glad to get out above the market bottom.
One has to wonder whether the sudden large jump in turnover three weeks before the news might have been because a few privileged institutions had heard whispers of what was going to happen and exploited the panic.
The +-cursor on the chart shows where volume immediately after the election almost doubled, to remain elevated for the past 14 months. Before that, we had a market drifting mostly sideways for months because supply and demand were quite evenly balanced. Out of the blue, volume nearly doubled and remained so while the price continued to rally steeply.
Consistently very high volume in a bull market means there is sustained heavy selling and profit taking; which one hand is not surprising. Frustrated investors use the opportunity to sell at a profit. However, to keep on selling at that rate for 14 months? Don’t they react to what is happening and hold back for higher prices as normally happens during bull markets? Very strange behaviour for a free market.
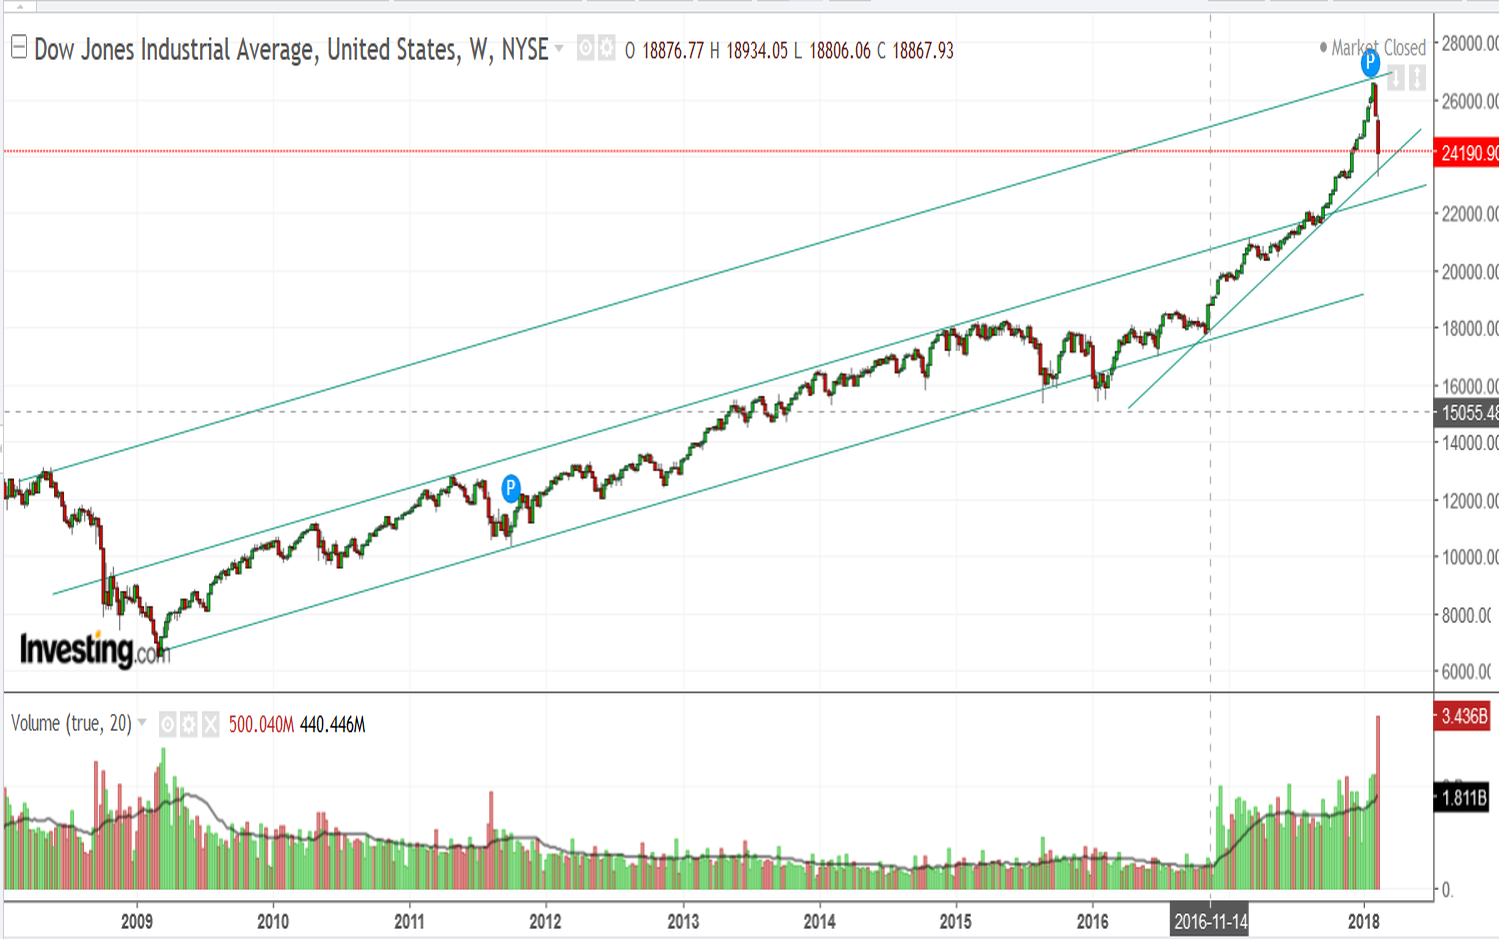
DJIA Weekly (Investing.com)
Of course, given the evidence of sustained selling, for the price to continue higher at the steep rate of the past 14 months, there had to have been a larger increase in demand. Given the great divide in sentiment of Americans after the Trump election, this conceivably might explain the massive investment of funds in a Trump future for the US, enough to more than absorb the volume of selling week after week.
So what are the sources of a massive inflow of presumably new funds looking to get a share of the raging bull? Liquidity should be high from all the QE that had been going on, and Wall Street offers the only game in town that consistently delivers returns above that of the anemic bond market. But why so suddenly after the 2016 election when QE had been going on for a long time? Granted, investment in funds and EFTs that follow the indices have become so popular, but fads grow gradually, not overnight. It is difficult not to become a conspiracy theorist to try and explain the strange behaviour of the DJIA and Wall Street since the election.
The intra-day chart of the DJIA below is of last Thursday, when the DJIA plunged to end about 1000 points down. Observe the big boost in turnover near midday, when the decline was temporarily halted. Clearly an attempt by some party or parties to halt the slide. The question is whether it is only a few parties (one?) large enough to affect the DJIA on a very busy day, or is it that a large number of smaller market players suddenly realised all at the same time that they have to boost the market, only to slack off again soon after they had achieved the desired reaction? What, no follow through on their success?
However, the really interesting part is what happened later the afternoon. A similar but much more extreme and sustained inflow of buyer funds as what happened near midday, this time had little effect on the price; the slide continued and became steeper. Reserves had to be called into action, yet even as buyer support reached a crescendo, the price continued to fall at a steeper rate. Real panic had set in.
As could have been expected, Friday morning saw the panic continue to take the DJIA down about 500 points. Then Wall Street turned on a dime, to show a gain of 300 points by the close. Unfortunately, CNN’s DJIA chart lost its ability to display any chart shorter than a period of five days, so there is no intra-day chart of what happened on Friday. But from what had happened it is clear that the buying on Friday must have exceeded what was done late on Thursday. Statistics on the CNN page shows Friday’s turnover was more than 733 million Dow 30 shares, compared to the already high 3 months average of about 377 million shares per trading day.
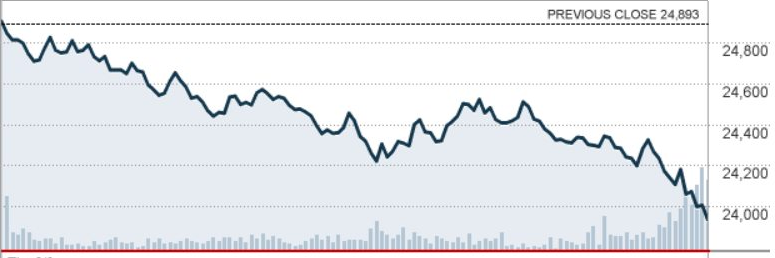
DJIA Thursday 8th February (CNN)
The top chart also shows the tallest volume spike last week for the past 9 years; 3.44 billion shares at an average of almost 500 million shares per day, compared to a weekly average of 1.81 billion shares per week. Whoever have been responsible for pushing the bull higher during the past 14 months on Friday seemingly pulled out all the stops to make sure this nonsense of the past week does not begin a bear trend. The question is who are they really and what is their motive?
The possible motives are firstly, a mad rush by investors with cash on hand to join the bull, given that prices had fallen by so much the past week; alternatively It can be parties already heavily invested in Wall Street, who went full out to protect their investments, such as funds of all kinds who number more than the shares listed on the NYSE. The third alternative is the conspiracy one – that there are covert powers that be that seek a political advantage from a bullish Wall Street. Or it could be a providential if probably uncoordinated coalition of all three.
Its good and well to review history and the present in this regard; but what about the future? The reasonableness of the bull market is like pudding; the proof of it is in the eating; for Wall Street that means the market has to return to acceptable PE ratios, but not do so by a new bear trend while earnings remain the same. We will have to wait for the rest of 2018 to inform us if much higher earnings are coming.
Much of the attraction of Wall Street is a steep 14 month bull market. It the trend does not resume, to reveal the Bull is actually vulnerable, how long before profit taking becomes the new fad and opens the door for the Big Bad Bear to take hold,? Interesting times ahead!
Euro-Dollar
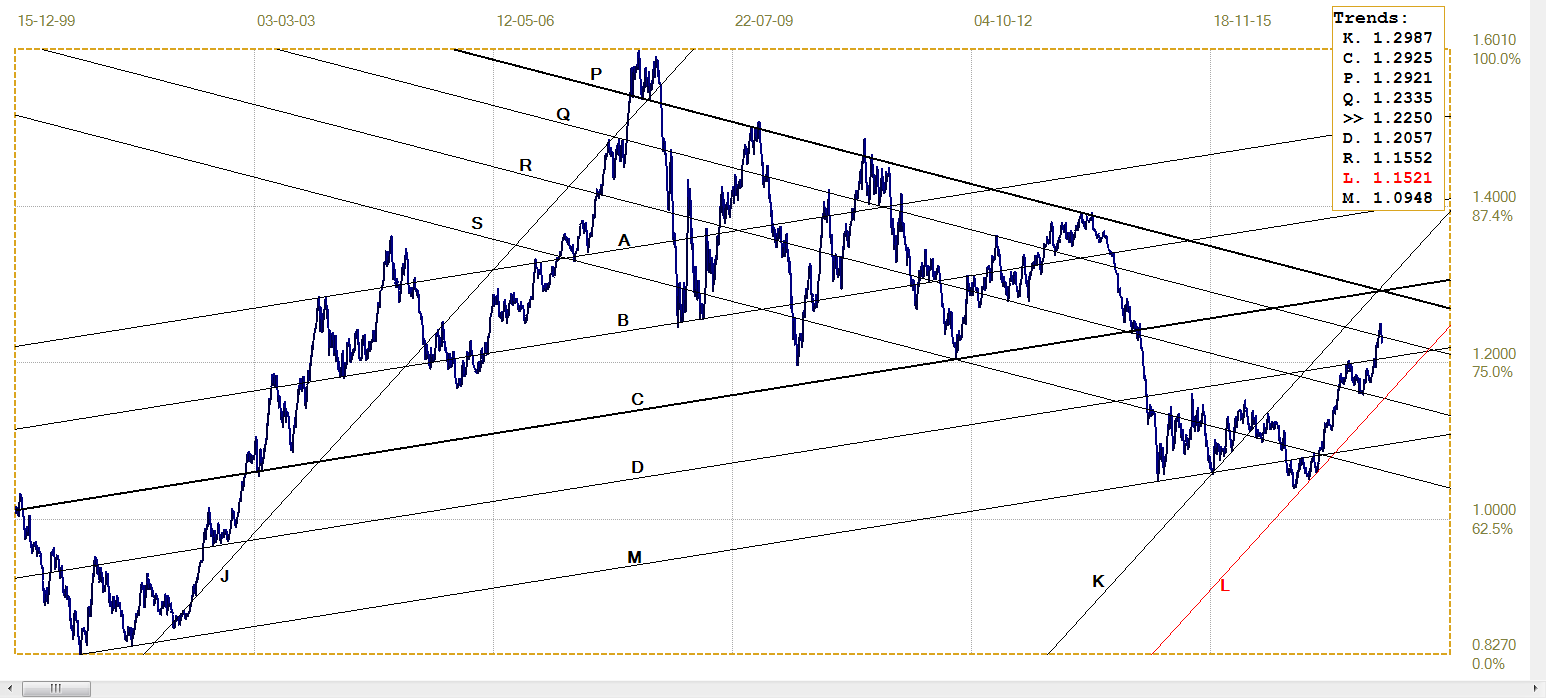
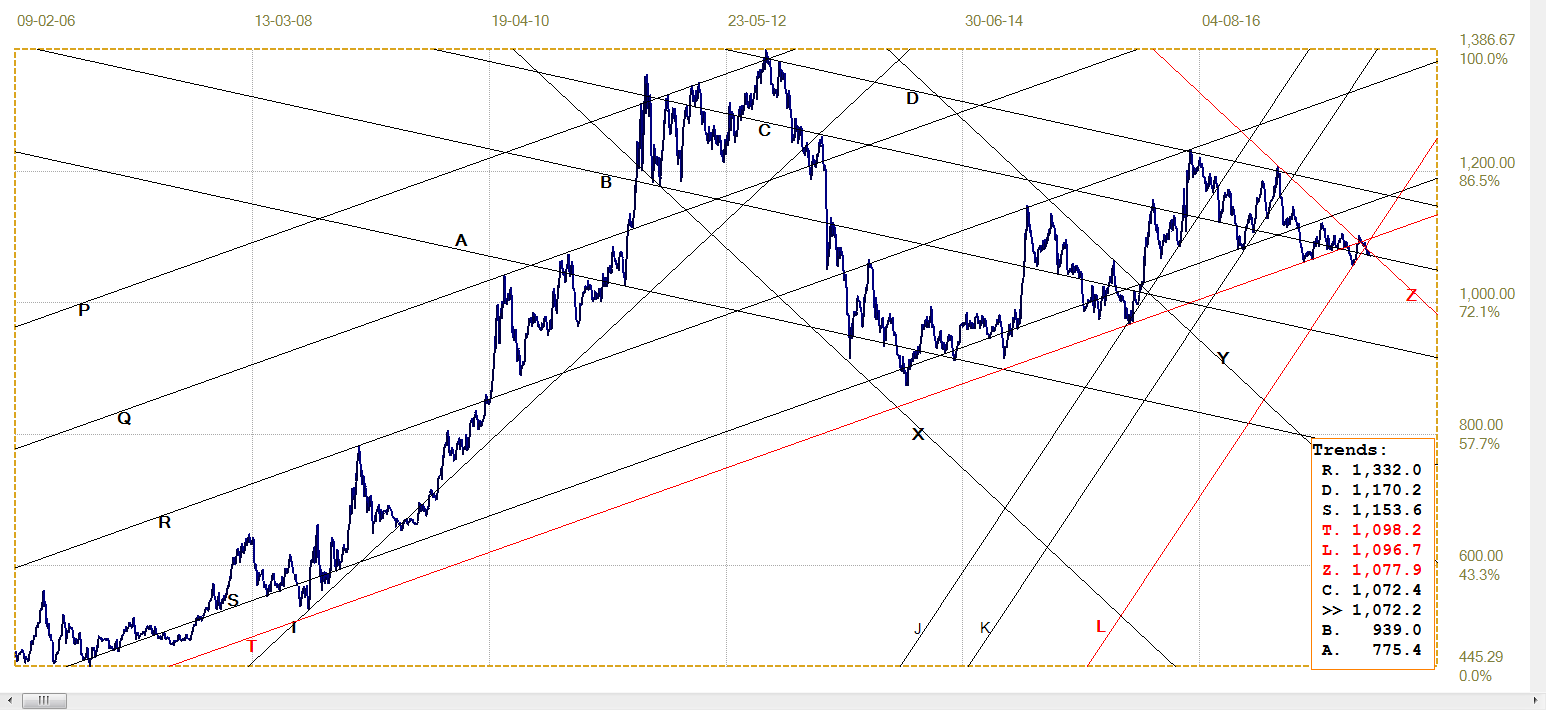
Euro-dollar, last = $1.2250 (www.investing.com)
Last week, the euro again stumbled. The dollar firmed against most currencies, but remained softer against the yen. Its rally within bull channel KL ($1.1521) is still intact, but the support along line Q ($1.2335) gave way as the euro slipped lower. Further weakness in the euro is a possibility, now that line Q is no longer offering support. Last week it was written that a definite break below line Q would confirm a stronger dollar for the near term at least, but with more bullish potential for the euro later, as long as channel KL holds.
DJIA
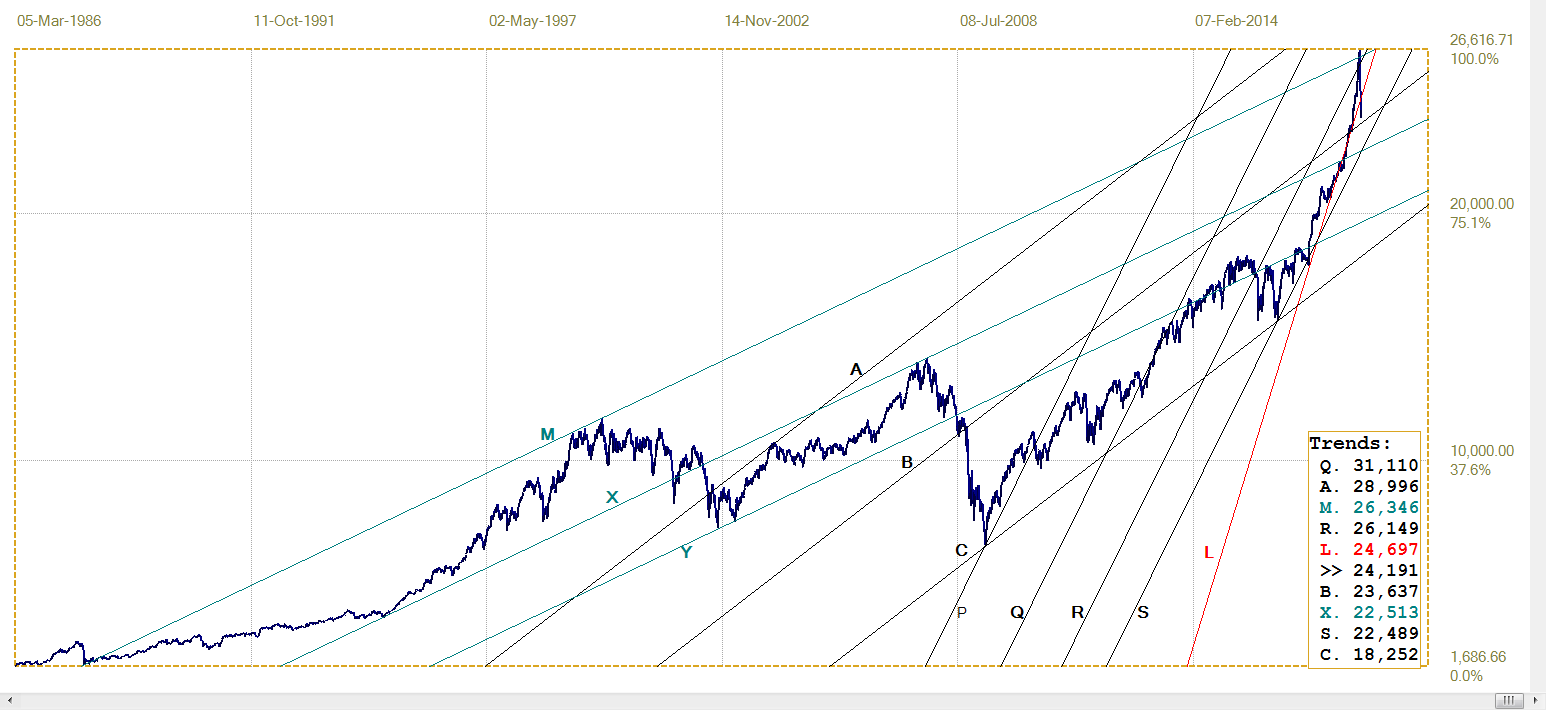
DJIA, last = 24190.90 (money.cnn.com)
After the high volatility of the past week, the DJIA has broken below the support of the very steep trend line L (24 697) to end not far from support of line B (23 637). It would surprise if there is not a flood of redemptions out of index following funds and ETFs and others from investors who want to lock in whatever profit they have made before, like Bitcoin, prices fall steeply. Given the flood of buying among the Dow 30 shares, when the DJIA looks vulnerable during the late part of the trading day’s session, it seems more likely that there will be enough bullish support to keep the Bear at bay, at least for the near term.
Gold PM Fix - Dollars
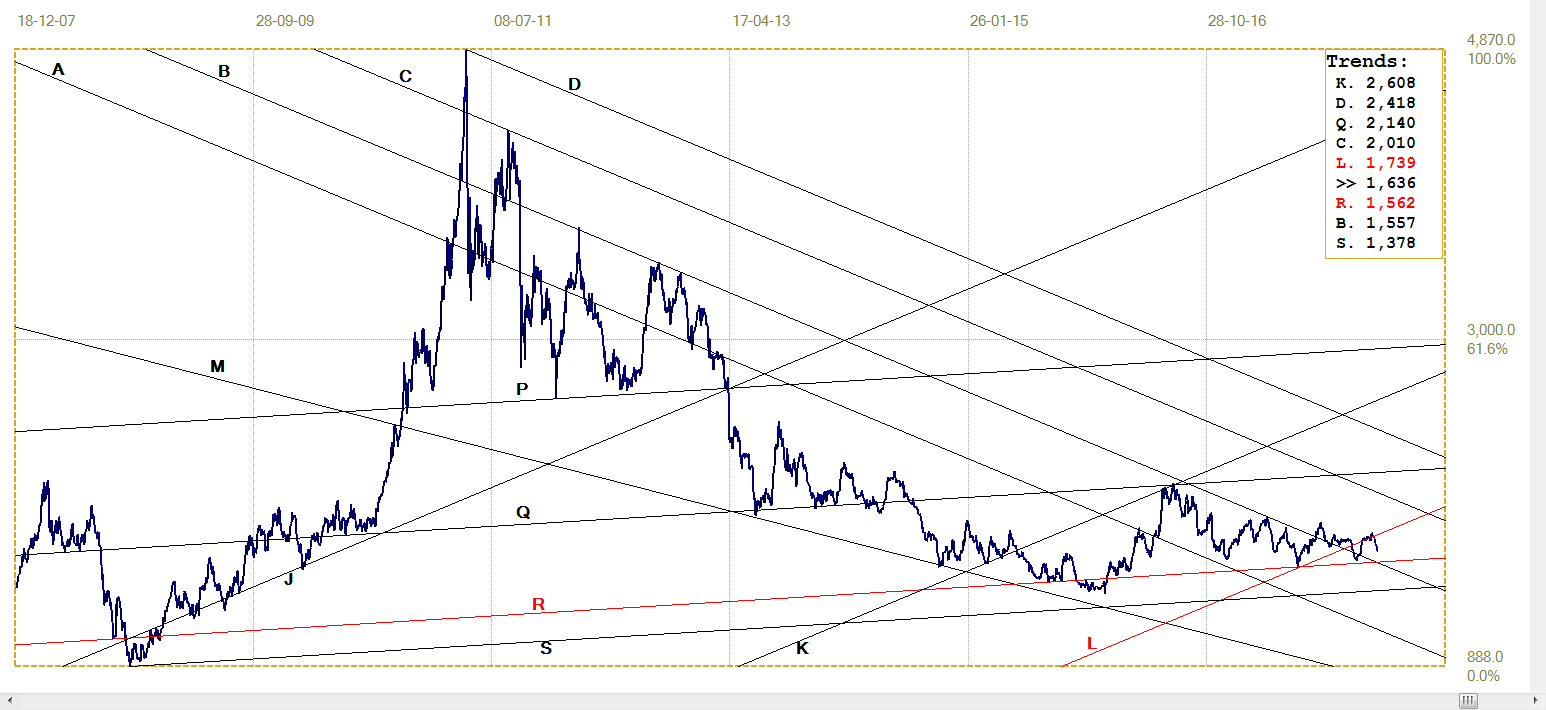
Gold is still being slammed down a week after NFP, revealing greater determination to keep the price under pressure than what has become ‘normal’ in a strange world. At least, so far, the support at line L ($1303) is still intact. Could increased selling be an indication that the end time of price suppression is approaching?
Gold price – London PM fix, last = $1314.10 (www.kitco.com )
Euro-Gold PM Fix
Euro Gold Price – PM Fix In Euro, Last = €1072.2 (www.kitco.com)
There are reports that survivors of Bitcoin, at least those that bought into it at an early time, have been placing at least some of their massive profits into gold as an affirmation that the crypto-currency is not a long term store of value and that this is particularly prevalent in Europe. Now these new investors are hoping that either the price of gold increase markedly or that the euro (or sterling) turns weaker, or both, to ensure that their new investment does not repeat the recent behaviour of the one that brought them their wealth.
The situation has been fairly static for the past two weeks; there is still support to act as a springboard to launch a new rally for the euro price of gold, which is more likely to be triggered by a stronger price of gold than by a weaker euro.
Silver Daily London Fix
Silver daily London fix, last = $16.355 (www.kitco.com)
After holding along the support of line L for a good while, the NFP associated selling pressure became too much and the silver price dipped lower. Last week, very much against expectations seeing that NFP was history, the pressure intensified, to send the silver price well below $17.
As mentioned in the discussion of the gold price, February starts off differently from most preceding months in that the selling pressure intensified instead of it slacking off when the usual nonsense that is associated with the beginning of the month was over and done with. Something is changing, and one possibility is, as mentioned in the gold discussion, that the window that allows the use of Comex to control prices of the precious metals is closing.
While much of the focus is on the amount of gold moving from west to east, it may be interesting to know how much stockpiling is going on by industries that are very heavy users of silver given the constraints on fresh supply much of which is mined as a by-product by mines of base metals. Supply of silver from these mines, which is said to produce the bulk of annual new supply, is not likely to be very responsive to an increase in demand.
U.S. 10-year Treasury Note
The recent weakness in the US 10-year Treasury followed a very steep trajectory, almost like Wall Street. The steep increase in the yield along line L (2.759%) has reached a top right at line Q. A break higher, either immediately or later, to hold above line L, is likely to confirm a bear trend for Treasuries and by implication, for more rate increases by the Fed.
The number and frequency are of less relevance than what the longer term effect on the financial system and economy will be. And of course, on Wall Street should it by then still be in as rampant a mode as recently.
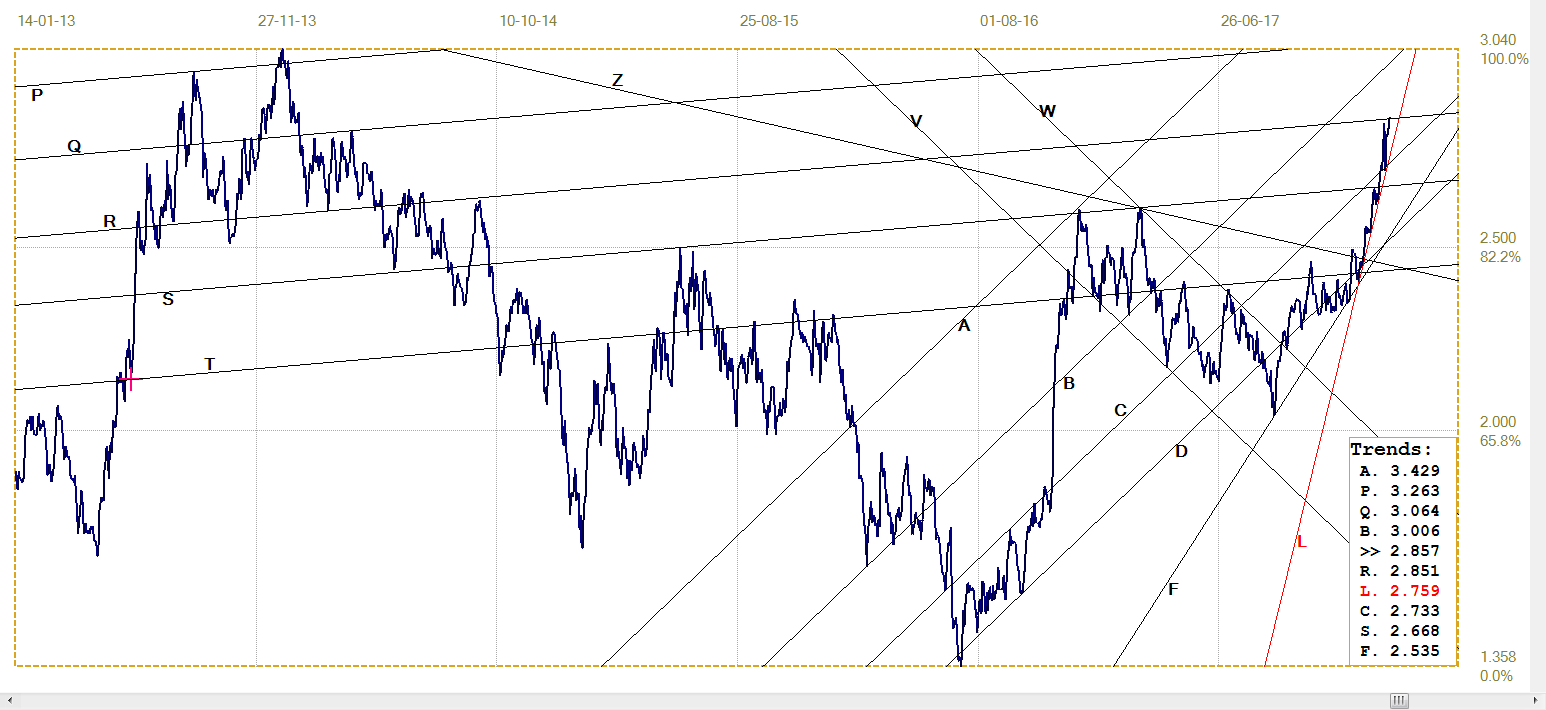
U.S. 10-year Treasury Note, Last = 2.857% (www.investing.com )
West Texas Intermediate Crude. Daily Close
While the yield on the 10-year Treasury is holding above its steep support line, the price of crude joined the DJIA in reversing trend and breaking below its own steep support trend line. The rally in price of crude first reached a stage of consolidation, or stagnation, and the loss of momentum has now manifested in a trend reversal that not only broke below the steep support of line F ($63.23), but also below the support of line R ($61.41).
The rally that had started off line L ($56.99), then accelerated away to hold above line F, gained ground in fits and starts. The price would rally and then spend some time in consolidation, as if the firm rally had come as a surprise that first has to be digested before the market can make another move. This time, the consolidation could not resume the trend and the reaction was steep and deep.
It now depends whether the support at lines C ($58.45) and L can hold to prepare for another rally, or whether crude has over-shot its value and the price must fall even more.
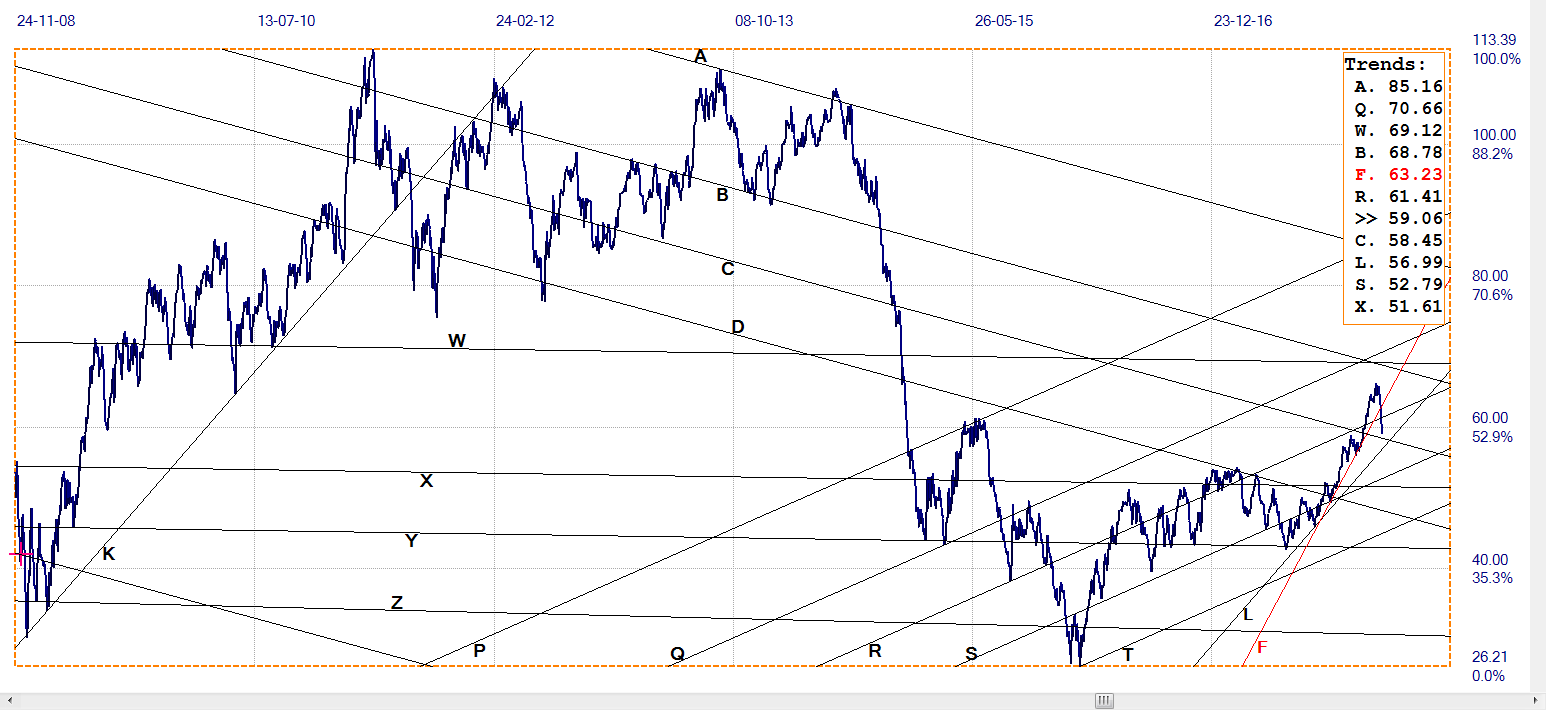
WTI crude – Daily close, last = $59.06 (www.investing.com )
*********


