Is A Market Top In Place?


SPX: Long-term trend – The bull market is still intact.
Intermediate trend – Are long-term cycles sketching an important top?
Analysis of the short-term trend is done on a daily basis with the help of hourly charts. They are important adjuncts to the analysis of daily and weekly charts which ultimately indicate the course of longer market trends.
Market Overview
It is possible that the SPX completed its ending pattern on Friday. If so, it should result in a short-term correction which could later expand into something intermediate. The requirements for the beginning of a decline are fairly clear: for a start, the index must break below 2123 and follow through on the downside. The type of correction will depend on whether we can start a lower low-lower high pattern. The former low of 2068 would have to be surpassed; or a rally from that level should fall short of the former highs before turning down again. We’d better wait until next week’s action before getting too specific.
While some of the leading and supporting indices appear ready to correct, others do not look that vulnerable. One ray of hope for the bears is the fact that the transportation index made its high on 11/28 and has been correcting ever since. On Friday, it made a new correction low. It will have to accelerate its downtrend from here if it is to lead the market lower. Another leader looking vulnerable is IWM which appears to be completing a secondary top. It is still difficult to find many indexes showing weakness, so more patience may be required on the part of the bears before a bona fide reversal takes place.
Indicators Survey
Nor has there been enough weakness displayed by the weekly price chart to turn down its momentum indicators, but they have been increasing their negative divergence.
The daily momentum indicator appears ready to tip over while the A/D has already given a sell signal.
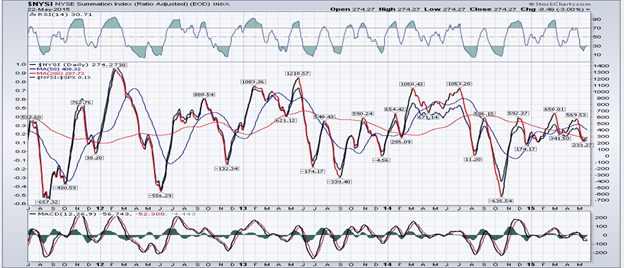
The Summation Index (next two charts courtesy of StockChart.com) remained near its low for the entire week. No sign of strength there.
Last week was a week of distribution in a narrow range for the SPX with a potential 50+ point correction if 2122 is broken.
The 3X price chart continues to form a rounding top, as does the bar chart.
Chart Analysis
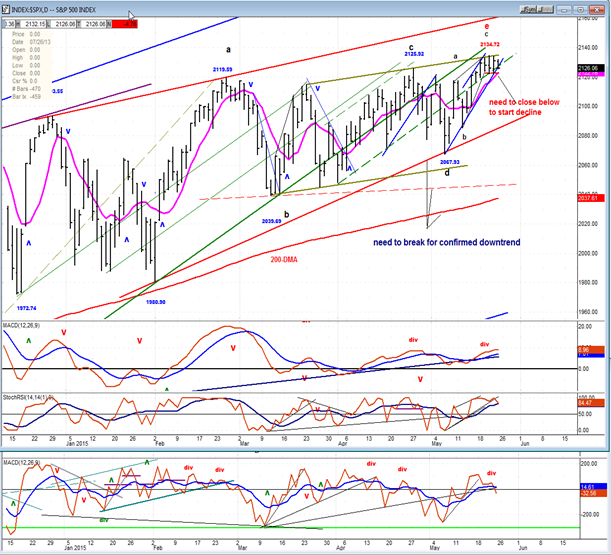
The daily chart (courtesy of Qcharts.com as well as others below) shows an ending pattern which may be complete. I have labeled it as such but some confirming price action which has been noted on the chart will be required. On Friday, SPX closed just outside of its blue uptrend line, but that is not quite enough to determine that a sell signal has been given. Although, if you look at the oscillators, the SRSI and especially the A/D MACD turned down on Friday, suggesting that we could have a weak opening on Tuesday morning to start a correction. It this happens, breaking below the red uptrend line (which forms the bottom line of the ending triangle) would have to take place, next.
Even if this occurs, it is possible that we are only continuing the sideways pattern which started in early February. If, however, the decline extends below the dashed red line and continues below the 200 DMA, we will have confirmed the start of a decline of intermediate proportion. Since we may only be getting started, it would take some protracted weakness to achieve what has been suggested. We’d better wait until something more bearishly tangible occurs before we get carried away with an intermediate decline scenario. Just keep in mind that last week we discussed Eric Hadik’s prognosis for several important cycles topping collectively in this time frame. We should watch the market action closely to see if it is valid.
This week, I am substituting a 10m chart of the SPX for the hourly chart that I normally post because it shows more clearly the potential top formation which has been in progress since the beginning of last week. Just like the much larger formation going back to February, a rounding top is being formed which will be complete if we have a weak opening on Tuesday morning -- as is being hinted by Friday’s last 10m activity.
The rounding top started on May 12 at 2088. By the 19th, some deceleration started with price peaking the next day at 2134.72. After that, deceleration gave way to declining prices which continued until the close of Friday. The trend line from 2068 was broken decisively early Friday morning, followed by a back-test to the trend line a couple of hours later and some selling taking at the last minute.
All that is needed to show that a downtrend has started is for the index to break the shallow red trend line and the horizontal line. This would complete a very symetrical rounding top and give a short-term sell signal. We would then need to see how serious it is. As discussed above, just by dropping below 2122 with follow through, it may be enough to suggest that we have started a decline of about 50 points.

XBD (AMEX Securities Broker/Dealer)
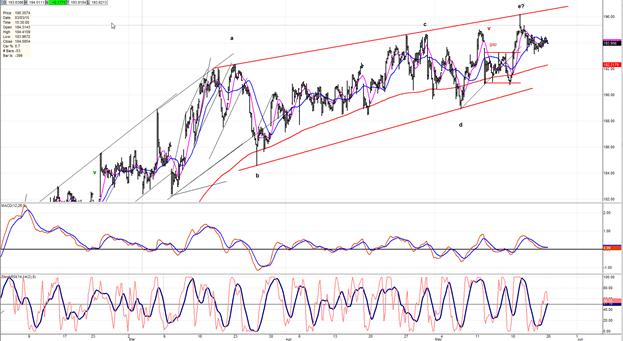
XBD’s potentially bearish action described last week was premature since it went on to make a slightly higher high. However, it did stop right on the upper trend line of the ending pattern and may have completed it by doing so. This will be confirmed if it sells off during the coming week.
IWM (Rusell 2000 ETF)
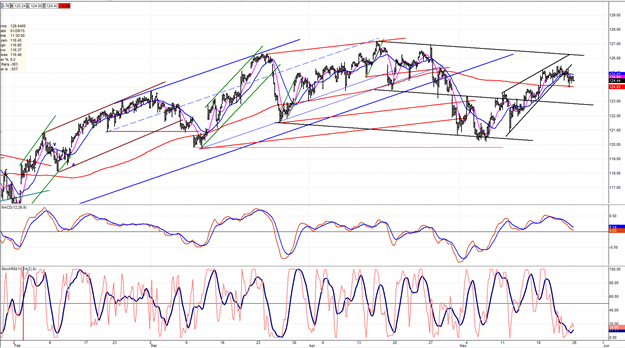
IWM made its high on 4/15, had a short-term correction into 5/06, and started a secondary trend which may have ended last week. If it begins to decline again from here, it would add substantially to the bearish tone of the market.
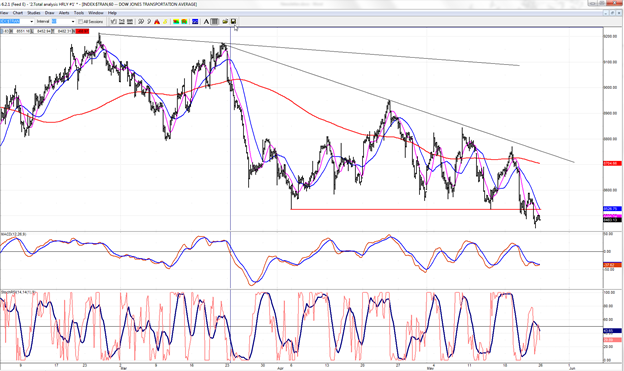
TRAN (Dow Jones Transportation Index)
TRAN is the weakest of the leading indexes. It made its high last November and has been declining ever since. On Friday, it made a new low and will increase its bearish outlook if it continues lower next week.
UUP
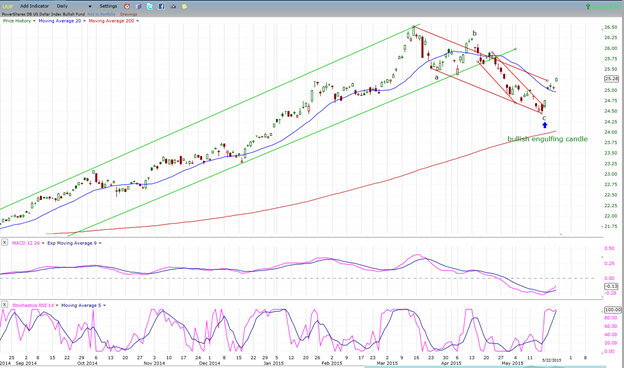
“UUP does not yet appear to have found a reliable low, although Friday’s action formed a bullish engulfing pattern which may indicate that a low has been made. Let’s see if it follows through with some upside progress on Monday.”
It looks as if last week’s analysis was correct. The index had a good rally which caused prices to almost break out of their downtrend channel. We’ll have to see if it is ready to continue on its upward journey right away or if it takes a breather first.
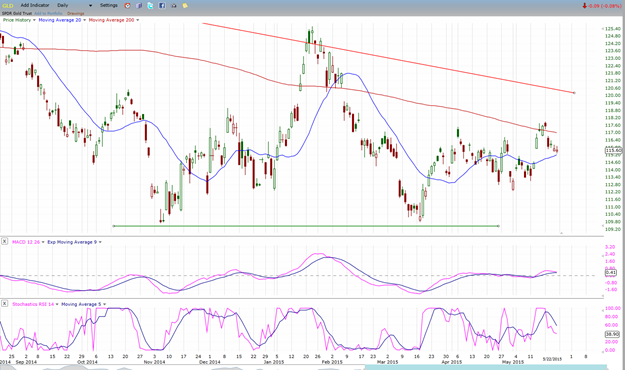
GLD
Gold tried to move up from its low the week before last. However, with the dollar strengthening, it lost its upside momentum and pulled back. It may not do very much for another few weeks, until some larger trends turn more favorable.
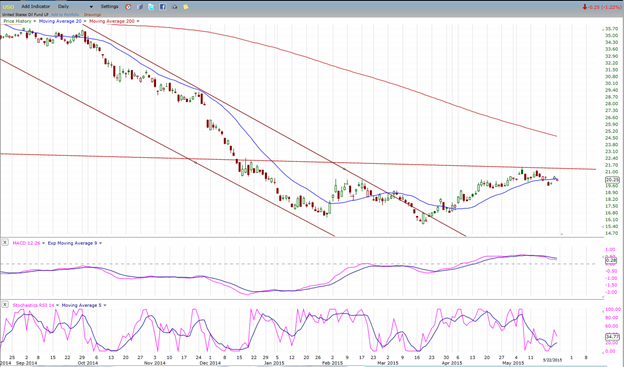
USO
USO has still not been able to penetrate the overhead resistance caused by a long-term mid-channel line. It has not been pushed back very much, so there may be another attempt at doing so in the days ahead. If it can’t, it will be vulnerable to resuming its downtrend.
Summary
“All eyes should be focused on next week’s market action, starting with Monday’s opening!”
Although it did not decline last week but registered a new high instead, SPX did not make much upside progress either. In fact, its price pattern for the past week looks very much like distribution in the form of a rounding top as shown on the 10m chart, above.
There have been many false alarms in the past few weeks and the recent bearish chart formation of the last few days may be another one. We’ll just have to see what gives, next week.
********
FREE TRIAL SUBSCRIPTON
Market Turning Points is an uncommonly dependable, reasonably priced service providing intra-day market updates, a daily Market Summary, and detailed weekend reports. It is ideally suited to traders, but it can also be valuable to investors since highly accurate longer-term price projections are provided using Point & Figure analysis and Fibonacci projections. Best-time reversal estimates are obtained from cycle analysis.
For a FREE 4-week trial, send an email to: [email protected]
For further subscription options, payment plans, weekly newsletters, and for general information, I encourage you to visit my website at www.marketurningpoints.com . By clicking on "Free Newsletter" you can access the latest newsletter which is normally posted on Sunday afternoon (unless it happens to be a 3-day weekend in which case it could be posted on Monday).
The above comments and those made in the daily updates and the Market Summary about the financial markets are based purely on what I consider to be sound technical analysis principles. They represent my own opinion and are not meant to be construed as trading or investment advice, but are offered as an analytical point of view which might be of interest to those who follow stock market cycles and technical analysis.

When Andre Gratian was a stock broker years ago, a friend introduced him to technical analysis of the market. Consequently, it is not an exaggeration to say that Andre fell in love with this approach! Ever since then, it has become an increasingly important part of his professional life. Gratian has studied the works of Wyckoff, Edwards & Magee, Edward J. Dewey (cycles) and many others. However, one of my most profitable undertaking has probably been to study Point & Figure charting, which he finds invaluable in analyzing stocks and indices. If he were restricted to one methodology, this is the one that he would choose. This well-rounded background has given him what he feels to be a special insight into the stock market, facilitating the recognition of meaningful patterns and the ‘turning points’ in all trends, whether they be short or long term. Andre feels very comfortable discussing the stock market and passing on meaningful information to others. His subscribers include individuals and money managers throughout the world. Moreover, his Newsletters are currently published on several financial sites, here and abroad.
More from Gold-Eagle


