Market Turning Points


“By the Law of Periodical Repetition, everything which has happened once must happen again, and again, and again -- and not capriciously, but at regular periods, and each thing in its own period, not another’s, and each obeying its own law … The same Nature which delights in periodical repetition in the sky is the Nature which orders the affairs of the earth. Let us not underrate the value of that hint." -- Mark Twain
Current position of the market
SPX: Very Long-term trend – The very-long-term cycles are in their down phases, and if they make their lows when expected (after this bull market is over), there will be another steep decline into late 2014. However, the Fed policy of keeping interest rates low has severely curtailed the full downward pressure potential of the 40-yr and 120-yr cycles.
Intermediate trend – New uptrend still in doubt
Analysis of the short-term trend is done on a daily basis with the help of hourly charts. It is an important adjunct to the analysis of daily and weekly charts which discusses the course of longer market trends.
WAS FRIDAY A REVERSAL SIGNAL?
Market Overview
On Friday, one of the more astute EW analysts was looking for the end of a diagonal pattern with “a spike followed by a sharp reversal” to end the “B” wave of an ongoing corrective pattern. It certainly appears that the market accommodated his forecast, but will we now get the necessary follow through on the downside?
Last week, I was already looking for a correction and may have been a week early. My market indicators were ready then and are even more ready today. To give a sell signal, at a minimum, the SPX would have to close the day below 1845 (the lower the better). At the same time, NYSE A/Ds would need to show more weakness than they have shown in the past month. If that’s the case, a drop to about 1800 or below would not be a surprise.
In spite of the fact that the market rose to a new high of 1868 (finally reaching my long-standing target of 1863) the potential “B” wave scenario has some support. It’s certainly very possible for the DJIA to still be in a corrective pattern if it reverses from here, since it is still shy of its former top by some 200 points. And while the Russell 2000 did manage to make a new all-time high, two other leading indicators that we have been following -- XBD and XLF -- are in the same predicament as the DOW.
When the market is ready to reverse course -- as determined by the condition of the indicators -- a catalyst normally appears! In this case, events in Ukraine can certainly create enough uncertainty to trigger a quick correction.
Let’s see if my two reversal criteria are met on Monday!
Chart Analysis
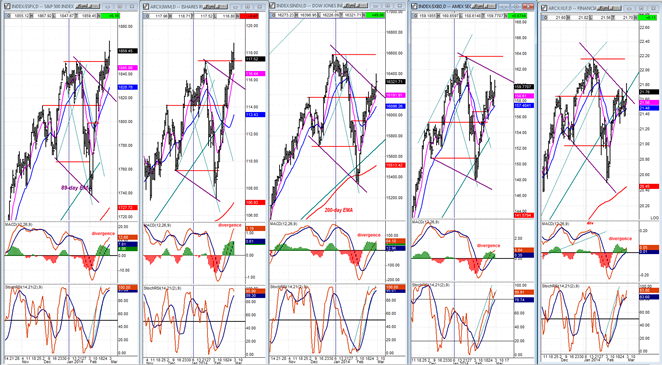
I want to keep on looking at the leading indexes in relationship to SPX because I believe that, as long as they do not catch up with it, they are telling us a story of increasing non-participation by stocks in the market advance. (These charts and the next two are courtesy of QCharts.com)
Last week, IWM caught up with SPX and is now on a par with it. But the other three (DJIA, XBD, and XLF) are still severely lagging. I heard an analyst explain by siting the fact that large caps are lagging the super performers like Google, Tesla, etc., creating a discrepancy in the level of performance among indexes. This would certainly be the case with the DJIA and the NASDAQ. Whatever the cause, it is not unusual for this condition to appear in the leading indicators before a correction.
Something else to notice in those charts is the negative divergence of all the MACDs, even those that made new highs. With all the SRSIs in various stages of overbought as well, it would be normal for the market to correct, and abnormal if it just kept on going up under these technical conditions.
One final point: if we do turn down from here, it would confirm that the lagging indexes are still in a corrective pattern and have just completed the B wave.
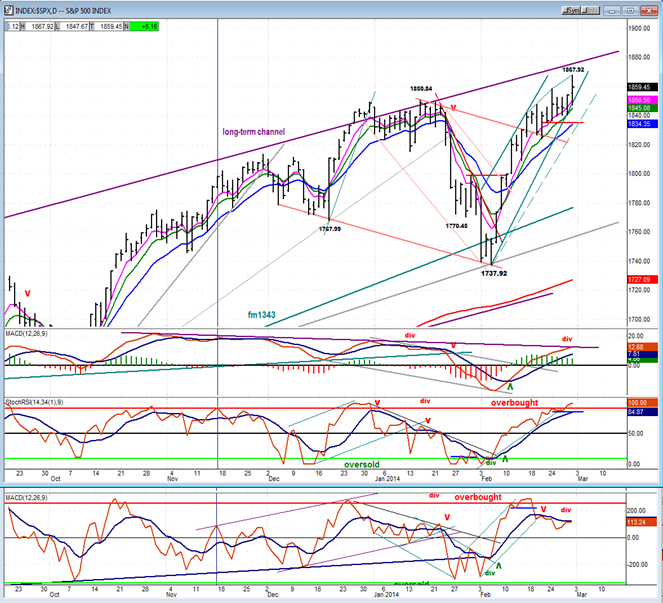
Let’s take a look at the daily chart of the S&P 500 individually.
There is not much deceleration in the long-term price pattern. The purple line represents the top of the long-term channel starting from the October 2011 low. At the December high SPX went above it slightly before correcting. If 1868 turns out to be a top of some sort, it will only have failed to reach the top channel line by about only 30 some points, keeping the market condition still very overbought.
There is some noticeable deceleration taking place within the channel which defines the latest uptrend. This is a negative and means that the index is losing momentum as it is making new highs. This condition is reflected in the MACD which is in the process of making a lower third top. The SRSI is not showing any divergence but it is very overbought and could turn down at any time. The A/D indicator at the bottom, however, is also showing significant negative divergence and has already undergone a negative cross of its averages.
This, as it has been for the past week, is the technical picture of an index which is ready to correct.
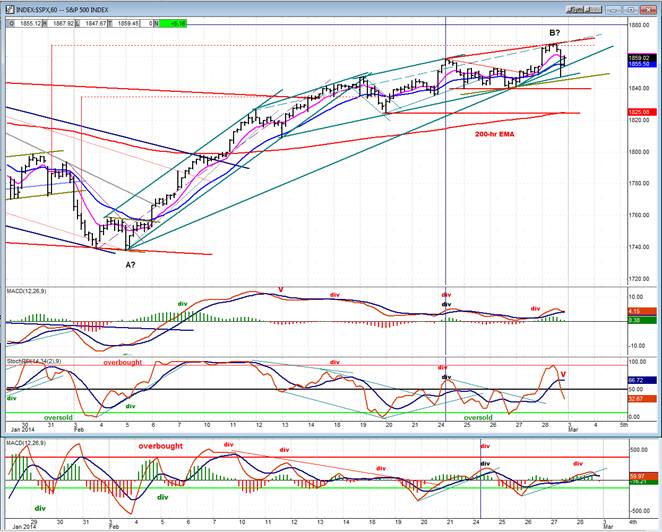
As for the hourly chart, it has been forming a rounding top that is responsible for the deceleration pattern seen on the daily chart. The last peak (formed on Friday) was made with negative divergence in two of the three indices, and the one which did not show divergence became overbought, reversed, and gave a sell signal at the close. The other two have also rolled over and just need to make a bearish cross and go negative to give a sell signal as well.
Should the oscillators give a sell signal, it will be confirmed when the index closes below all three trend lines on an hourly basis -- especially if it follows through and closes below the first red horizontal line.
The ultimate confirmation would be an hourly close below the 200-hr MA. While that sounds as if a lot of steps are required to give a sell signal, a weak opening on Monday could easily fulfill the majority of those conditions.
A confirmed sell signal in the hourly indicators would most likely entail a sell signal in the daily indicators.
Cycles
I believe that Friday may have been the top of a 9-10 trading day high-to-high cycle which would reinforce the potential for a market top.
Breadth
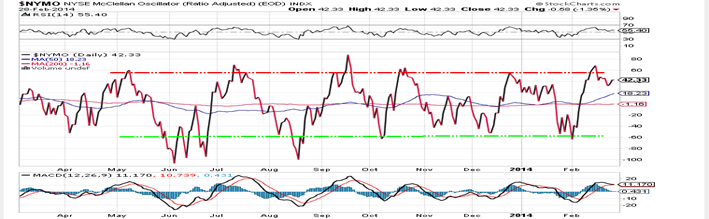
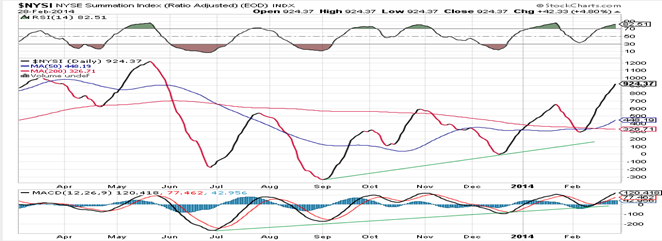
Charts of the McClellan Oscillator and Summation Index appear below (courtesy of StockCharts.com).
A new high in the market on Friday unmatched by the McClellan Oscillator and its indicators has created negative divergence. The Summation Index has continued to rise and this has pushed its RSI even higher into overbought territory. These two indicators add to the list of divergences and negatives to which I have pointed in the earlier part of the letter.
Sentiment Indicators
The SentimenTrader (courtesy of same) long-term and short-term indicators remained at the same values as last Friday’s. That does not necessarily indicate that we will not have a correction, but only that 1868 is not likely to be the top of the bear market.

VIX (Velocity Index)
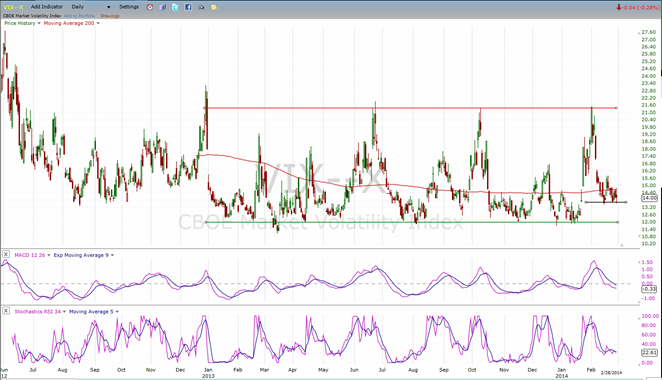
During the time that the SPX was preparing for and making its run to a new high, VIX retained its positive divergence by remaining in a small base constructed two points above its former low. This divergence could also be an indication that the SPX is getting ready for a correction. On the P&F chart, the base projection calls for a move of about 6 points, to 20. That is only a point shy of the former move (ostensibly A). Does that mean that the C wave could turn out to be just shy of the A wave? We’ll see!
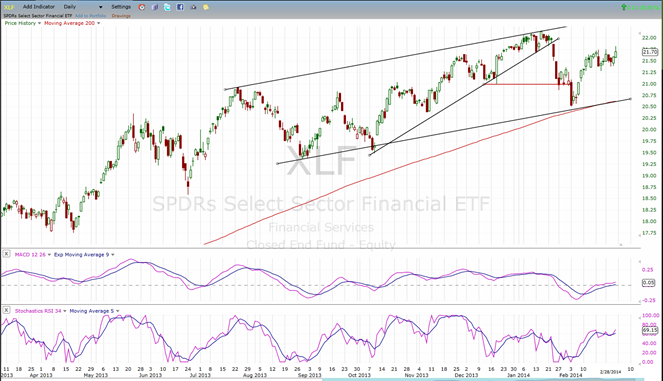
XLF (Financial Index)
Another look at XLF shows the relative weakness of this leading indicator to SPX. It has to be saying something about the near-term prospects for the market.
TLT (Barclays 20+ year Treasury bond fund)
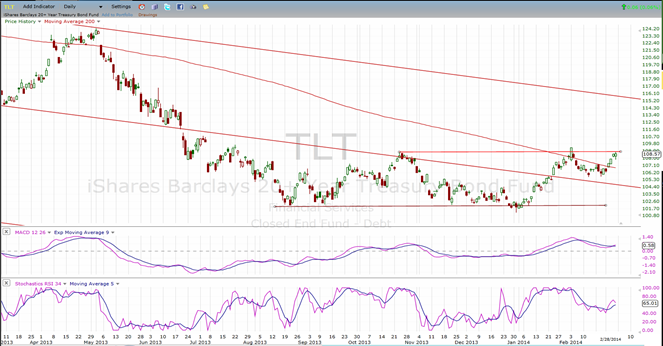
TLT did not give much ground when it pulled-back and has since returned to the resistance area that stopped it before. The formation (cup with a handle?) is bullish and intimates further upside movement. According to the base that was built as a perfect fulcrum on the P&F chart, TLT is capable of moving up to 116. This sounds logical since it would correspond to the top of its declining channel. Surely, SPX will not continue to move higher if this happens to TLT!
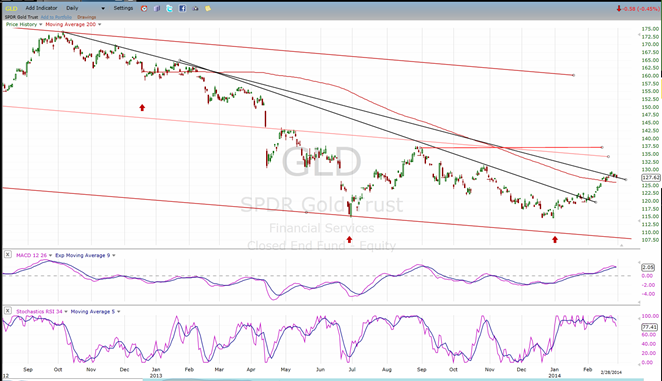
GLD (ETF for gold)
The 25-week cycle continues to push GLD higher with hardly any interruption. It has now overcome its 200-DMA, and is trying to get above the second downtrend line. Its base projection calls for a minimum of 134 with a potential for slightly above 140.
UUP (dollar ETF)
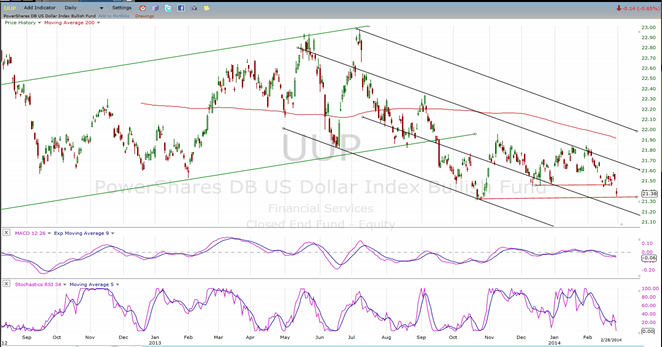
UUP has broken its first support level and is challenging the second. If that is broken as well, the index could stabilize on the inner parallel to the bottom channel line. If it continues, the additional decline would be consistent with the uptrend in gold.
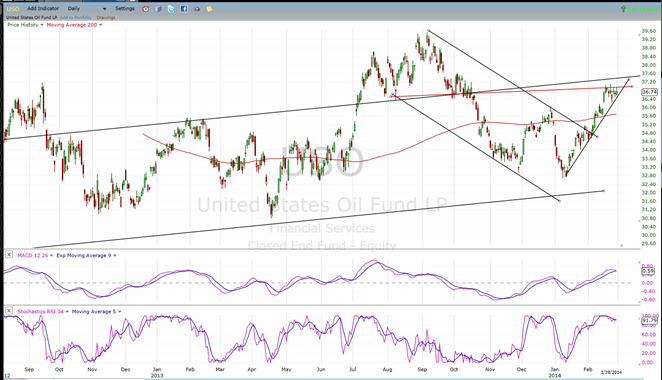
USO (United States Oil Fund)
USO has stopped its advance at the lower level of a hefty resistance area. Prospects for higher prices are not good over the short-term, especially if it continues if the market starts to correct. Let’s see if it does pull back and if it can hold above its 200-DMA.
Summary
If the market appeared ready for a correction last week, it looks even more so this week. If this happens, the best guesstimate for the near-term structure would be the completion of a larger corrective pattern (A-B-C) with the C wave of that structure about to unfold.
FREE TRIAL SUBSCRIPTON
Market Turning Points is an uncommonly dependable, reasonably priced service providing intra-day market updates, a daily Market Summary, and detailed weekend reports. It is ideally suited to traders, but it can also be valuable to investors since highly accurate longer-term price projections are provided using Point & Figure analysis. Best-time reversal estimates are obtained from cycle analysis.
For a FREE 4-week trial, send an email to: [email protected]
For further subscription options, payment plans, weekly newsletters, and for general information, I encourage you to visit my website at www.marketurningpoints.com . By clicking on “Free Newsletter” you can get a preview of the latest newsletter which is normally posted on Sunday afternoon (unless it happens to be a 3-day weekend in which case it could be posted on Monday).
The above comments and those made in the daily updates and the Market Summary about the financial markets are based purely on what I consider to be sound technical analysis principles. They represent my own opinion and are not meant to be construed as trading or investment advice, but are offered as an analytical point of view which might be of interest to those who follow stock market cycles and technical analysis.

When Andre Gratian was a stock broker years ago, a friend introduced him to technical analysis of the market. Consequently, it is not an exaggeration to say that Andre fell in love with this approach! Ever since then, it has become an increasingly important part of his professional life. Gratian has studied the works of Wyckoff, Edwards & Magee, Edward J. Dewey (cycles) and many others. However, one of my most profitable undertaking has probably been to study Point & Figure charting, which he finds invaluable in analyzing stocks and indices. If he were restricted to one methodology, this is the one that he would choose. This well-rounded background has given him what he feels to be a special insight into the stock market, facilitating the recognition of meaningful patterns and the ‘turning points’ in all trends, whether they be short or long term. Andre feels very comfortable discussing the stock market and passing on meaningful information to others. His subscribers include individuals and money managers throughout the world. Moreover, his Newsletters are currently published on several financial sites, here and abroad.


