Miners: What the HUI Index Says About the Medium-Term


Ignoring cycles, trends, and technical patterns is a potential recipe for disaster. The HUI index can tell us a lot about the near future.
After the HUI Index sunk to a new 2021 low last week, the index further validated the breakdown below the neckline of its bearish head & shoulders pattern. For context, H&S’ breakdowns have coincided with the largest declines in the HUI Index in recent decades. And while gold’s triangle-vertex-based reversal point may stop the bleeding in the very short-term, the HUI Index’s wounds are far from healed. To explain, I’ve been sounding the alarm on the HUI Index since the New Year (the index has declined by more than 29% YTD) and I wrote the following on Sep. 13:
The HUI Index plunged by nearly 6% last week, and the reversal of the previous corrective upswing mirrors its behavior from 2013. In addition, with its stochastic oscillator and its RSI (Relative Strength Index) also a spitting image, an ominous re-enactment of 2013 implies significantly lower prices over the medium term.
Please see below:
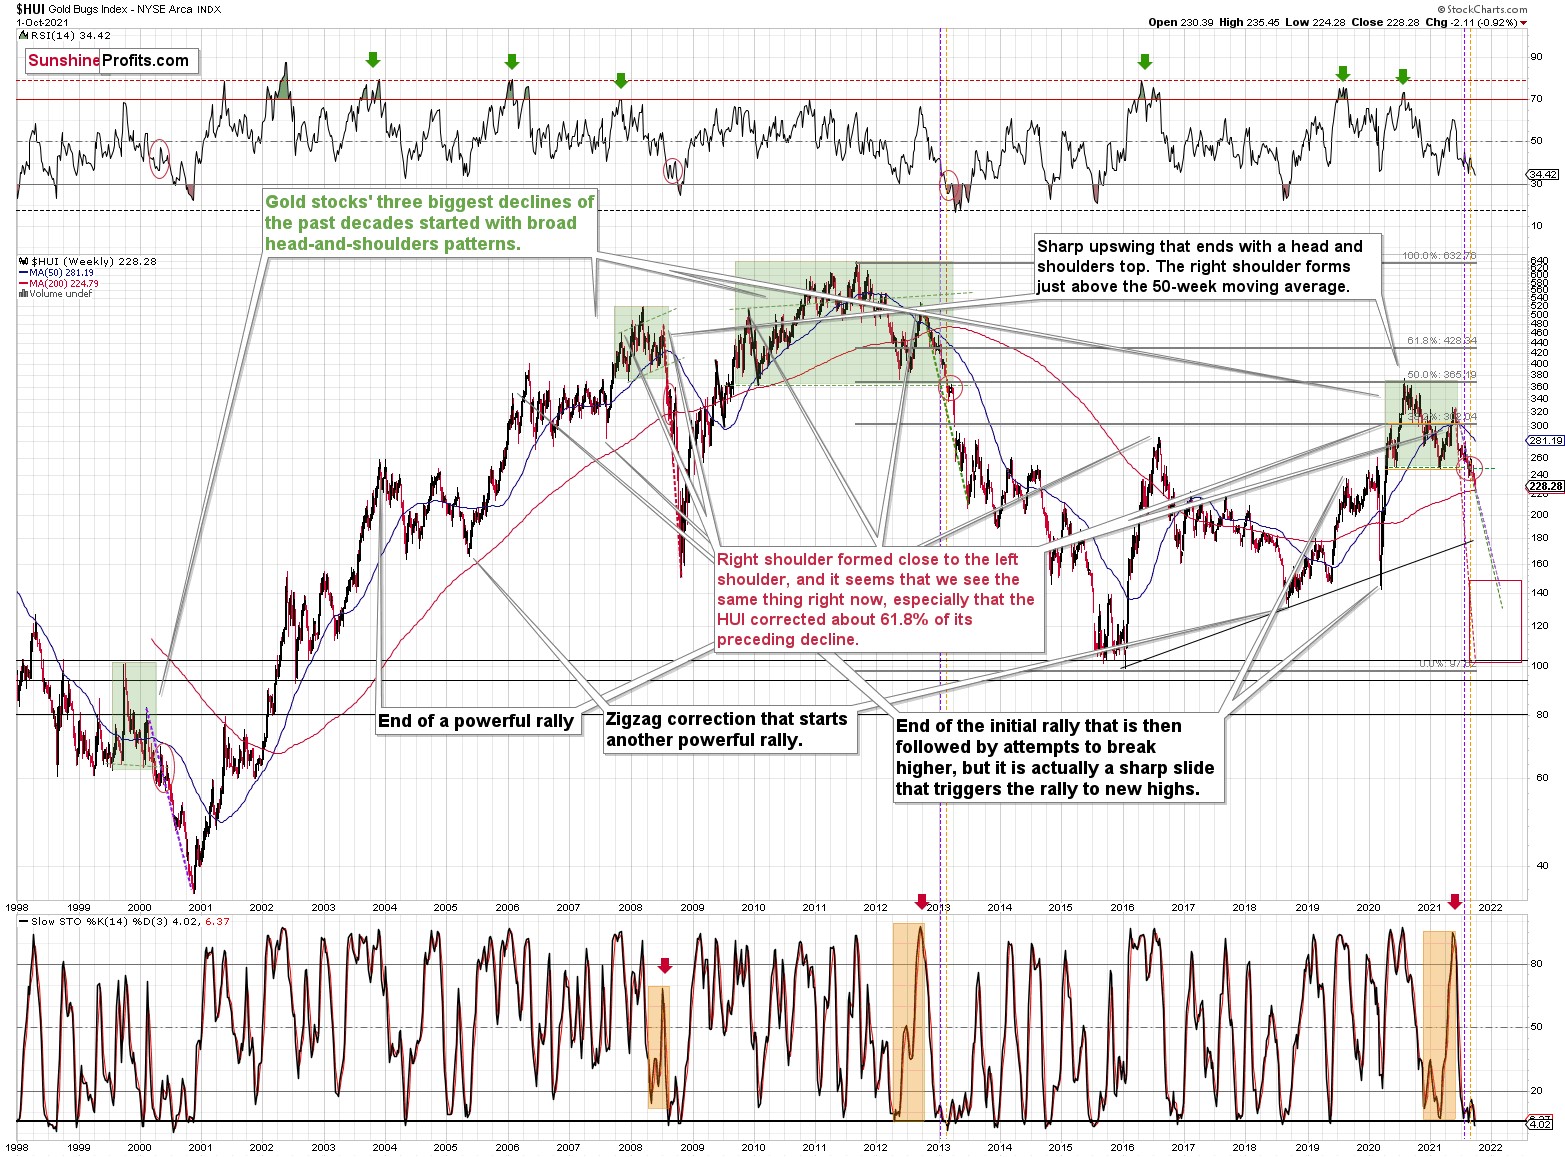
Furthermore, while I’ve also been warning about the ominous similarity to 2012-2013, the HUI Index continues to hop into the time machine. To explain, the vertical, dashed lines above demonstrate how the HUI Index is following its 2012-2013 playbook. For example, after a slight buy signal from the stochastic indicator in 2012, the short-term pause was followed by another sharp drawdown. For context, after the HUI Index recorded a short-term buy signal in late 2012 – when the index’s stochastic indicator was already below the 20 level (around 10) and the index was in the process of forming the right shoulder of a huge, medium-term head-and-shoulders pattern – the index moved slightly higher, consolidated, and then fell off a cliff. Thus, the HUI Index is quite likely to decline to its 200-week moving average (or so) before pausing and recording a corrective upswing. That’s close to the 220 level. Thereafter, the index will likely continue its bearish journey and record a final medium-term low some time in December.
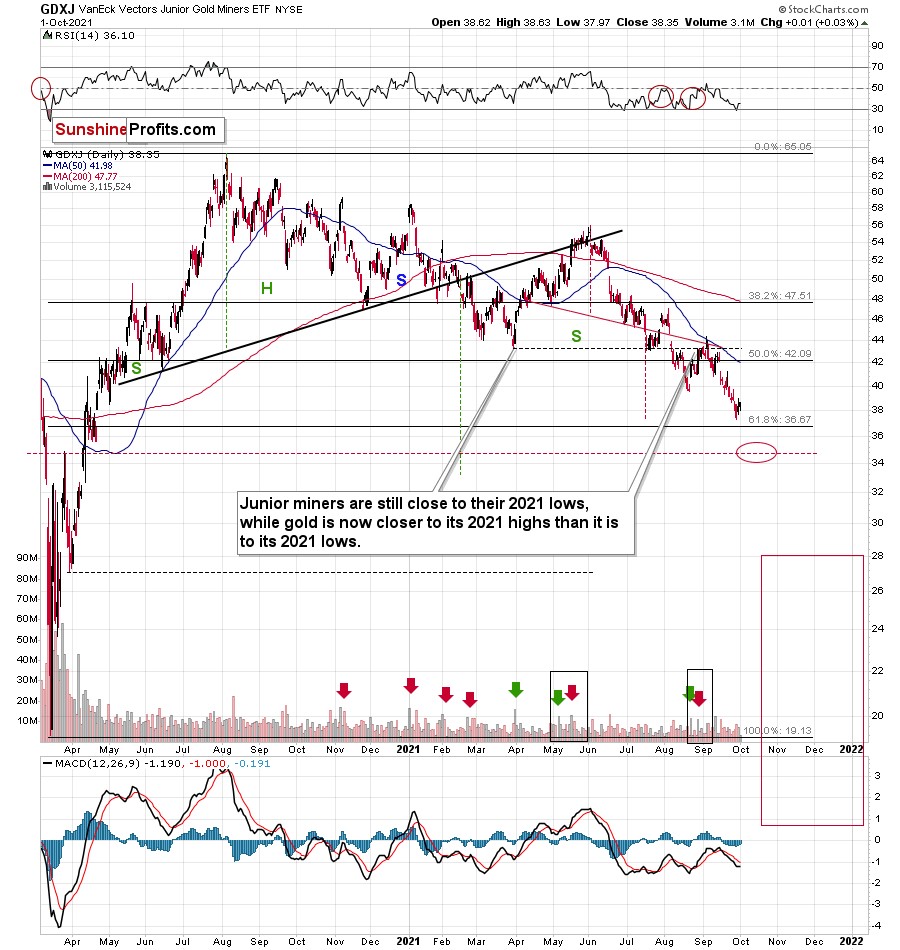
Furthermore, I warned previously that the miners’ drastic underperformance of gold was an extremely bearish sign. There were several weeks when gold rallied visibly, and the HUI Index actually declined modestly. And now, gold stocks are trading close to their previous 2021 lows, while gold is almost right in the middle between its yearly high and its yearly low.
And why is this so important? Well, because the bearish implications of gold stocks’ extreme underperformance still remain intact.
Let’s keep in mind that the drastic underperformance of the HUI Index also preceded the bloodbath in 2008 as well as in 2012 and 2013. To explain, right before the huge slide in late September and early October 2008, gold was still moving to new intraday highs; the HUI Index was ignoring that, and then it declined despite gold’s rally. However, it was also the case that the general stock market suffered materially. If stocks didn’t decline so profoundly back then, gold stocks’ underperformance relative to gold would have likely been present but more moderate.
Nonetheless, broad head & shoulders patterns have often been precursors to monumental collapses. For example, when the HUI Index retraced a bit more than 61.8% of its downswing in 2008 and in between 50% and 61.8% of its downswing in 2012 before eventually rolling over, in both (2008 and 2012) cases, the final top – the right shoulder – formed close to the price where the left shoulder topped. And in early 2020, the left shoulder topped at 303.02. Thus, three of the biggest declines in the gold mining stocks (I’m using the HUI Index as a proxy here) all started with broad, multi-month head-and-shoulders patterns. And in all three cases, the size of the declines exceeded the size of the head of the pattern. As a reminder, the HUI Index recently completed the same formation.
Yes, the HUI Index moved back below the previous lows and the neck level of the formation, which – at face value – means that the formation was invalidated, but we saw a similar “invalidation” in 2000 and in 2013. Afterwards, the decline followed anyway. Consequently, I don’t think that taking the recent move higher at its face value is appropriate. It seems to me that the analogies to the very similar situation from the past are more important.
As a result, we’re confronted with two bearish scenarios:
- If things develop as they did in 2000 and 2012-2013, gold stocks are likely to bottom close to their early-2020 low.
- If things develop like in 2008 (which might be the case, given the extremely high participation of the investment public in the stock market and other markets), gold stocks could re-test (or break slightly below) their 2016 low.
In both cases, the forecast for silver, gold, and mining stocks is extremely bearish for the next several months.
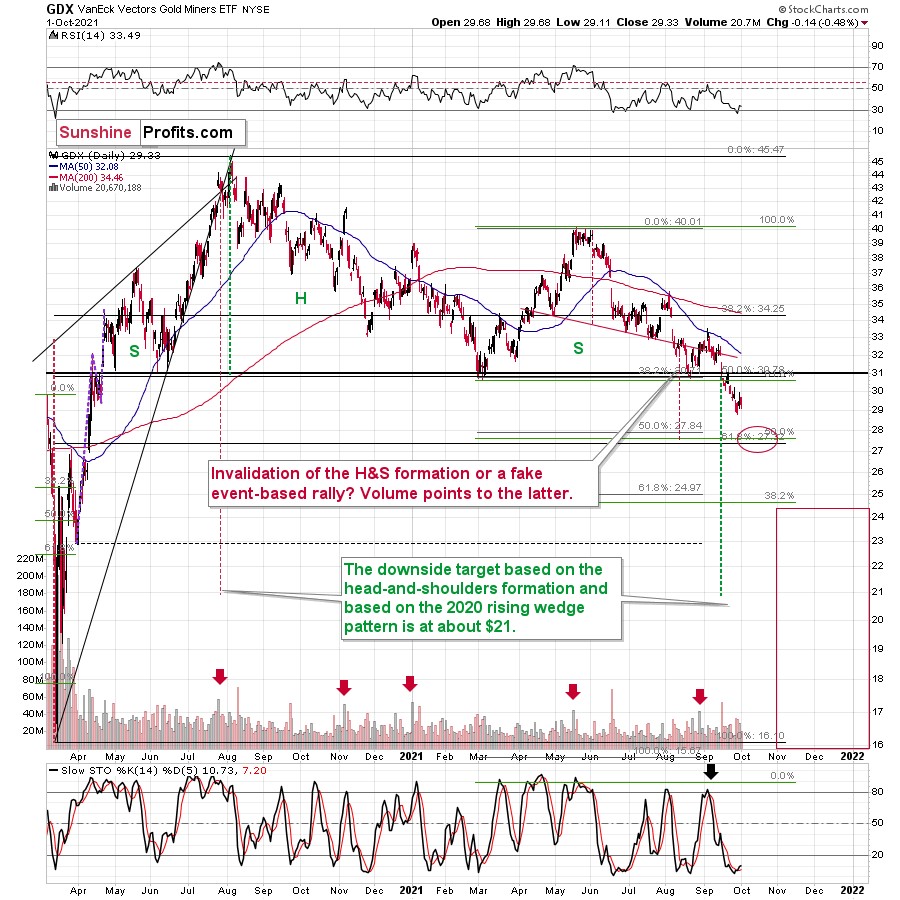
For even more confirmation, let’s compare the behavior of the GDX ETF and the GDXJ ETF. Regarding the former, the GDX ETF closed at a new 2021 low last week and sunk below $30 for the first time since April 2020. For context, I warned of a forthcoming calamity on Sep. 7:
I wrote:
Large spikes in daily volume are often bearish, not bullish. To explain, three of the last four volume outliers preceded an immediate top (or near) for the GDX ETF, while the one that preceded the late July rally was soon followed by the GDX ETF’s 2020 peak. Thus, when investors go ‘all in,’ material declines often follow. And with that, spike-high volume during the GDX ETF’s upswings often presents us with great shorting opportunities.
Moreover, even after the forecast became reality, the GDX ETF’s medium-term outlook remains quite bearish. For example, while gold bounced late last week and recouped its losses, the GDX ETF’s tepid rise further validated the senior miners’ underperformance.
As a result, the relative weakness implies lower lows over the next few months.
Please see below:
As for the GDXJ ETF, I wrote on Sep. 7 that overzealous investors would likely end the week disappointed:
With the current move quite similar to the corrective upswing recorded in mid-May, the springtime bounce was also followed by a sharp drawdown. As a result, the GDXJ ETF could be near its precipice, as its 50-day moving average is right ahead. And with the key level now acting as resistance, investors’ rejection on Sep. 3 could indicate that the top is already here.
And while the junior miners followed the roadmap to perfection, the GDXJ ETF still elicits material weakness. As a result, the GDXJ ETF remains poised to reach the ~$35 level over the medium term.
Please see below:
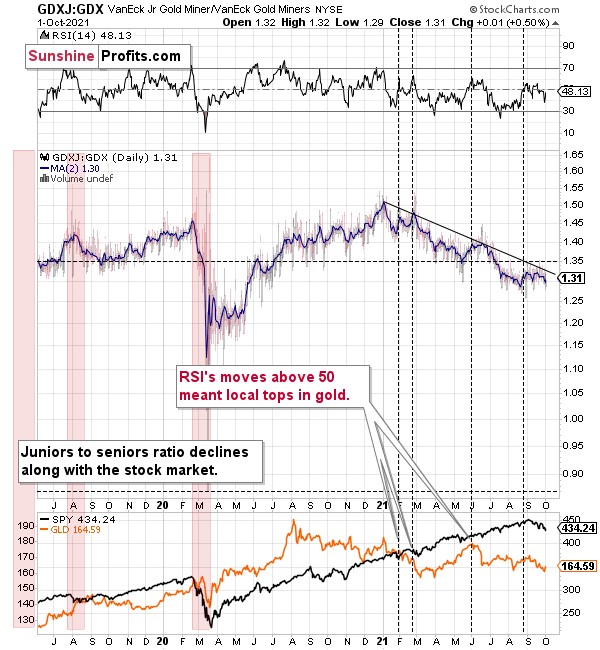
Finally, while I’ve been warning for months that the GDXJ/GDX ratio was destined for devaluation, the downtrend remains intact. And with the ratio reversing lower after reaching its declining resistance line, the medium-term implications remain unchanged. On top of that, if a stock-market swoon enters the equation, the ratio’s drawdown could be fast and furious (like what happened during the March 2020 crash).
To explain, when the ratio’s RSI jumped above 50 three times in 2021, it coincided with short-term peaks in gold. Second, the trend in the ratio this year has been clearly down, and there’s no sign of a reversal, especially when you consider that the ratio broke below its 2019 support (which served as resistance in mid-2020). When the same thing happened in 2020, the ratio then spiked even below 1.
The bottom line?
If the ratio is likely to continue its decline, then on a short-term basis we can expect it to decline to 1.27 or so. If the general stock market plunges, the ratio could move even lower, but let’s assume that stocks decline moderately (just as they did in the last couple of days) or that they do nothing or rally slightly. They’ve done all the above recently, so it’s natural to expect that this will be the case. Consequently, the trend in the GDXJ to GDX ratio would also be likely to continue, and thus expecting a move to about 1.26 - 1.27 seems rational.
If the GDX is about to decline to approximately $28 before correcting, then we might expect the GDXJ to decline to about $28 x 1.27 = $35.56 or $28 x 1.26 = $35.28. In other words, ~$28 in the GDX is likely to correspond to about $35 in the GDXJ.
Is there any technical support around $35 that would be likely to stop the decline? Yes. It’s provided by the late-Feb. 2020 low ($34.70) and the late-March high ($34.84). There’s also the late-April low at $35.63. Conservatively, I’m going to place the profit-take level just above the latter.
Consequently, it seems that expecting the GDXJ to decline to about $35 is justified from the technical point of view as well.
Speaking of ratios, there was also a major breakdown in the gold to gold stocks ratio which most likely heralds severe declines in the following weeks/months, and if you’re interested in it, I recorded a video about it here (or search for “Sunshine Profits” on YouTube – it’s the Oct. 2 video).
In conclusion, gold, silver, and mining stocks have all broken down technically, and their fundamental outlooks also remain quite treacherous over the next few months. With the USD Index hitting a new 2021 high last week and U.S. Treasury yields also rallying, the pairs’ upward momentum should continue over the medium term. Moreover, with the general stock market also showing signs of stress, a profound decline could add to the precious metals’ ills. As a result, gold, silver, and mining stocks’ weakness should continue before lasting bottoms likely form near the end of the year.
Thank you for reading our free analysis today. Please note that the above is just a small fraction of today’s all-encompassing Gold & Silver Trading Alert. The latter includes multiple premium details such as the targets for gold and mining stocks that could be reached in the next few weeks. If you’d like to read those premium details, we have good news for you. As soon as you sign up for our free gold newsletter, you’ll get a free 7-day no-obligation trial access to our premium Gold & Silver Trading Alerts. It’s really free – sign up today.
Przemyslaw Radomski, CFA
Founder, Editor-in-chief
Sunshine Profits: Effective Investment through Diligence & Care
* * * * *
All essays, research and information found above represent analyses and opinions of Przemyslaw Radomski, CFA and Sunshine Profits' associates only. As such, it may prove wrong and be subject to change without notice. Opinions and analyses are based on data available to authors of respective essays at the time of writing. Although the information provided above is based on careful research and sources that are deemed to be accurate, Przemyslaw Radomski, CFA and his associates do not guarantee the accuracy or thoroughness of the data or information reported. The opinions published above are neither an offer nor a recommendation to purchase or sell any securities. Mr. Radomski is not a Registered Securities Advisor. By reading Przemyslaw Radomski's, CFA reports you fully agree that he will not be held responsible or liable for any decisions you make regarding any information provided in these reports. Investing, trading and speculation in any financial markets may involve high risk of loss. Przemyslaw Radomski, CFA, Sunshine Profits' employees and affiliates as well as members of their families may have a short or long position in any securities, including those mentioned in any of the reports or essays, and may make additional purchases and/or sales of those securities without notice.
*********
 Przemyslaw Radomski, CFA, is the founder, owner and the main editor of SunshineProfits.com. You can reach Przemyslaw at: http://www.sunshineprofits.com/help/contact-us/.


