The Mysterious Mr. VIX


I must say that I continue to be amazed at how “CALM” things are in these equity markets in spite of the significant chart breakdowns that are now being seen in so many different sectors.
Look at how meager the move higher in the VIX has been especially compared to where it was back in August of last year during the “Flash Crash” that occurred back then.
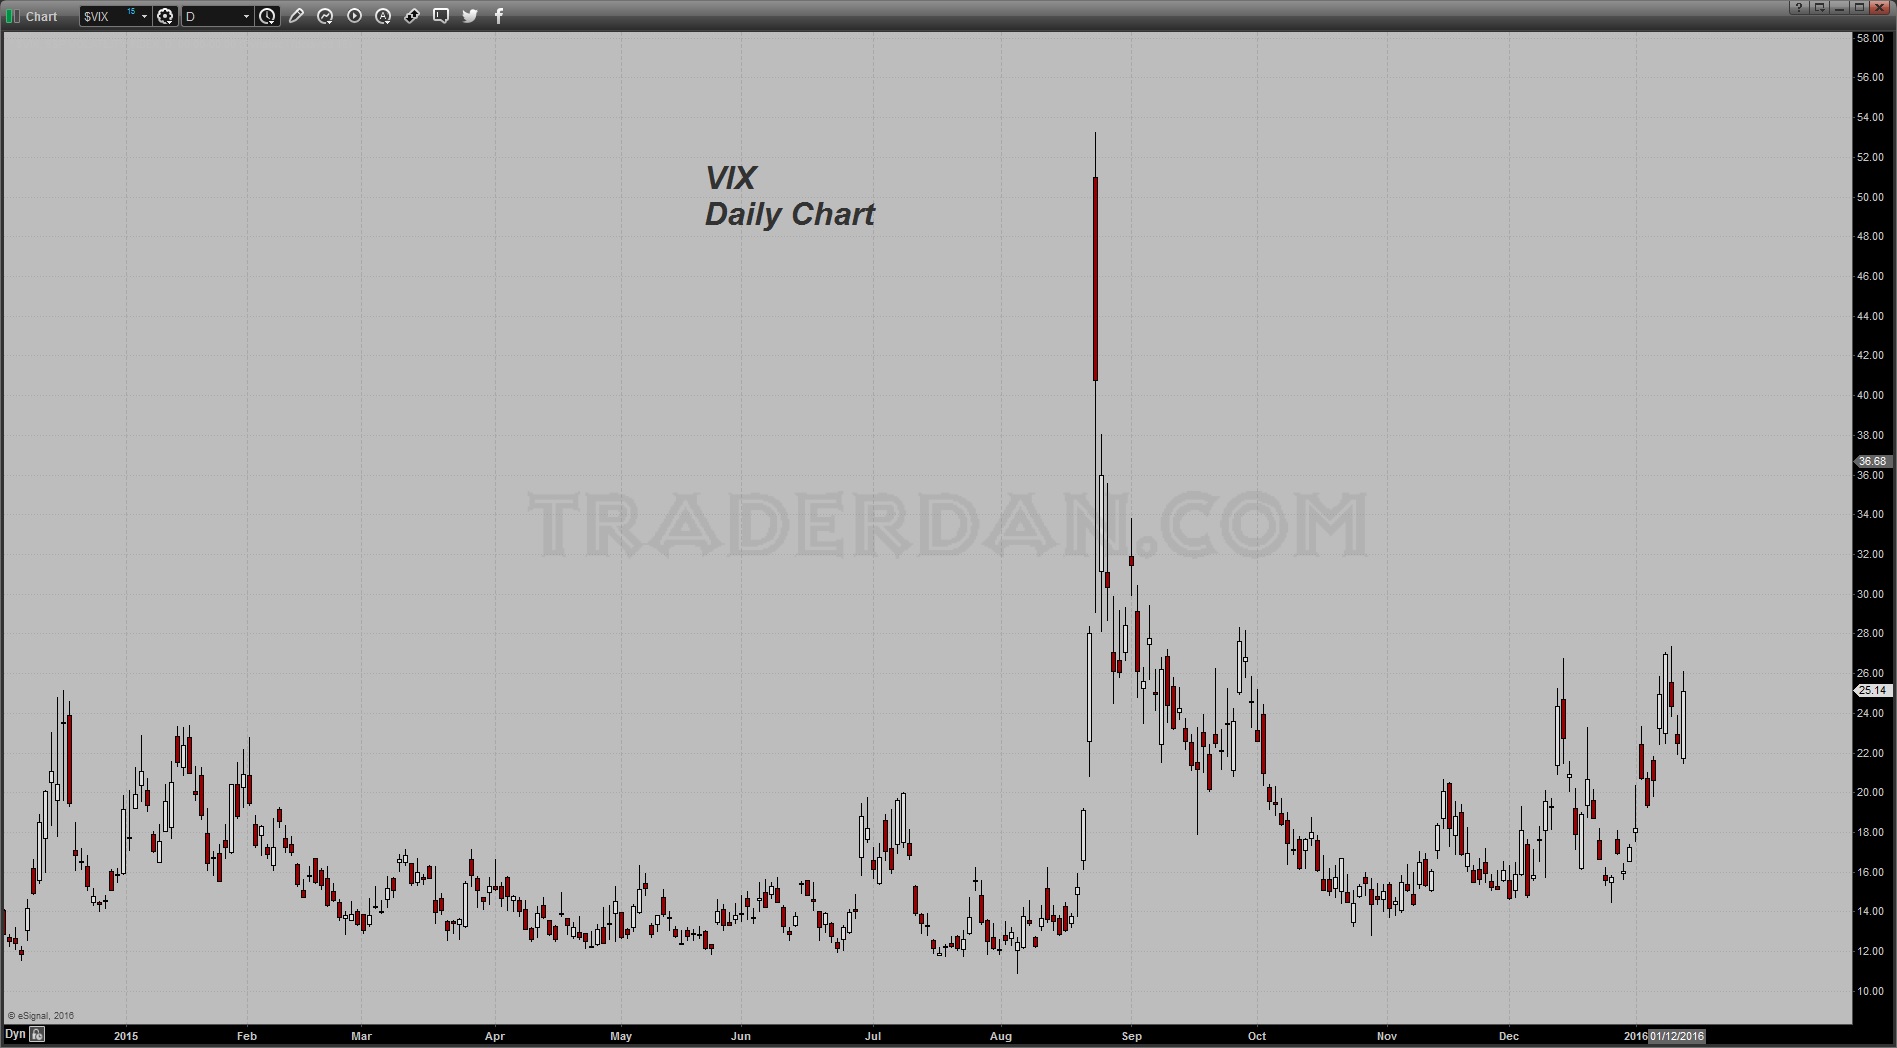
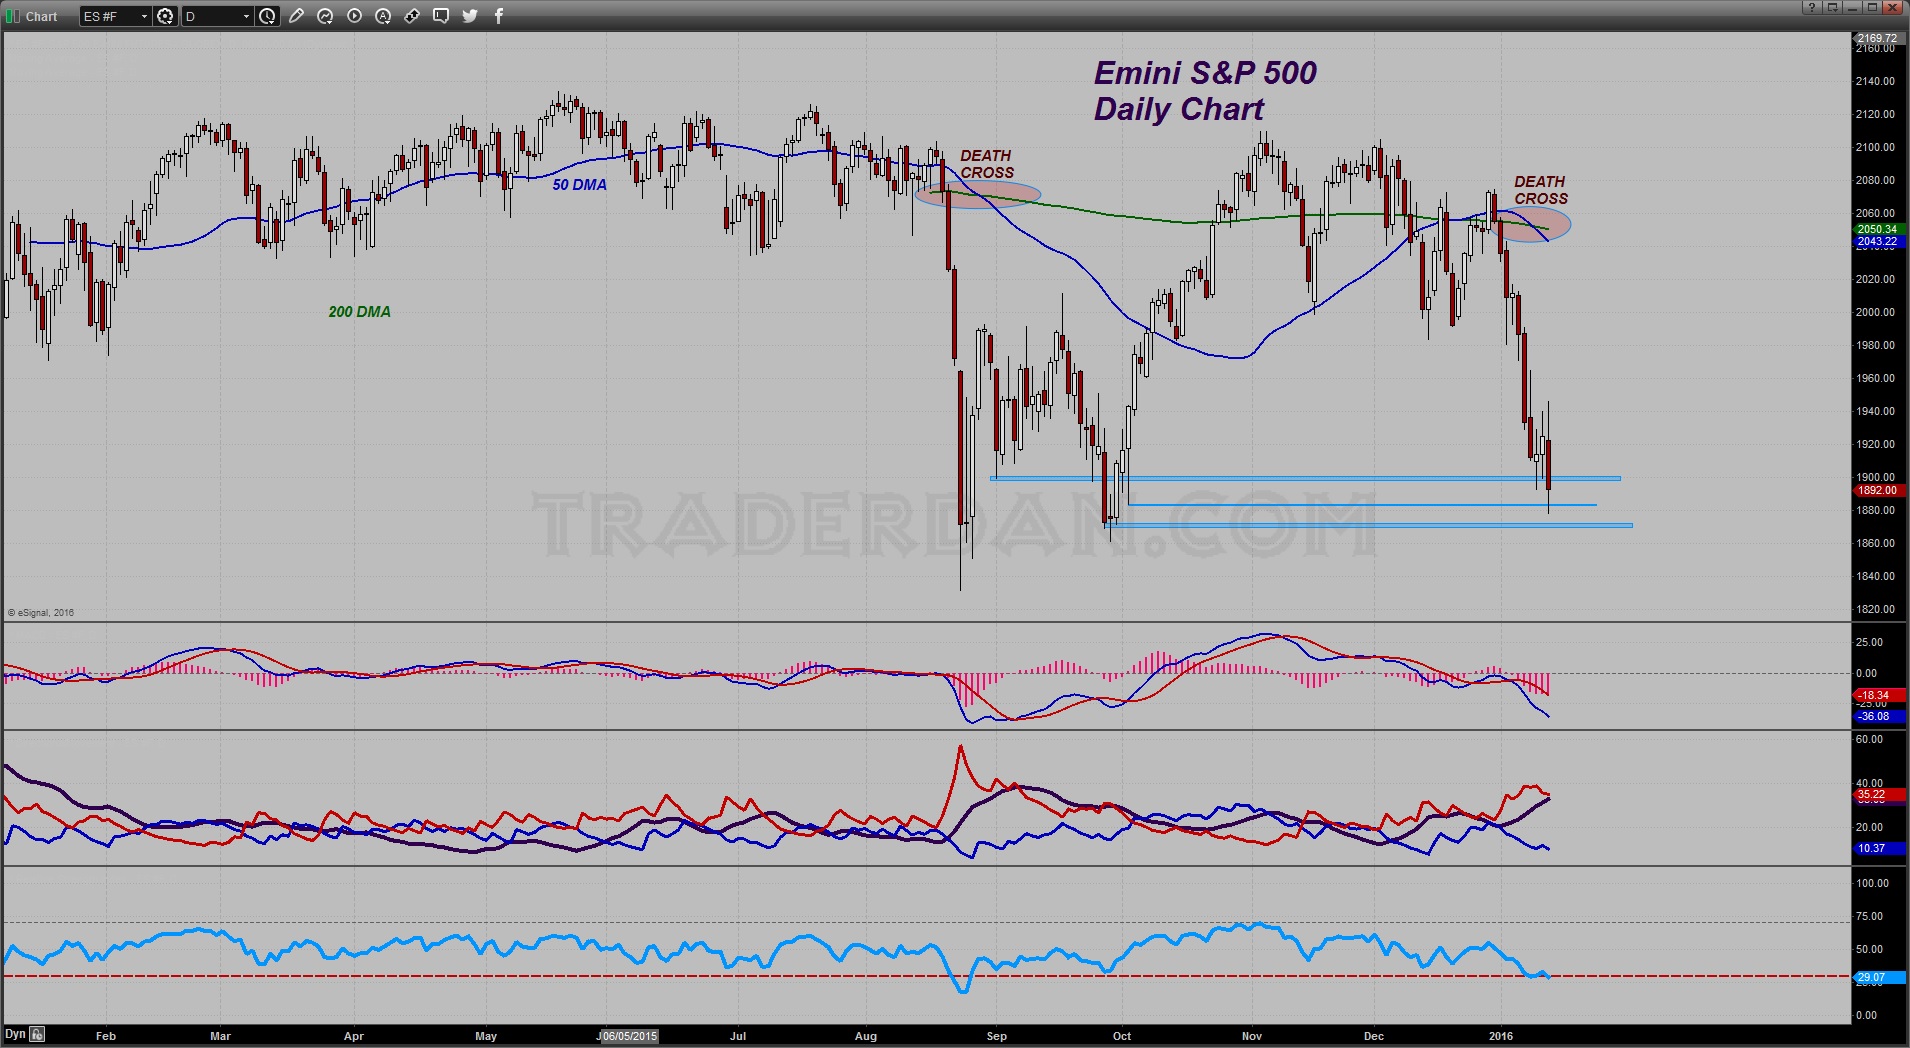
Compare the VIX with the S&P 500 chart.
The Russell 2000 is something worth watching however as this is probably the most “risk sensitive” stock index out there. It not only has fallen through the August lows, but it left the late September lows in the dust last week.
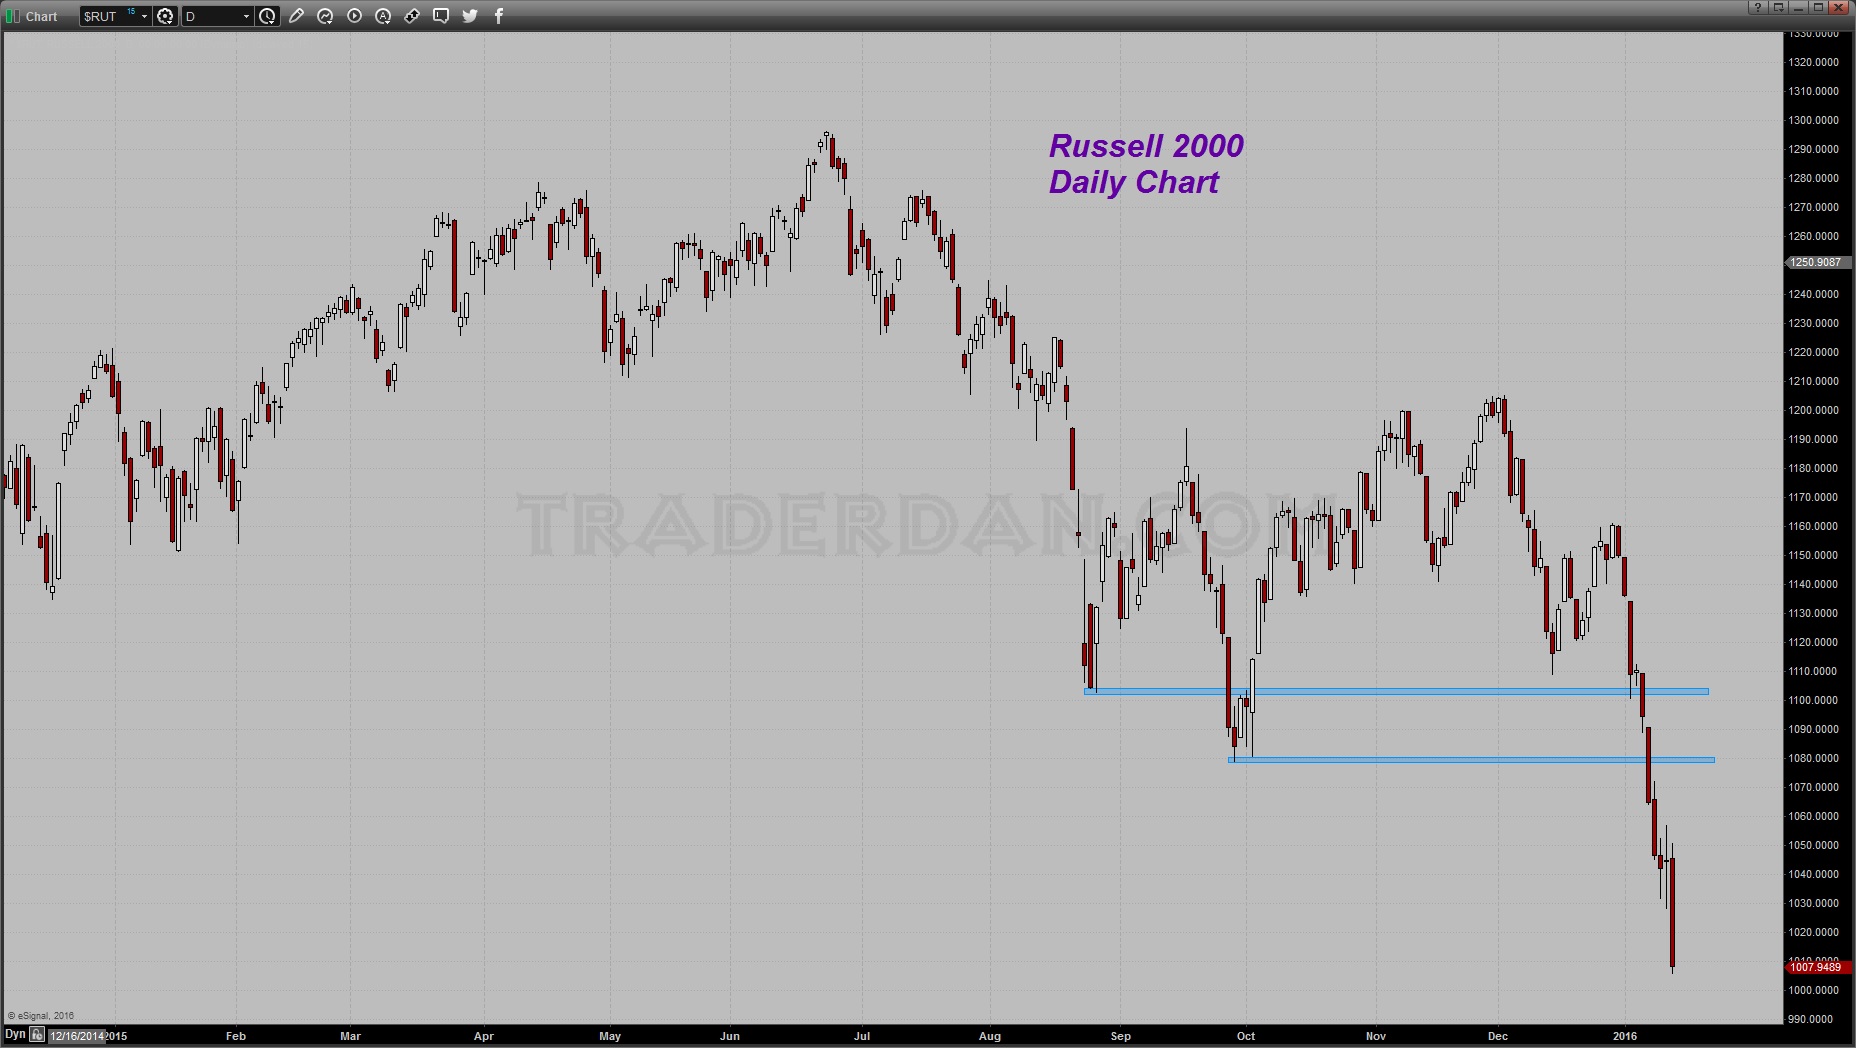
This is what makes the lack of upward movement in the VIX so mysterious for me. The small cap universe has come unglued (Russell 2000) with the broader markets threatening to do the same, yet the VIX seems to be YAWNING!
Remember, the VIX measures Sentiment. Right now, while there is certainly concern in the equity markets, there is certainly nothing that could be remotely considered to be fear. If this is a bear market in stocks, it certainly has most traders/investors bored!
Take a look at the intermediate term chart of the Russell 2000. It has now broken down below the October 2014 low.
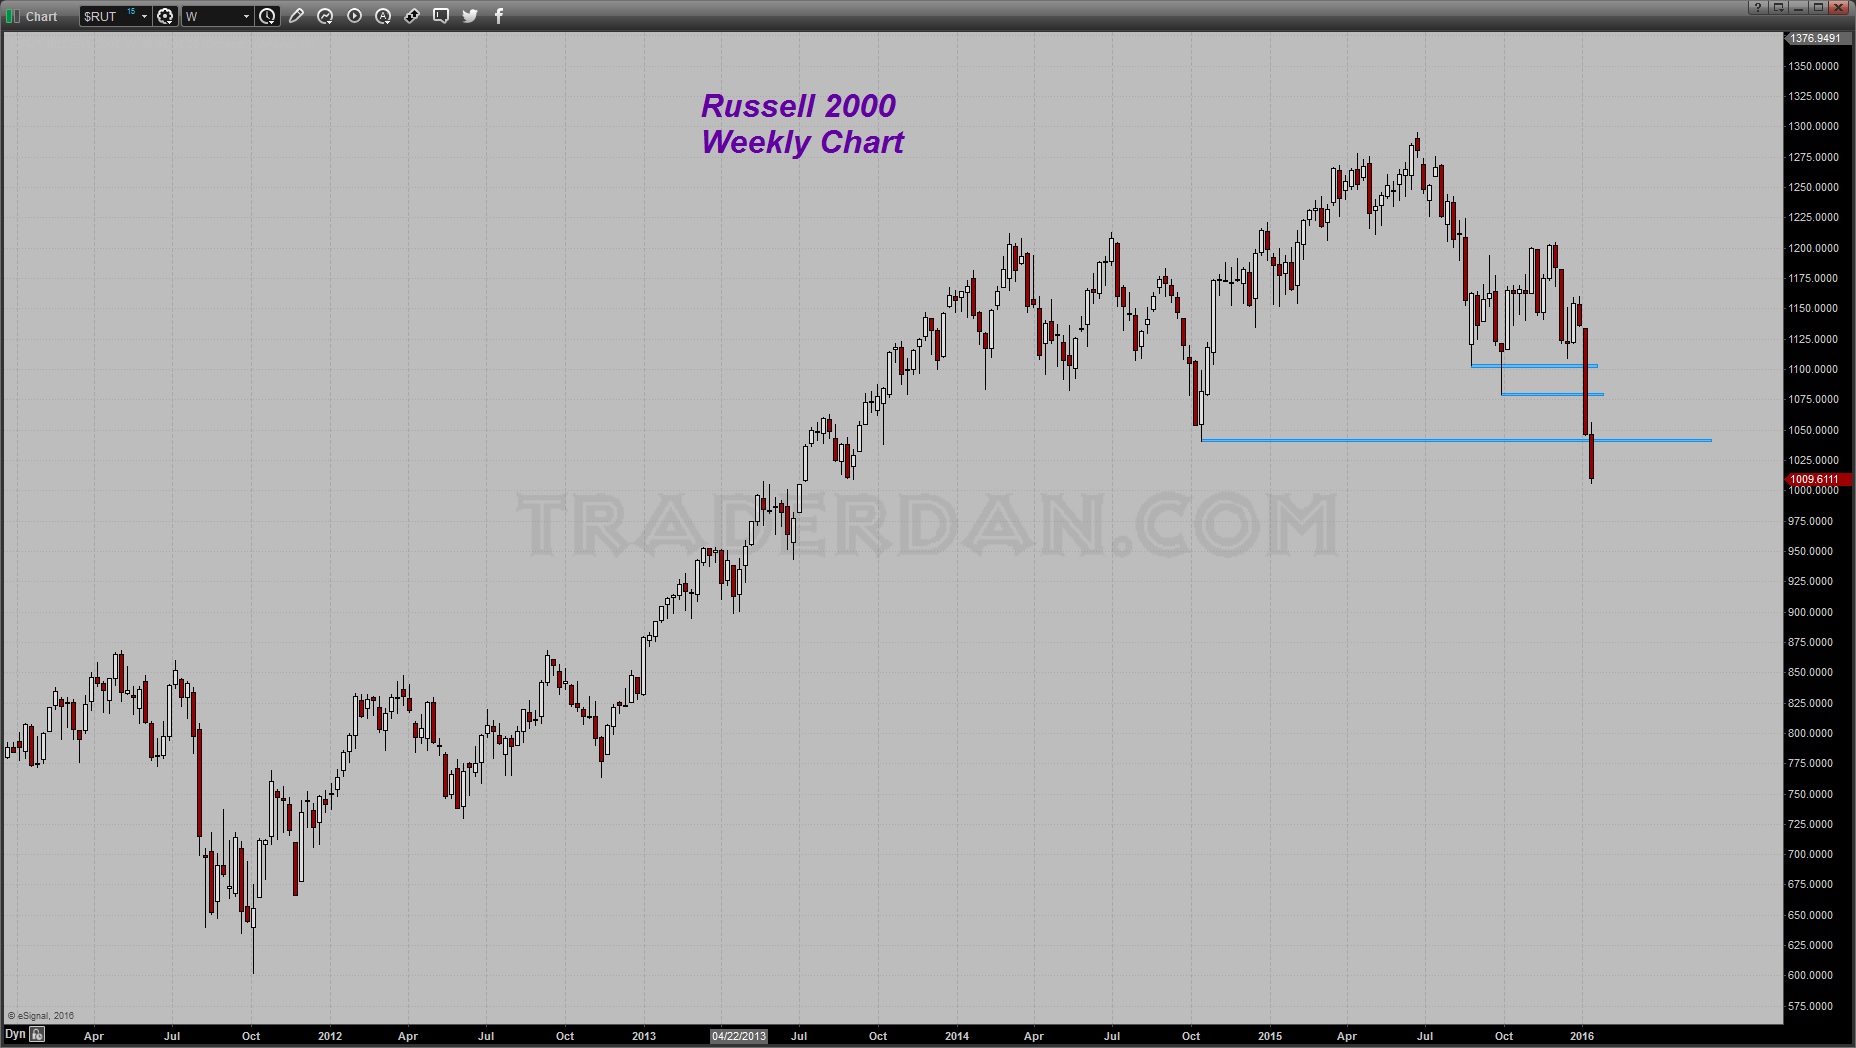
Has that created any fear/panic in the equity markets? Nope! I am not sure what to make of this. Quite frankly, I would actually feel a bit better about the stock market if the VIX were soaring. That would tell us that the emotions of fear/panic are soaring and that much of the selling can be traced to panicking investors. That sort of selling tends to run its course, like a flaming meteor, and then abruptly exhausting itself. This sort of “stealth” bear market has yet to generate any of the sort of flaring emotions that might signal an end to the selling.
If anything, we have yet to see any real panic selling. That is what scares me to be honest!
I wanted to take a quick look at gold here and to do that, I am employing the short term 2 hour chart that I have been using of late. The reason is because it shows the support level in the market very clearly as well as the resistance levels.
Remember, we noted that the $1090 level was an important level because it was the low formed on the day of last Friday’s payroll data. The market then bounced away from that level and moved higher but ran into selling above $1107 and then faded. It then came down, retested $1090 and seemed to hold, at least for half a day.
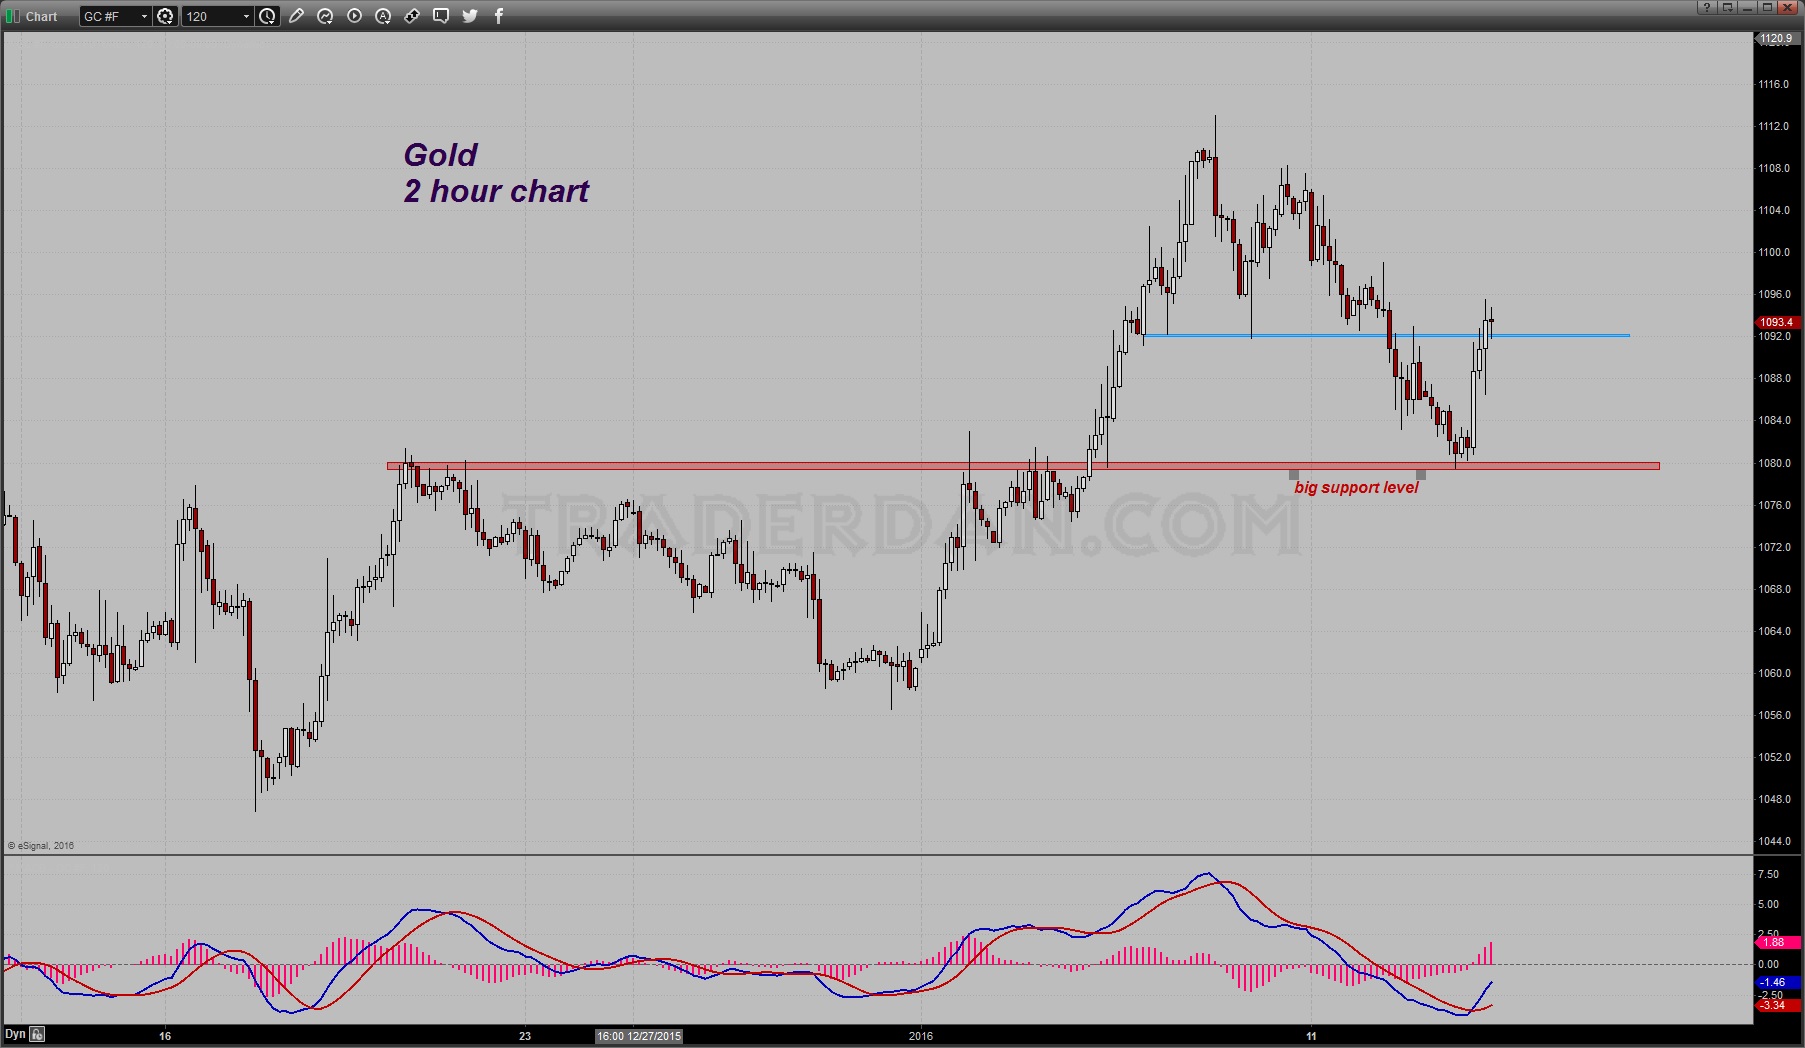
Notice that after it broke down below that level, it then tested the level from below and failed whereupon it then retreated further and fell all the way to $1080, another key technical level.
Today things got interesting. THE market came up to retest $1090 once more after holding and confirming support at $1080 but instead of failing, this time it breached $1090. That is constructive short term. We now have to wait and see if it can keep its footing above that threshold level. If not, back down to test $1080 again it will go.

On the upside, there is some lighter resistance that begins to emerge near $1097 and extends to psychological and round number $1100. Above that and $1108 comes into play once more.
********
Courtesy of Trader Dan http://traderdan.com/


