The NASDAQ's Days Are Numbered Too...


 When you attend the funeral of a dearly departed friend or relative, it is appropriate to show due respect by wearing black. Similarly, in this update on the Tech Sector, which will very soon be on its deathbed, it is appropriate that we show due propriety and respect for the seriousness of the situation by presenting our analysis on somber black charts.
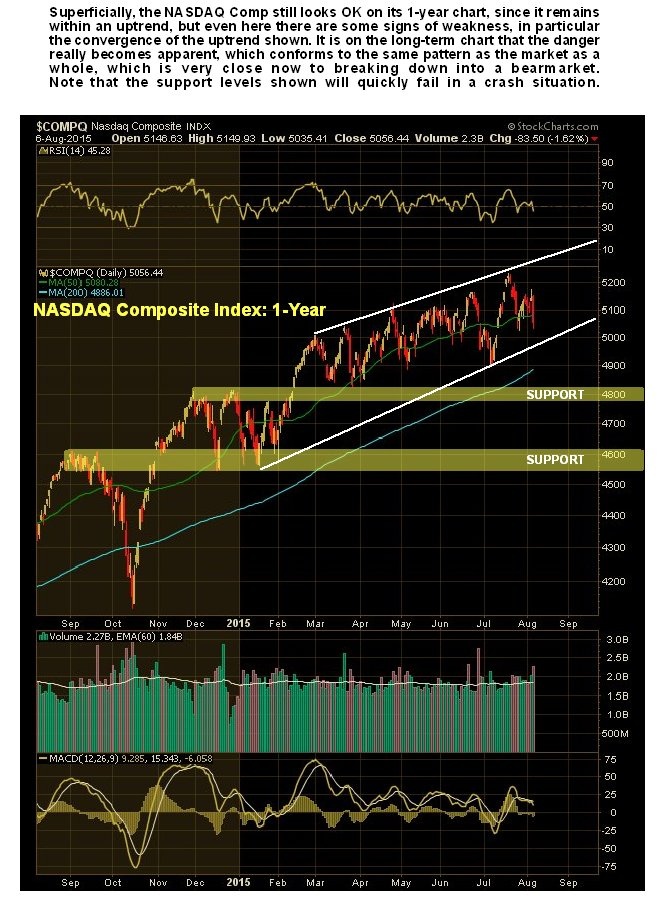
Some investors may have been fooled into thinking that because the NASDAQ Composite index, whose 1-year chart is shown below, is still in an uptrend and recently made new highs, that all is well with the sector, especially as it is outperforming the broad market S&P500 index, which has been treading water all this year in a tight range, as shown on its 1-year chart a little further down the page. However, as we will see on the long-term charts, all is not well at all…and both these indices are now set up to drop hard or crash.
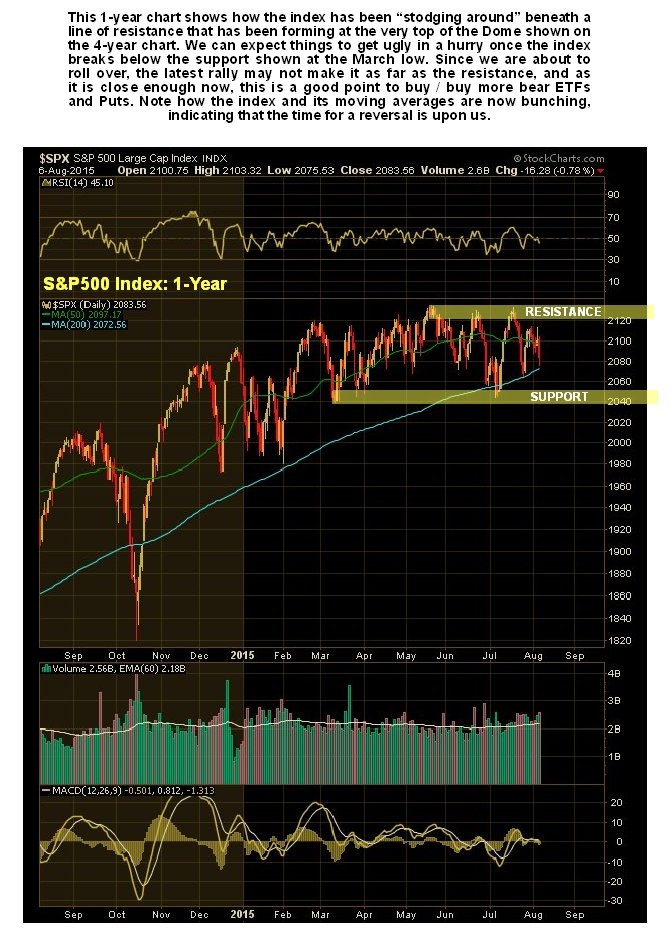
We have already looked at the giant bearish Rising Wedge that is completing on the long-term chart for the S&P500 index in the article Preparing For The CRASH – S&P500 Index Analysis – Inverse ETFs & PUTs Timing that was posted on the site on 31st July, and we need only observe here that it is already at the point of breaking down from this Wedge, a development that is expected to lead to a precipitous decline.
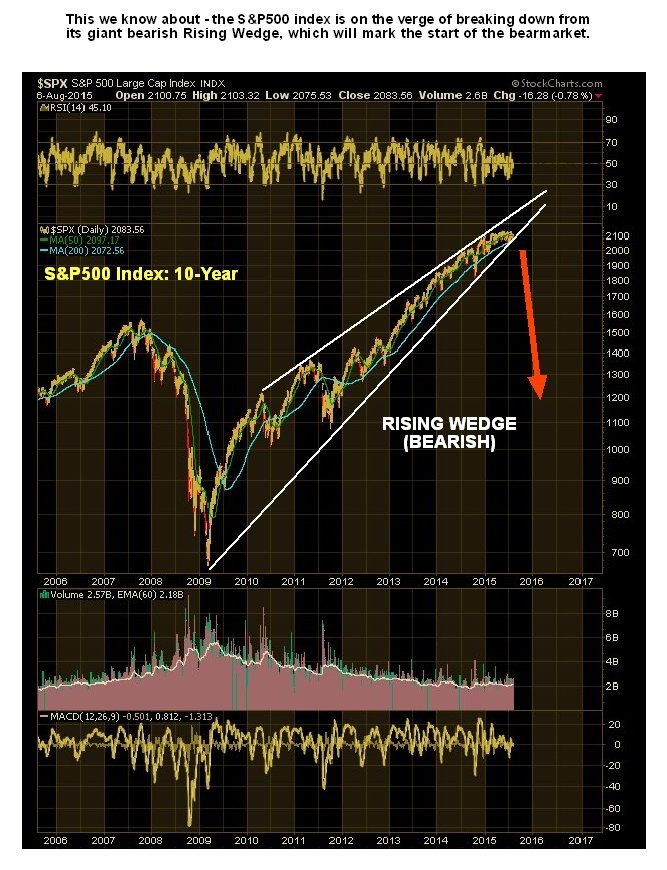
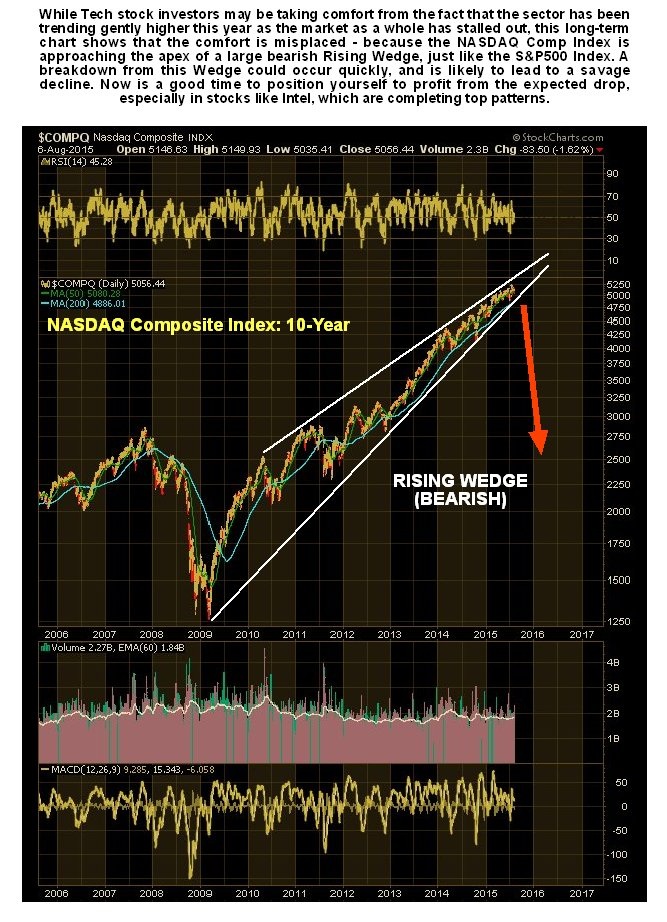
Now, I am sure most readers would agree that it is hardly likely that the S&P500 index should drop hard or crash, and the Tech Sector, as represented by the NASDAQ index, escape unscathed – on the contrary we would expect it to crash too, especially as it is another bubble, and a big one at that. Thus it should come as no surprise that the NASDAQ Composite Index is completing a giant bearish Rising Wedge pattern that parallels the one completing in the S&P500 index, as we can see on its long-term chart below. What this implies is that when the S&P500 index breaks down into a severe decline, the NASDAQ Comp is going to do likewise, and this being so, it behooves us to short (buy Puts) in the weakest stocks in the sector in advance of such a breakdown.
While on clivemaund.com we would never stoop to indulging in black humor, particularly when it involves a subject as serious as this, I can assure you that we are going to have one helluva “Wake” if what is expected to happen comes to pass. That’s because we are going to be short the market in a big way using bear ETFs and Puts, and a range of suitable inverse ETFs has already been described on the site.
On a lighter note, if any of you want to print this out, and avoid the waste of ink involved with printing black charts, I can make a version with light colored charts, just let me know. Please note, however, that lighter colored charts will not alter the gloomy outlook for the market.
Related Articles:
How Much Will The DOW Index Correct In The Developing 2015-2016 Bear Market?
Becoming Battered Billionaires
The Mother Of All Bubbles Will Burst In Late 2015
Preparing For The CRASH – S&P500 Index Analysis – Inverse ETFs & PUTs Timing
********
Courtesy of http://www.clivemaund.com

Clive P. Maund’s interest in markets started when, as an aimless youth searching for direction in his mid-20’s, he inherited some money. Unfortunately it was not enough to live a utopian lifestyle as a playboy or retire very young. Therefore on the advice of his brother, he bought a load of British Petroleum stock, which promptly went up 20% in the space of a few weeks. Clive sold them at the top…which really fired his imagination. The prospect of being able to buy securities and sell them later at a higher price, and make money for doing little or no work was most attractive – and so the quest began, especially as he had been further stoked up by watching from the sidelines with a mixture of fascination and envy as fortunes were made in the roaring gold and silver bull market of the late 70’s.
Clive furthered his education in Technical Analysis or charting by ordering various good books from the US and by applying what he learned at work on an everyday basis. He also obtained the UK Society of Technical Analysts’ Diploma.
The years following 2005 saw the boom phase of the Gold and Silver bull market, until they peaked in late 2011. While there is ongoing debate about whether that was the final high, it is not believed to be because of the continuing global debasement of fiat currency. The bear market since 2011 is viewed as being very similar to the 2-year reaction in the mid-70’s, which was preceded by a powerful advance and was followed by a gigantic parabolic price ramp. Moreover, Precious Metals should come back into their own when the various asset bubbles elsewhere burst, which looks set to happen anytime soon.
Visit Clive at his website: CliveMaund.com


