Negative Gold Camber For The Balance Of September


Per the wording in this week's title, to fundamentally find anything "negative" for Gold these days is a fool's game. Certainly so since price unwound from having gotten ahead of itself nine years ago.
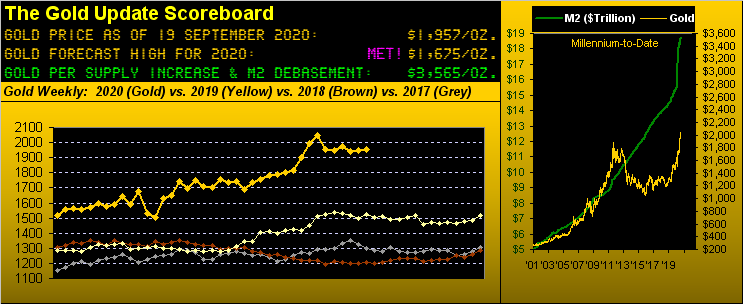
One only need consider the ever-burgeoning state of the 3Ds: Debasement, Debt and Derivatives. And notably so StateSide: the Current Account Deficit for Q2 having just been reported as the deepest since 2006's Q3; the Federal Reserve (not surprisingly) having just stated 'twill increase by at least its current pace the purchases of treasuries and mortgage-backed securities; the money supply (M2 measure) itself having increased just year-to-date alone by a whopping 22.3% (as clearly bespoke by the vertical green spoke in the above graphic's right-hand panel); and the horrid cost of having to pay $1.19 for one li'l ole €uro, an increase of 11.2% over $1.07 just as recently as late April. "Sacré bleu!" even as the EuroZone ramps up its own monetary-accommodative mode.
Through it all, Gold year-to-date in spite of price having gone to sleep of late is rightly +28.8% and indeed as much as +37.4% per the 07 August All-Time High of 2089. 'Course more broadly, Gold ought be +77% higher still per the above Scoreboard's 3565 valuation than the actual 1957 at which price settled yesterday (Friday).
However to technically assess Gold's present state, in the title is the word "camber", invoking the notion of lines and bends and convexity, such as (placed base-to-base) the parting of a pair of skis between their kissing at tip and tail. And there is a technical tale that we now avail toward Gold's gliding with a negative bend into September's end.
'Course were technicals to always will out, we'd all be rich, (or more realistically there'd be no market with everyone on the same side of the trade). Either way, here we've two charts displaying technical studies highly-visible to the trading community at large, comprised and reacted to by both humans and algorithms alike. The first is our more familiar graphic of Gold's weekly bars from one year ago-to-date. And thereon we see a fourth-recorded red dot of parabolic Short trend, the price bars themselves now struggling to stay above the rising diagonal trend line, (itself a wonderful sight to behold, albeit as history has told, price over time works both sides of that fold):

The second is also a classic technical study known far-and-wide as moving average convergence divergence ("MACD"). To wit, this next graphic again shows Gold's daily weekly bars, below which are a blue line and a red line that characterize the MACD. Simply stated so as to spare you the math, when the blue line crosses beneath the red line -- which looks due in a week's time -- 'tis the tendency of the trading herd to sell. (Dare we say were the late great Mrs. H.S. Baillie alive today [at 100], she'd refer to this following portrayal as "quietly elegant"). Here ya go, Mum:
"That's looming fairly large there, mmb..."
Agreed Squire. Let's go inside the numbers. For the blue line not to have crossed the red line in a week's time, Gold's price must settle next Friday (25 September) at 1978.7 or higher. I.e. Gold requires a net gain of at least 21.6 points (above the present 1957.1 price) to avoid the lines crossing one another come the close next week. Sleepy Gold's weekly trading range has narrowed in four of the past five weeks, and in three of the past five weeks the net change has been less than 10 points. Thus Gold buyers need to step it up this week, else prepare for price turning weak.
Which begs the question, "How weak may weak be?" Fortunately you've come to the right place wherein we dig deeply into such analyses. Being ponderous as this MACD study is on a weekly basis, the amount of time between line crossings can be lengthy. In going back better than one year, there have been three confirmed occasions of the blue line crossing beneath the red line, Gold's resulting performance in each case as follows:
■ From 08 April 2019 to 10 June 2019 (nine weeks): price adversity as much as -28.5 points
■ From 14 October 2019 to 13 January 2020 (13 weeks): price adversity as much as -45.8 points
■ From 16 March 2020 to 06 April 2020 (three weeks): price adversity as much as -112.9 points
Note the most recent of those stints was the shortest (pun aside) by duration but the most by adversity, the price of Gold being 1563.8 upon the blue line crossing below the red line, before plunging to as low as 1450.9.
And not to belabour the point, but as pointed out from StateSide Labor Day to Thanksgiving throughout this decade, 'tis regularly been a negative stint for Gold. The good news is, naturally, that past performance is not indicative of future results. Moreover given the ongoing ultra-positive fundamental foundation for Gold, here's to our negative analysis not panning out a wit!
But beginning to pan a bit is the track of the Economic Barometer. As herein cautioned a week ago: "...'Tis important to bear in mind that the Econ Baro proceeds as an oscillator rather than as an index, meaning that it shan't keep climbing in perpetuity. Baro negatives include metrics growing more slowly, prior period downward revisions, and consensus misses..." And this past week's slew of incoming economic stew did the Baro rue. For August: Retail Sales, Housing Starts and Building Permits all saw their growth slow, all missed consensus estimates, and all saw their July performances revised lower, albeit some early September sentiment indicators perked up. But net-net, 'twas net down for the Baro. "Hummm..." indeed:
The big takeaway on Wednesday from the Federal Open Market Committee's policy statement and Chair Powell's presser was that nothing surprising was stated: the road to a fully-employed economy is long (when is it not?); rates may remain benign into 2023 (the rising long-end of the yield curve suggesting otherwise); and the Fed can't be expected to do everything "Please [Congress] release me, let me go..." --(Eddie Miller, et alia, '49).
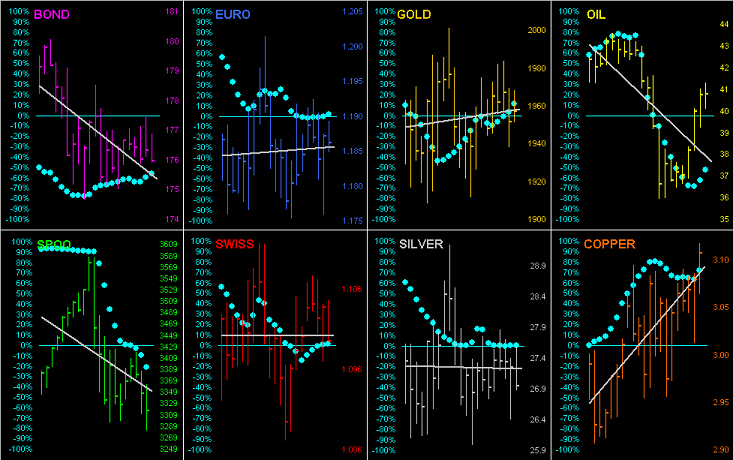
As for the BEGOS Markets at large, let's go 'round the recent horn with the entire bunch. Here are their respective daily bars for the past month-to-date, their diagonal grey trendlines, and their "Baby Blues", the dots which depict each trend's consistency. Look at the trendline for the Swiss Franc, as flat as we'll ever find it, price dithering either side of $1.10 (and the Dollar Index itself hovering mere pips around 93-dead for nearly eight weeks). Obviously Copper of late is the star whereas Oil's fallen far. The downward acceleration of the Spoo's (S&P 500's) "Baby Blues" suggest lower prices to still ensue, (but after all, 'tis September). Moreover, the S&P's moneyflow (should you peek at its page on the website) has really come off the boil. Recall how the moneyflow had outperformed the Index strongly to the upside during August? Now 'tis all whirled 'round in goin' back down. As for Gold, its grey trendline has rotated to mildly positive; however as the leftmost days roll off the chart, save for price getting back above 2000, such trend shall resume down, (but again, 'tis September: and those two aforeshown weekly studies are pushing negatively):
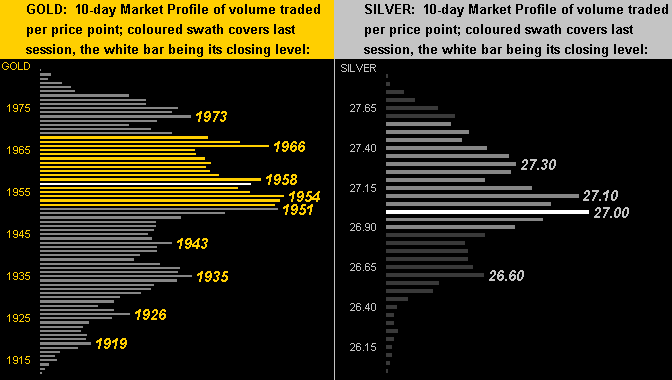
To the 10-day Market Profiles we go, their overall stance remaining similar to recent weeks given prices having somewhat gone to sleep. Clearly for Gold on the left, trading volume is dominant in the 1950s; for Silver on the right, such dominance is in the low 27s. Bear (pun intended) in mind that should Gold fall from this Profile range, the next structural foothold as we've repeatedly noted is 1830, which -- should the looming negative technical of the weekly MACD crossover be confirmed in a week's time -- seems a reasonable downside target:
We're thus feeling a bit Gold-bearish near-term, strictly from the technicals. By the fundamentals we're ever so broadly bullish. But again ad nausea, from the seasonality seen this past decade, the trend-to-date coming into Fall is for Gold's price to fall. Yeah, ya might negate negative Gold September camber in putting on yer "cool" by joining the "in crowd" and buying some green bonds with yer bits**t ... OR (Gold en français): you can further convert those withering Dollars into Gold at attractive prices!
www.deMeadville.com
www.TheGoldUpdate.com
********

Mark Mead Baillie has had an extensive business career beginning in banking and financial services for two years with Banque Nationale de Paris to corporate research for three years at Barclays Bank and then for six years as an analyst and corporate lender with Société Générale.
For the last 22 years he has expanded his financial expertise by creating his own financial services company, de Meadville International, which comprehensively follows his BEGOS complex of markets (Bond/Euro/Gold/Oil/S&P) and the trading of the futures therein. He is recognized within the financial community of demonstrating creative technical skills that surpass industry standards toward making highly informed market assessments and his work is featured in Merrill Lynch Wealth Management client presentations. He has adapted such skills into becoming the popular author each week of the prolific “The Gold Update” and is known in the financial website community as “mmb” and “deMeadville”.
Mr. Baillie holds a BS in Business from the University of Southern California and an MBA in Finance from Golden Gate University.
More from Gold-Eagle


