News For An Inverted Pyramid


Estimates of the volume of the global market for financial market range from 700 Trillion dollars to upwards of 1.5 Quadrillion dollars. For comparison, the combined market cap of Wall Street and the NASDAQ is about $50 trillion – from about 7% down to 3% of the amount of derivatives. Even adding in the amount of US 10-year Treasuries and the financial assets of the rest of the world would still mean that the financial derivatives market is an upside down pyramid – a vast amount of financial weight resting on a quite small base of financial assets. A quite small nudge could take it down.
The COVID-19 situation in the US has again become a cause for concern. The trend in daily infections has increased during the past month during which the number has doubled. New daily deaths were in decline during the first three weeks, but has jumped at the end of last week. The rising trend in new cases would be troubling, even if the latest mortality is a wayward spike that is not a start of a new trend.

Sooner or later this trend will cause workers to be compelled to remain at home. It might be thought that it would be OK if only older people, say over 60 or 65 had to stay in isolation because they are really vulnerable. However, reports say all people who are overweight or suffer from diabetes and heart related problems are also at risk. These groups of often much younger workers would also have to be released to remain at home in isolation, or at least not be welcome back on the job.
That would make a real dent in the available labour force and cause the effort to re-start the economy to stumble. Further interruptions before the full labour force can get back to work sooner or later will make it impossible to sustain the high levels of the stock markets. If that were to happen, the new bear market will have severe political implications. Is this the kind of situation where governments throughout all the ages have considered war as the means to muster the population’s loyalty and fear in support of the country and the government?
I am not privy to the reasons why large financial institutions find it advantageous to take on many billions and trillions of financial derivatives despite a well known risk posed by unexpected dislocations in one or other financial market. However, it is near certain that they are willing to do so because the future is believed to be truly uncertain. The Efficient Market Hypothesis informs that the history of a price cannot be used to predict its future behaviour. Economists also know from experience that
leaves a bitter taste how difficult it is to predict what an economy will do over time.
This uncertainty leaves the door open for the employment of statistics to try and obtain a view of the future. We know what Mark Twain said about lies and statistics and that implies the forecasts on which institutions base the decisions with respect to derivatives are on shaky ground. Below is my attempt to peer into the future of the price of gold.
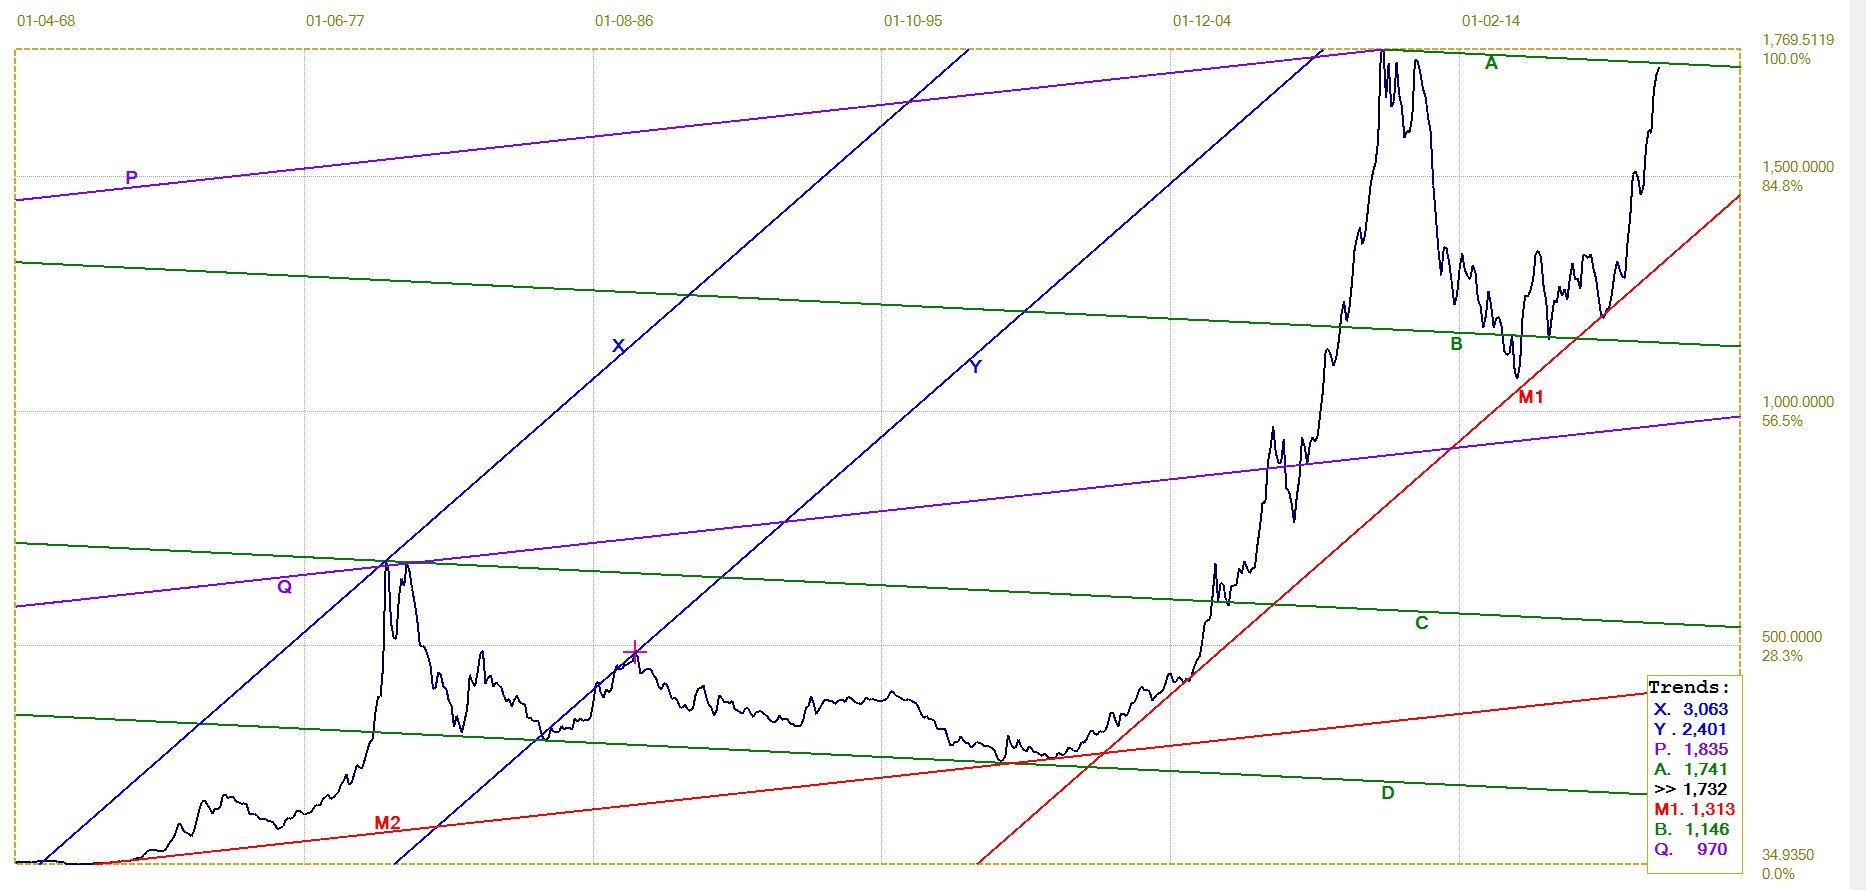
London PM fix. Monthly average. Last = $1732.22 (June)
This example is generated according to an algorithm that I used in a paper that has been accepted for publication in a peer-reviewed academic journal. This means that the reviewers of the paper accepted the algorithm used to generate the examples is scientifically sound and the examples present the consistent and accurate results for it to be accepted for publication. This academic paper might be the very first one ever on pure technical analysis that is accorded this distinction.
The crux of the paper is that the algorithm that is used to generate the examples result in channel pairs – three adjacent parallel lines located in significant chart points – that have ratios of 500:500 of a channel divided in equal halves, 382:618 of the Fibonacci ratio and a 400:600 ratio. The match of the ratio with the preset ratios have to differ only in the third number of the ratio for an accuracy of 1%. All the trend lines had to be derived from the same master gradient
Here two different master gradients are used to try and anticipate future levels of resistance for the dollar price of gold. The ratios of the channel pairs are as follows:
XYM1 378:622, which is close to the Fibonacci ratio; PQM2 604:396, close enough to the 400:600 ratio and ABC 499:501, BCD 621:379 which are near the 500:500 and Fibonacci ratios. The Trends table as usual provides values of the respective trend lines for the next period, which is the average for July. It is evident that if the price of gold can be held near current prices, or better, that there will be a decisive break above channel AB. There is even a good chance that for the month it could break above channel QP, which currently is resistance at $1835.
Channels BA and CB are of equal width and another of the same width would have the monthly average for the price of gold at $2336. On the other hand, if the next level of resistance is higher above line A by the width of channel DC, the whole set will be symmetrical – something that was also seen in the examples in the paper. That would imply a lower target, at $2106, still more than 21% higher than what it was in June.
It is not possible to set a time frame for the move up to the resistance levels from the above analysis. However, since the current rally started 22 months ago off an average $1198 in September 2018 the gain of $534 implies that the gradient of the rally is about $24/month, which is approximately the increase during May and June. If gold can hold above $1800 for July, the jump will be much greater, as if the rally is picking up speed. That would shorten the time until the resistance is tested.
This brings us back to the inverted pyramid of financial derivatives. Validation of my long time research by the paper being accepted for publication – a link to it will be provided here as soon as it is available – means that there exists a consistent and accurate long term structure in market prices. Where there is structure, one can make predictions. Can an institution accept an offer from another for a very large nominal amount if it had any suspicion that the other institution has set a trap because it had done structure analysis and is confident it has a pretty good idea where the price will reverse trend, in its favour?
Euro–Dollar
The euro bear market in channel AC ended in a broad and volatile consolidation in the steeper bear channel UVW ($1.1211). Line E ($1.1319) three times stopped a euro rally cold and did so the last time during the past week. The euro first had to struggle to break higher from channel UV and, when this was accomplished, it sped up in a steep rally that again failed to break above line E and also hel at line W.
After having marshaled some strength, holding in channel DE, the euro broke above bear channel UVW, but has now being held again at line E. There is effectively a skew triple top along line E and if the euro do manage to break higher it could be expected to break above resistance at lines R ($1.1365) and F ($1.1483) and then break into the steeper bull channel JK ($1.1514).
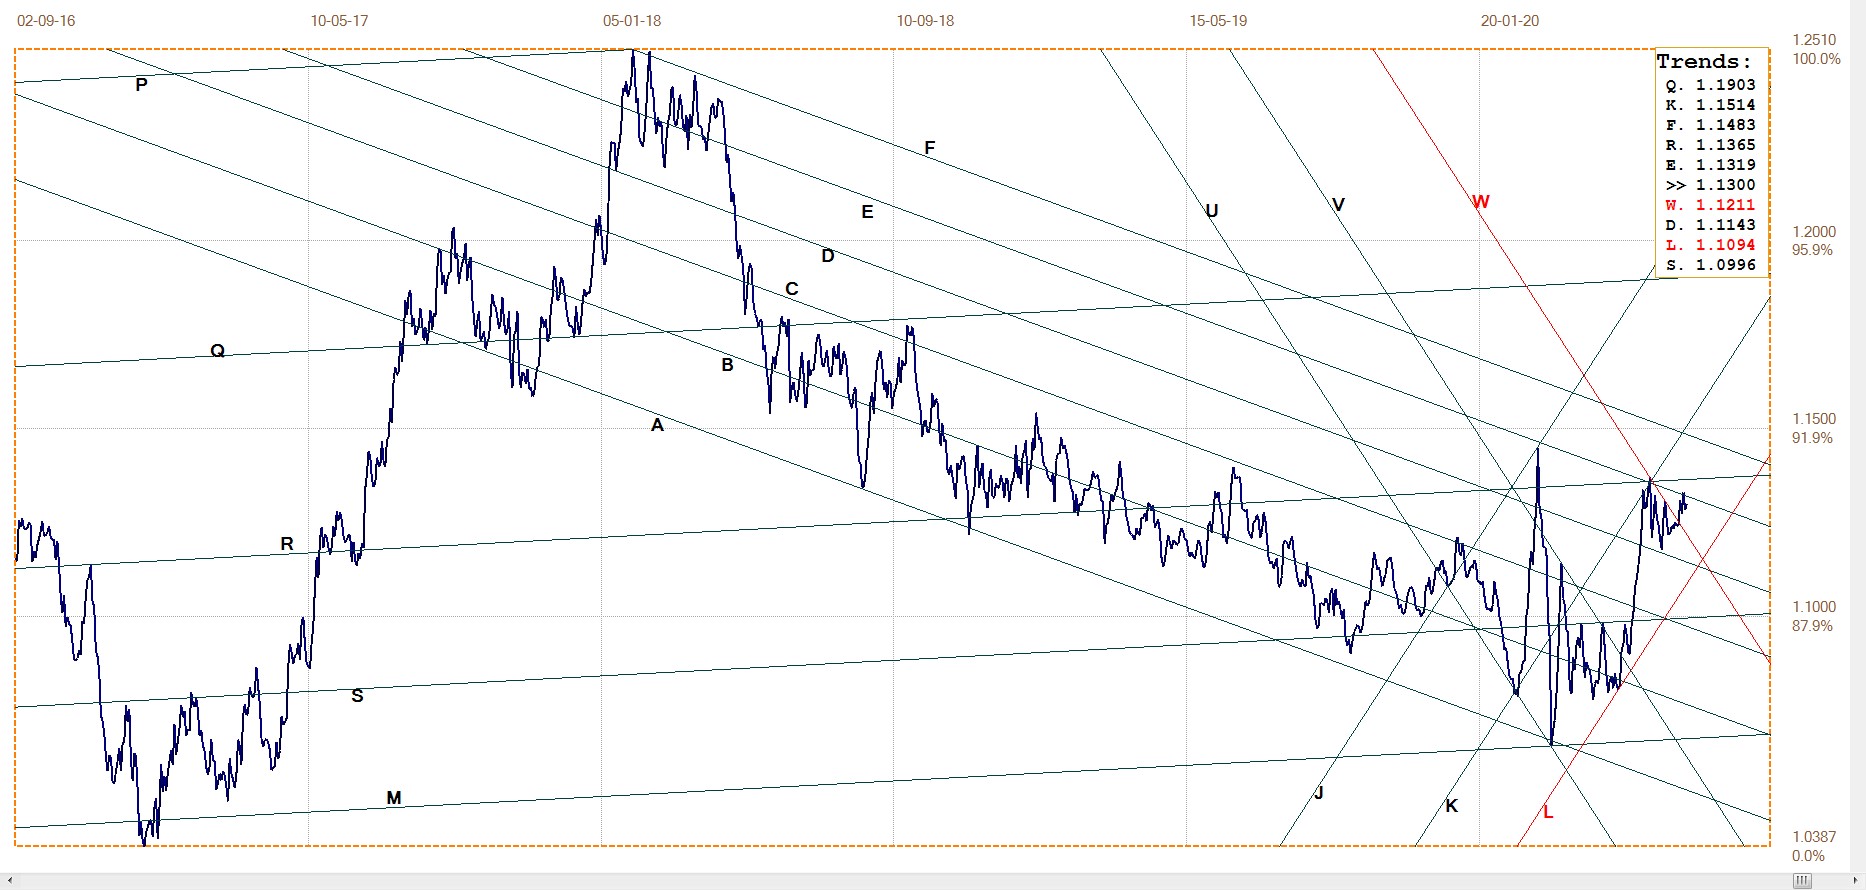
Euro–dollar, last = $1.1300 (www.investing.com)
DJIA Daily close
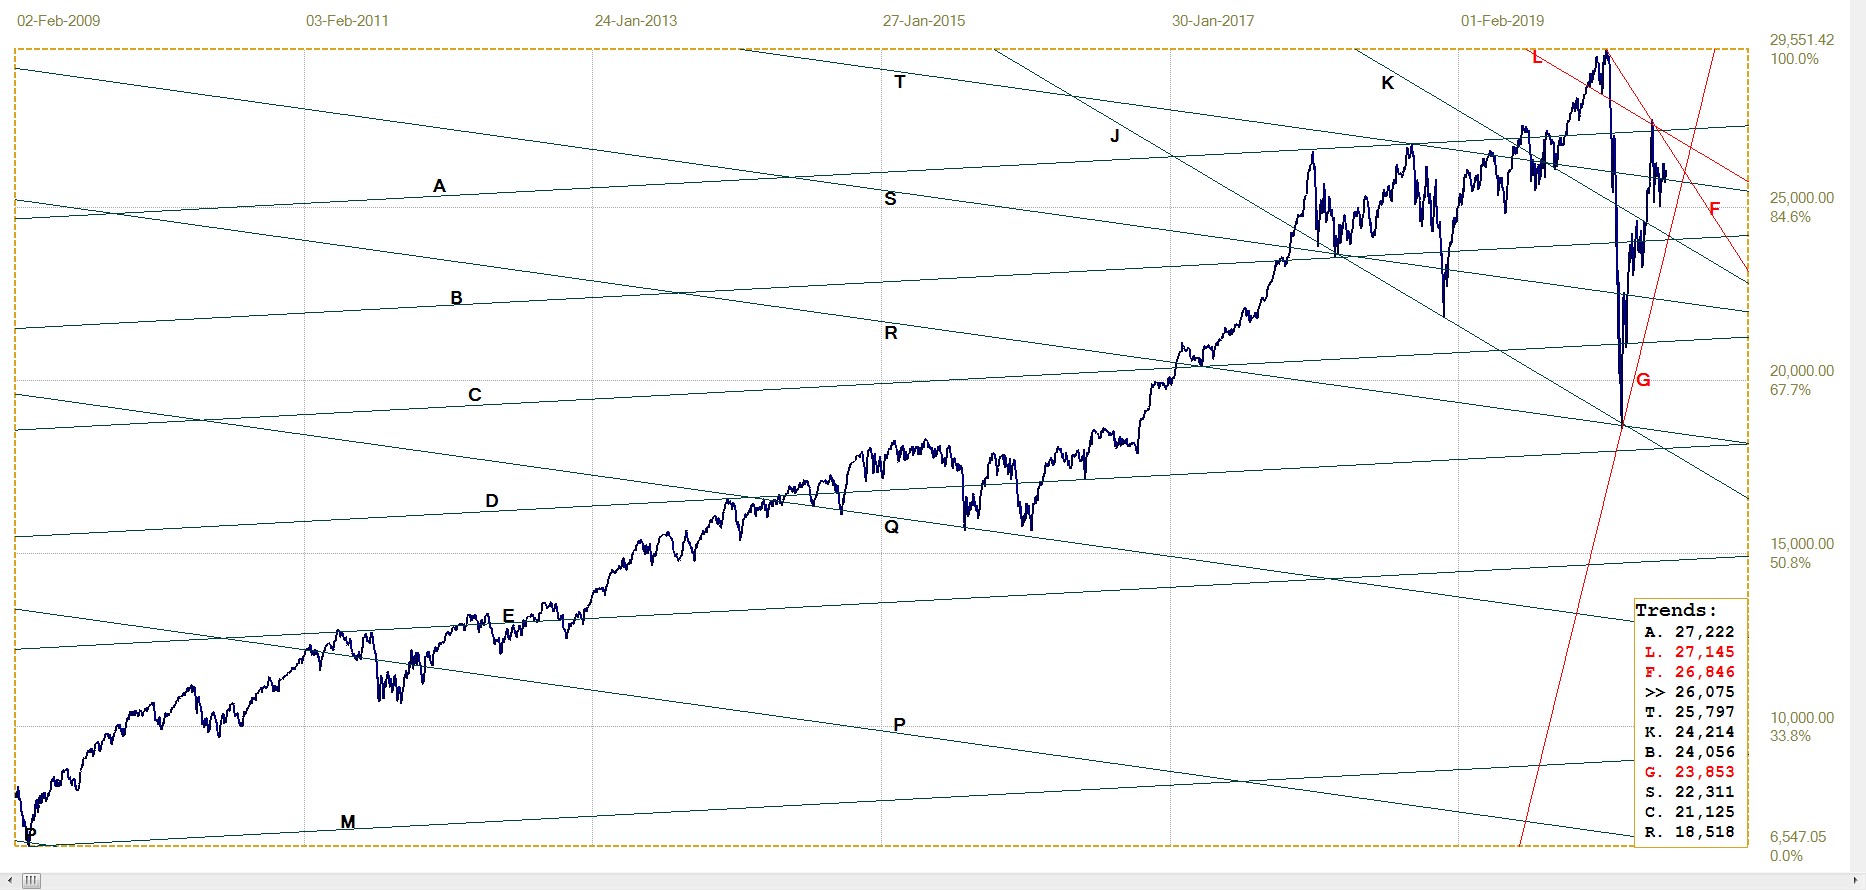
DJIA, last = 26075.30 (money.cnn.com)
The minor break above resistance at line A (27 222) failed to hold so that the DJIA had to pull back to find support more than 1000 points lower at line T (25 797) and then tries to hold the psychological support of 26 000. All dips are strongly attacked by determined buying and the DJIA managed to end last week back above the large round number, but only just. Should the steady increase in COVID infections sooner or later restrict the efforts to have workers back on the job to restart the economy, it will become increasingly difficult to contain a panic on Wall Street.
The PPT managed to reverse steep sell-offs in December 2018 and again in March this year, but will they be able to do so a third time? The PPT has deep pockets backing them and they are probably able to sell at a profit once they have the bull market running with enough momentum – but, as the chart shows, there are times when the selling gets intense and the market requires solid support not to sink into a new steep bear trend. With almost four months to come until the election, further disruption of the US economy conceivably could see the PPT becoming the majority owner of wall Street.
Gold London PM fix – Dollars
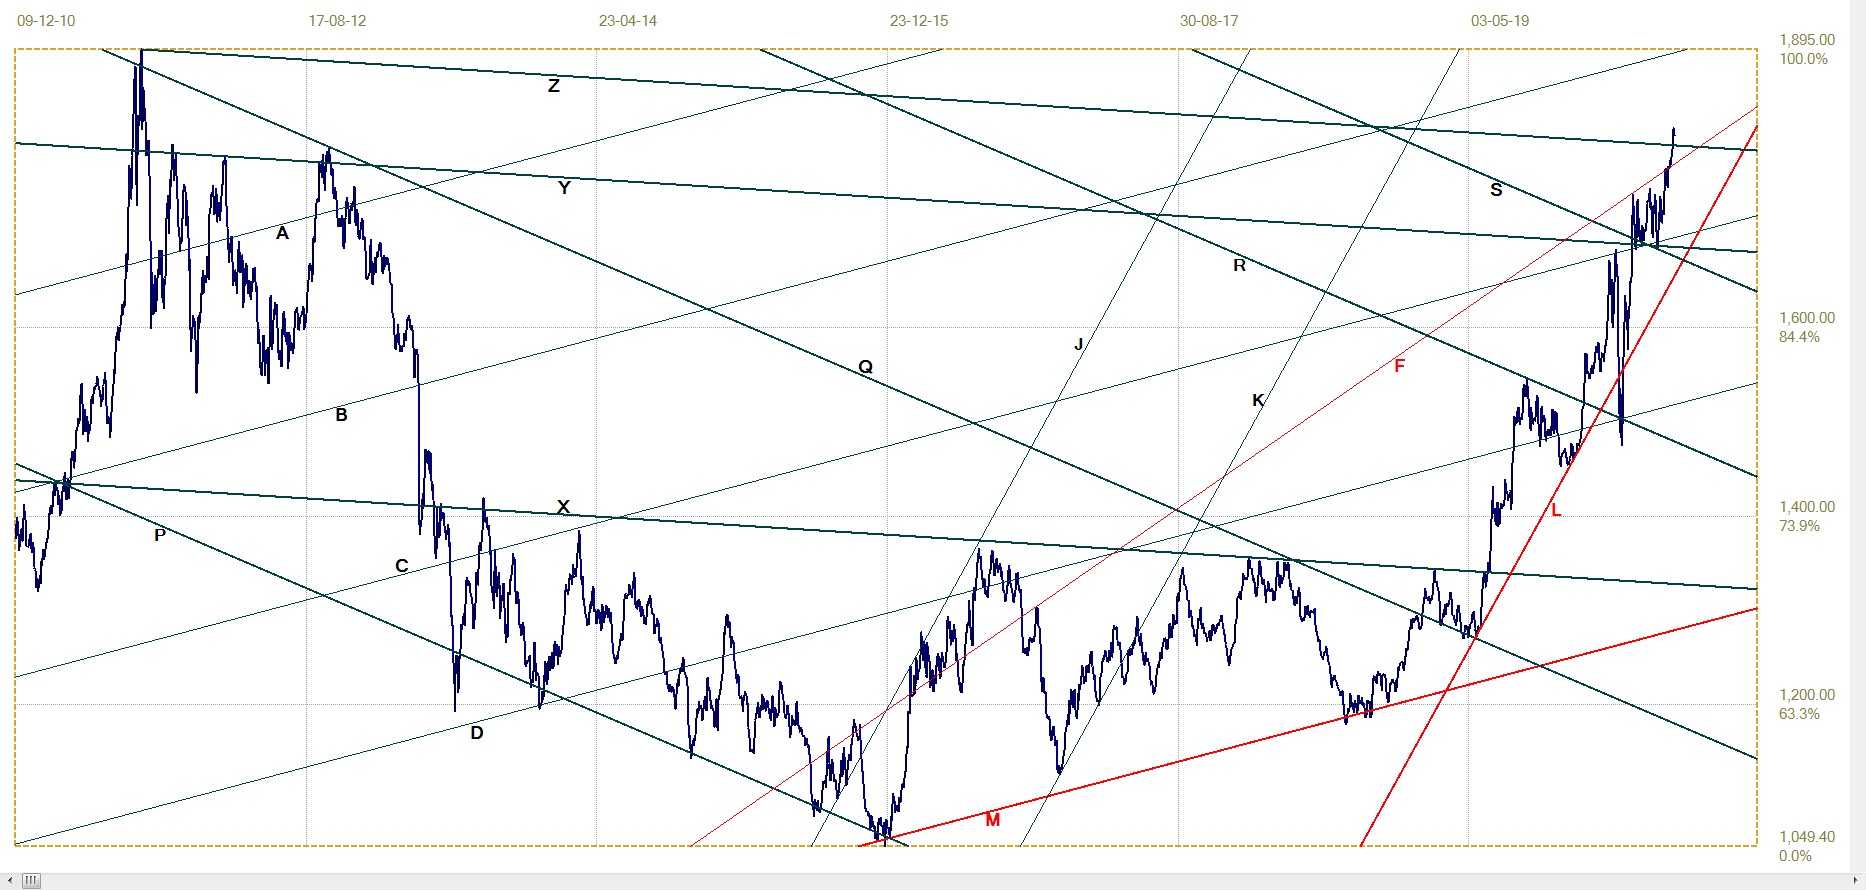
Gold price – London PM fix, last = $1803,10 (www.kitco.com )
The minor and brief break above line F ($1774) ten days ago was a promise of what could and did happen last week. Not only did the price of gold break back above line F, it also broke above line Z (1793) and the $1800 level. The break above channel XYZ is significant and one can hope that it will hold – BUT . . .
The Comex attacks on the price continue at the regular times of day and they have become quite stringent, but that could not stop the price from recovering quickly in most cases and usually to each new highs. The evidence of sustained buyer interest in all gold related products means that whatever setbacks do occur, the bull trend is well supported and should extend into new territory for the price in the near future.
Euro–gold PM fix
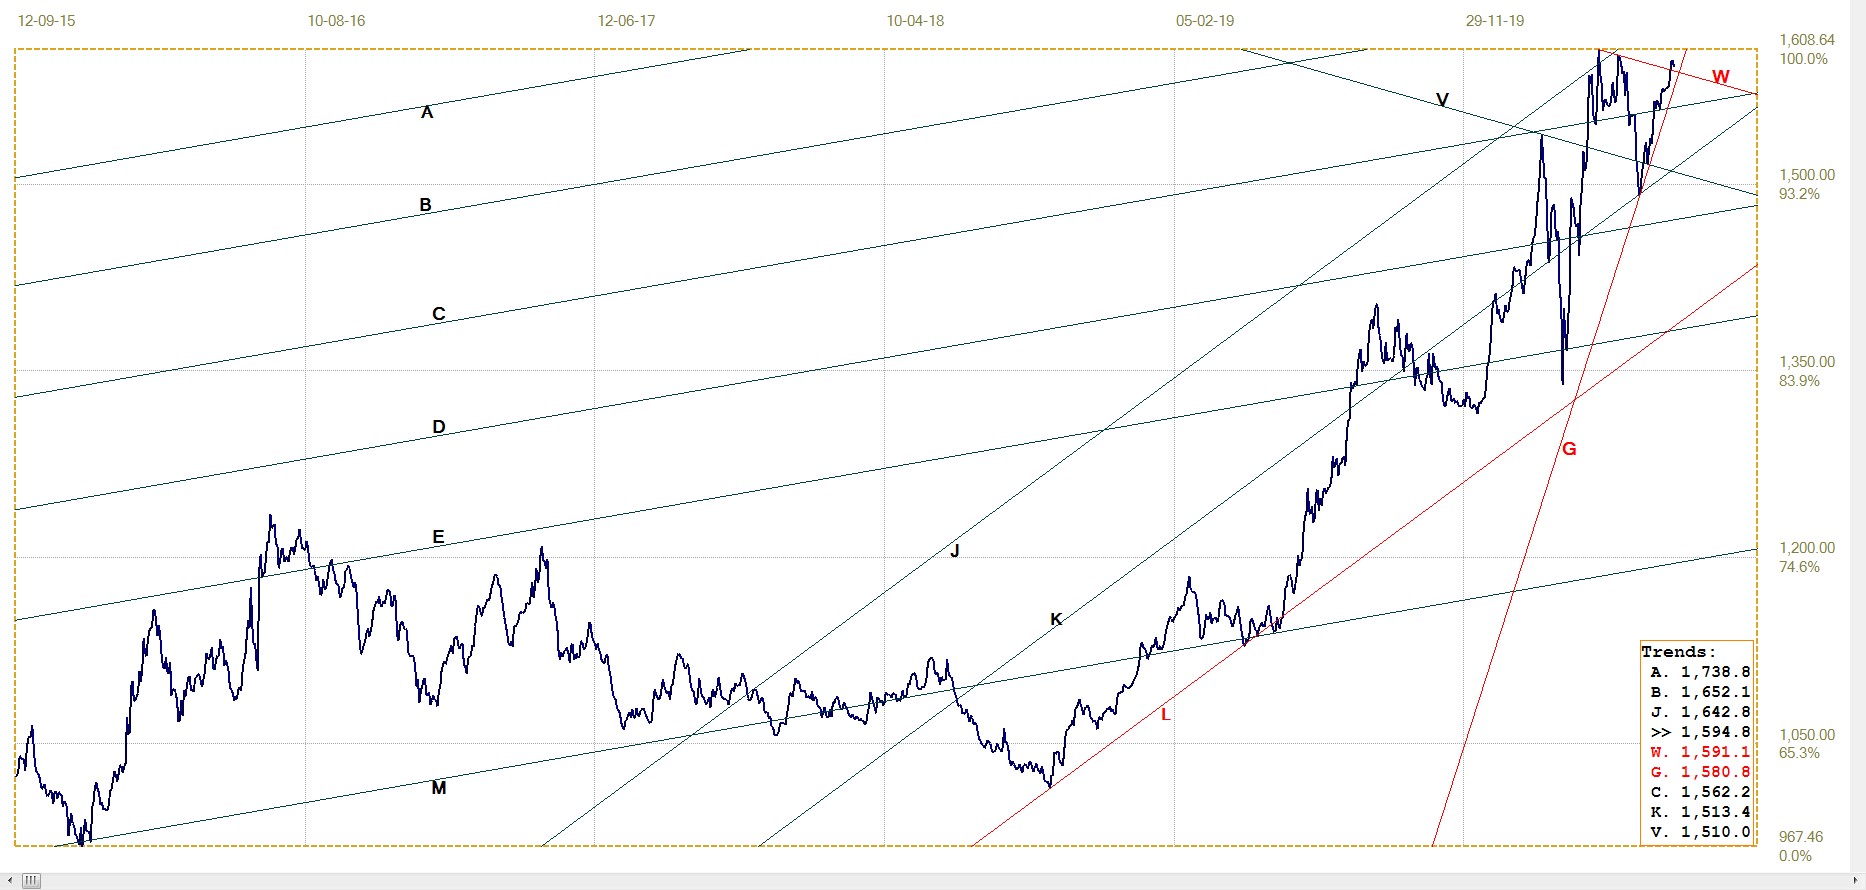
Euro gold price – PM fix in Euro, last = €1594.84 (www.kitco.com)
The euro ended last week close to new intermediate highs it achieved last week. the fact that it nevertheless managed to hold above line G (€1581) and break above channel VW (€1591) is an indication that the price of gold is inherently bullish and not simply gaining ground on dollar weakness. This confirms that the Cartel is in retreat, despite the regular daily attacks which often are repeated to catch early buyers, keen to buy at a good price after the first attack, on the wrong foot and trigger their stops.
Line G has been close support ever since the start of the rally off line K (€1513) back in early June. A break below line G will not be a sell signal, since it appears to be too steep to be sustained too long. When that happens, a new analysis might be required to identify a new bull channel that is not as steep as line G, yet steeper than channel JK. A break above the recent high at €1608 will also be welcome.
Silver Daily London Fix
Last week the London silver fix rallied from $18.02 the week before to $18.77 last Friday and in the process managed to break above resistance at lines W ($18.33) and C (18.65). Despite the price of gold also rallying, the G/S ratio has fallen to 96 from the 125 peak not do long ago. This is promising and we can hope to see a new intermediate high above $19.305 soon top open p the way to a test of the $20 level. .

Silver daily London fix, last = $18.77 (www.kitco.com)
U.S. 10–year Treasury Note
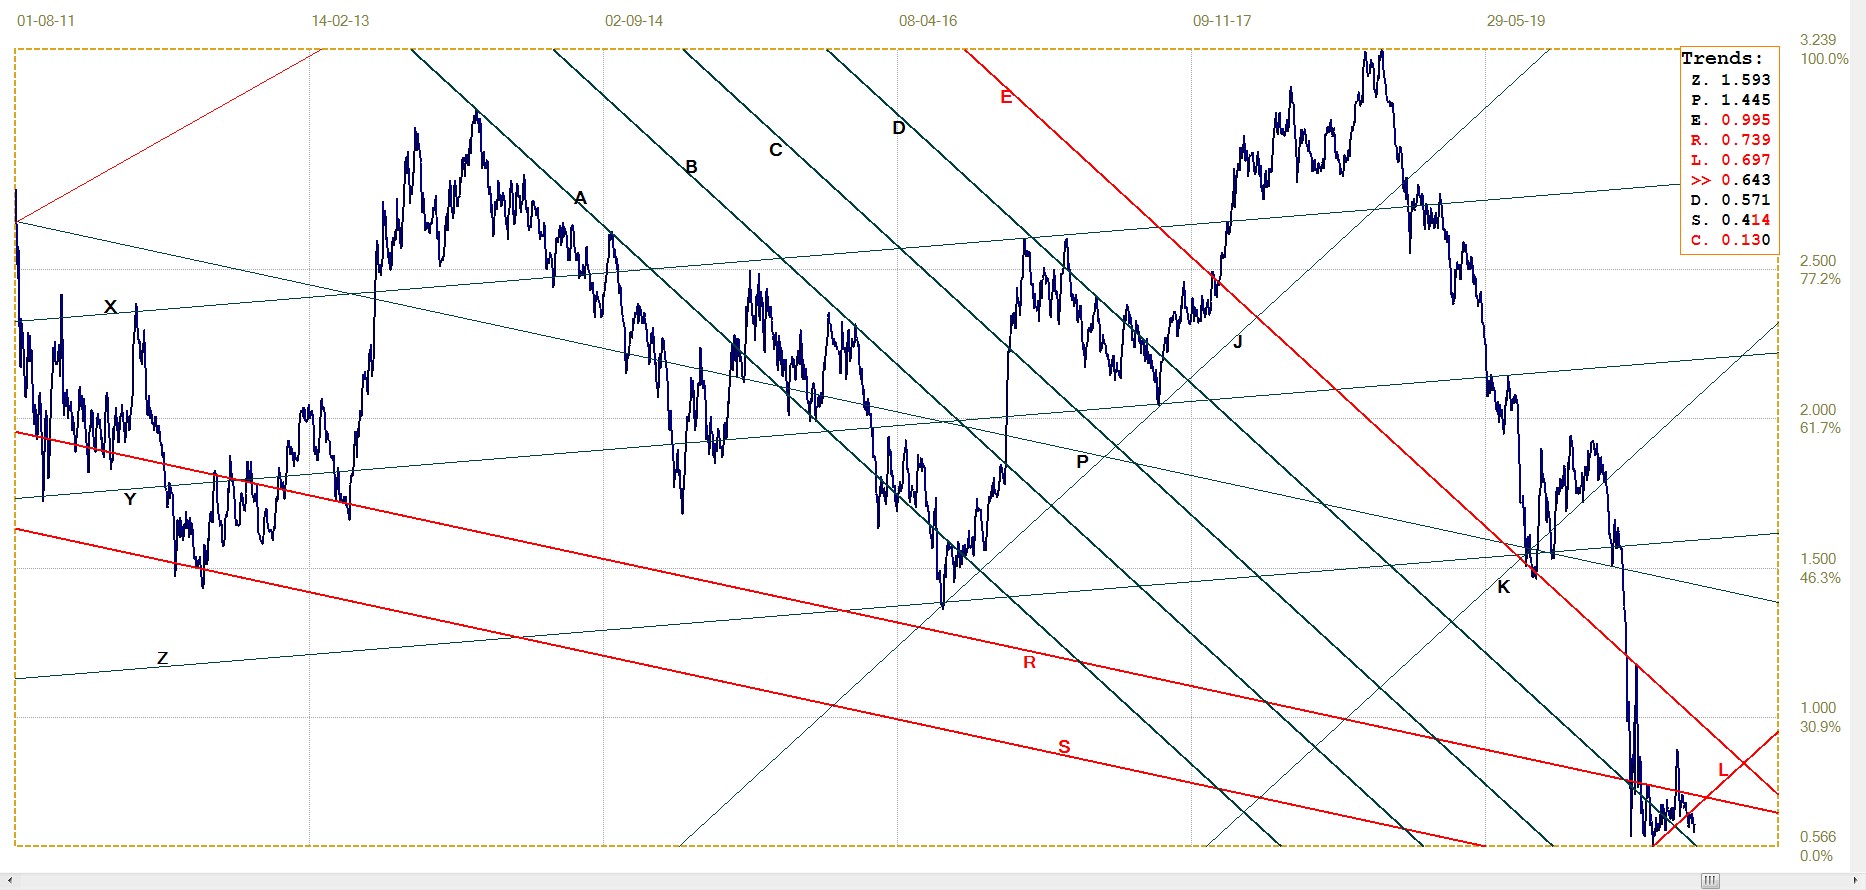
U.S. 10–year Treasury note, last = 0.643% (www.investing.com )
Since the break below channel KL (0.697) on 26 June, the yield on the US 10-year Treasury note has remained below that watershed for all of the last two weeks. On Thursday the yield came closer to testing the 0.600% level, dipping to 0.613% before closing higher on Friday.
This is still a long way to go before the yield can descend into negative territory, but the price of these Treasuries and the risk of a weaker dollar surely must have foreign holders of Treasury notes lying awake at night wondering whether it might be better to take profit. Easy to decide, if only they had some place else to park the money – and gold is not yet on their radar. If the gold bull continues and begin to attract wider investor interest, such a switch could become very attractive to the foreign investor.
West Texas Intermediate crude. Daily close
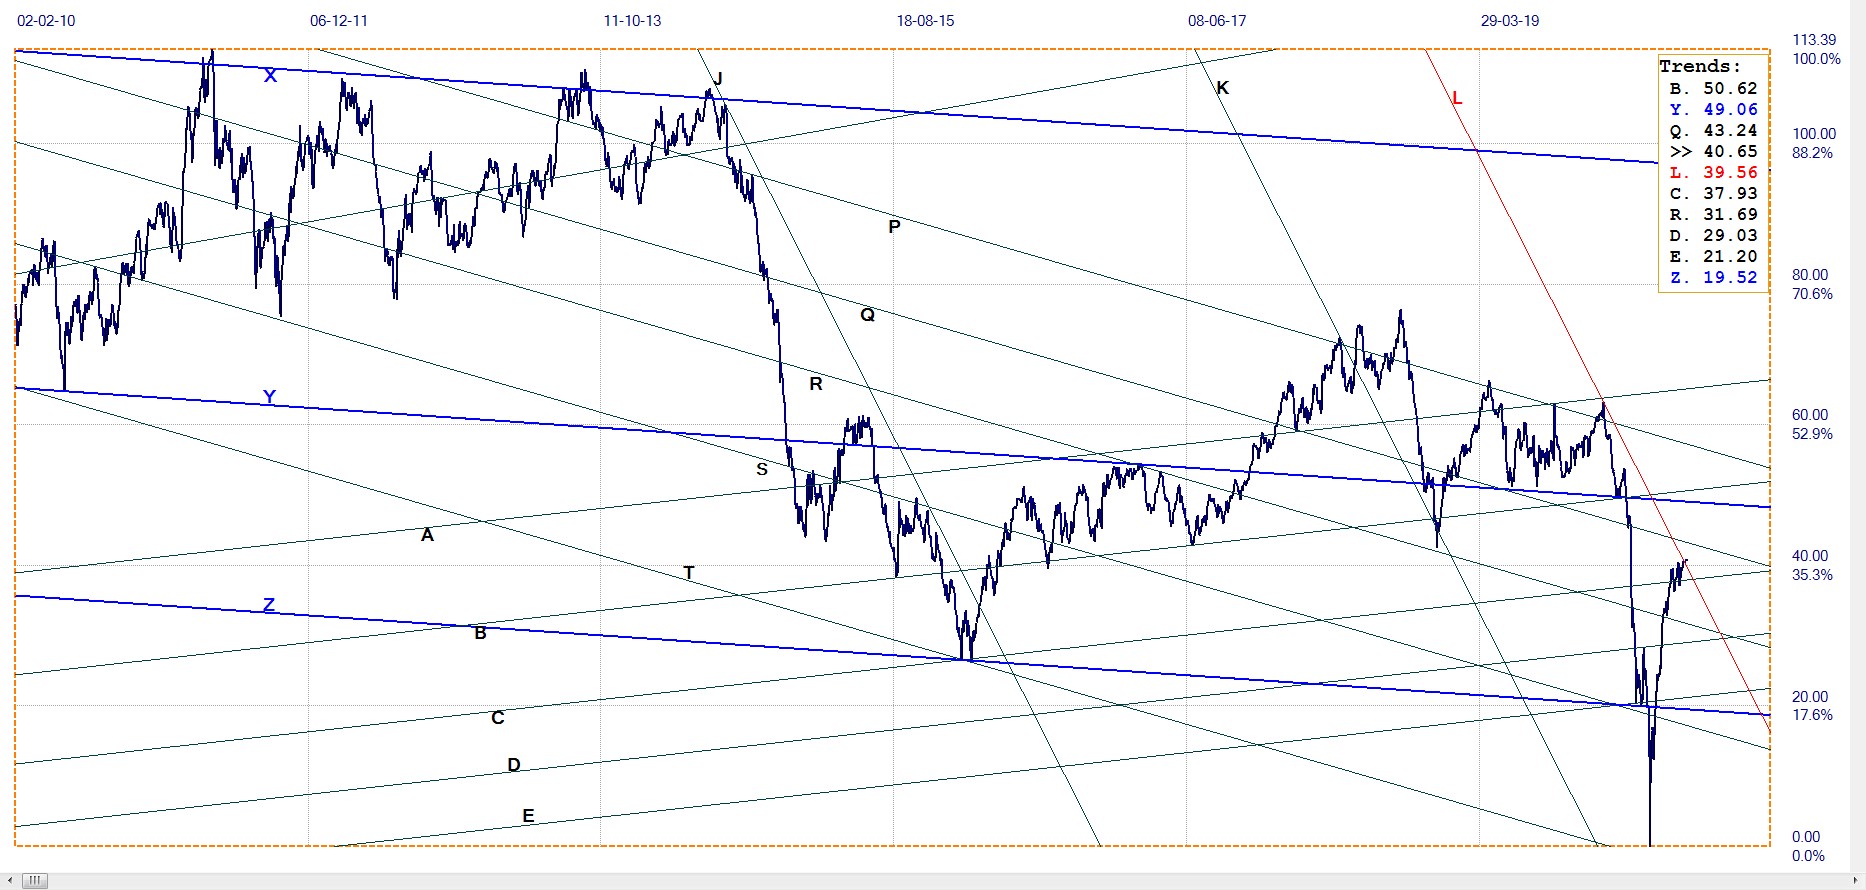
WTI crude – Daily close, last = $40.65 (www.investing.com )
The price has held above $40/bbl for some time now, but it looks as if that is taking some effort since that psychological break has not yet prompted enough buyers to chase the price higher. The longer it holds above that level before sinking lower – if it fails to continue higher – the bigger will be the effect on sellers who will rush in to try and lock in a good price before a new slump in the market develops.
The break above bear channel KL ($39.56) last week did not react higher and is therefore still suspect. A return to hold in channel will not be good news for the fracking industry.
© 2020 daan joubert
**********


