The Now Super Bullish Gold And Silver Setup Does Not Bode Well For The Dollar
 share
share
 share
share
 share
share
 share
share
 share
share
If you want to understand the great mass of investors, you don’t need to spend hours reading a book written about a hundred years ago, the best way to do it is to treat yourself to some time watching sheep. You can even make something of a vacation of it by going along to a sheep dog trial, such as the classic ones held on the English – Welsh borders in the heart of sheep country or in New Zealand. It’s a fun day out and you can learn from chatting with the farmers, and more to the point, you can learn a lot about investors by watching the sheepdogs and the sheep – all you have to remember is that the sheepdogs are the Smart Money and the sheep represent the great mass of investors, the so-called Dumb Money. If you do go to the sheepdog trials on the English – Welsh borders , remember to tag on a day or two to visit nearby Hay-on-Wye which is stuffed full of secondhand bookshops where you can find some great old books, and mercifully very few of them are written in Welsh.
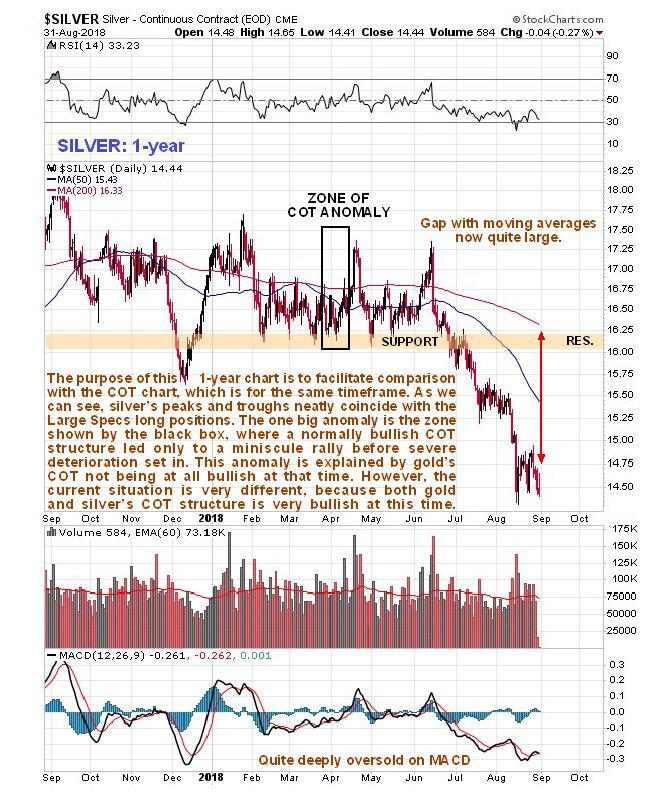
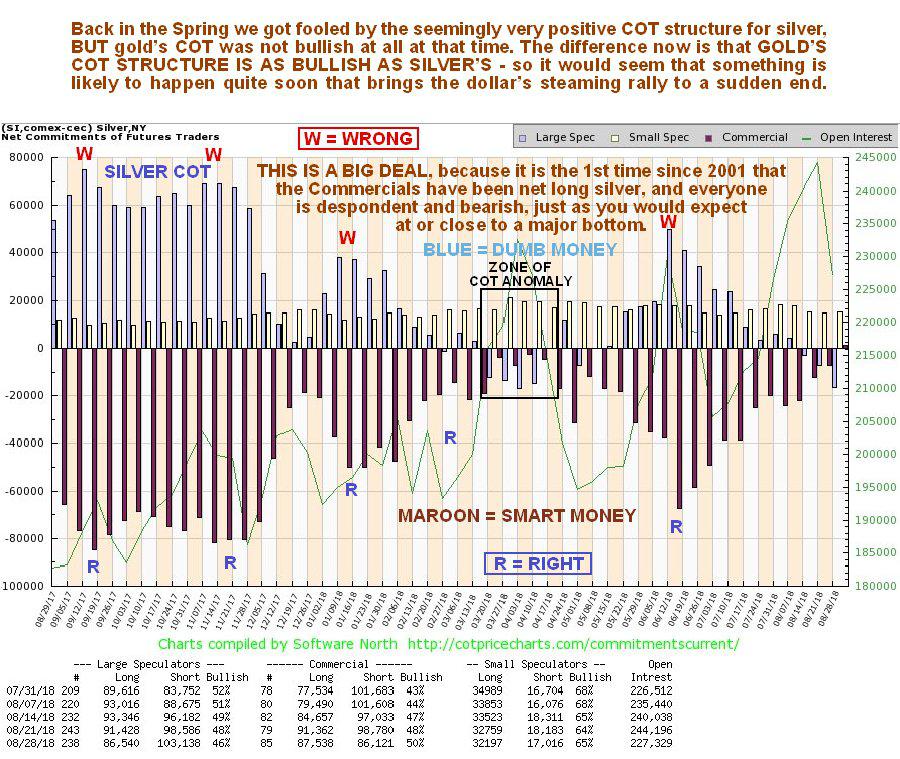
Fortunately, we can readily identify the sheepdogs and the sheep on our COT charts, the sheepdogs are the purple bars on our charts, the Commercials, who take the other side of the trade from the sheep, who are the blue bars, the Large Specs. Let’s now look at a pair of charts, a 1-year chart for silver itself with the COT chart stacked directly below it, which is for 1-year too, in order to see how the sheep are always wrong. As we can see the sheep, the Large Specs (blue bars) always have their biggest long positions at or just ahead of peaks in the silver price. This is not rocket science is it – to assist you in grasping this, an appropriate number of right and wrong labels have been added to the chart. While the obvious conclusion from this is that the Large Specs are just plain stupid, dumber than the dumbest jackass, as pragmatic speculators we do not waste our time condemning them, rather, we simply make sure that we are the opposite side of the trade from these clowns, and if they are going short silver to a significant degree, as they did last week, then we are going to make darn sure that we are long. If we are a little too early, and silver drops some more, then so what? The entire financial system is set to blow to smithereens before much longer, and the Emerging Markets collapse is just the start of it – the periphery is burning and the firestorm will soon spread towards the center. When that happens there are going to be “precious” few hiding places, and the Precious Metals sector will be one of the only boltholes around. Before leaving these charts it is also worth noting that the Commercials went long silver for the 1st time since 2001 last week and if that isn’t a sign of an imminent bullmarket, then I don’t know what is. Incidentally, with respect to the classic 1948 goldbugs film with Humphrey Bogart “Treasure of the Sierra Madre”, those of you who play casino slot machines may not realize that the refrain “Bonus? – we don’t need no stinking bonus!” that the “My Caramba” machine says in a thick Mexican accent when the bonus is cut short, is actually inspired by the Badges? – we don’t need no stinking badges! scene in the “Treasure of the Sierra Madre”, but I digress…
Click on chart to popup a larger, clearer version.
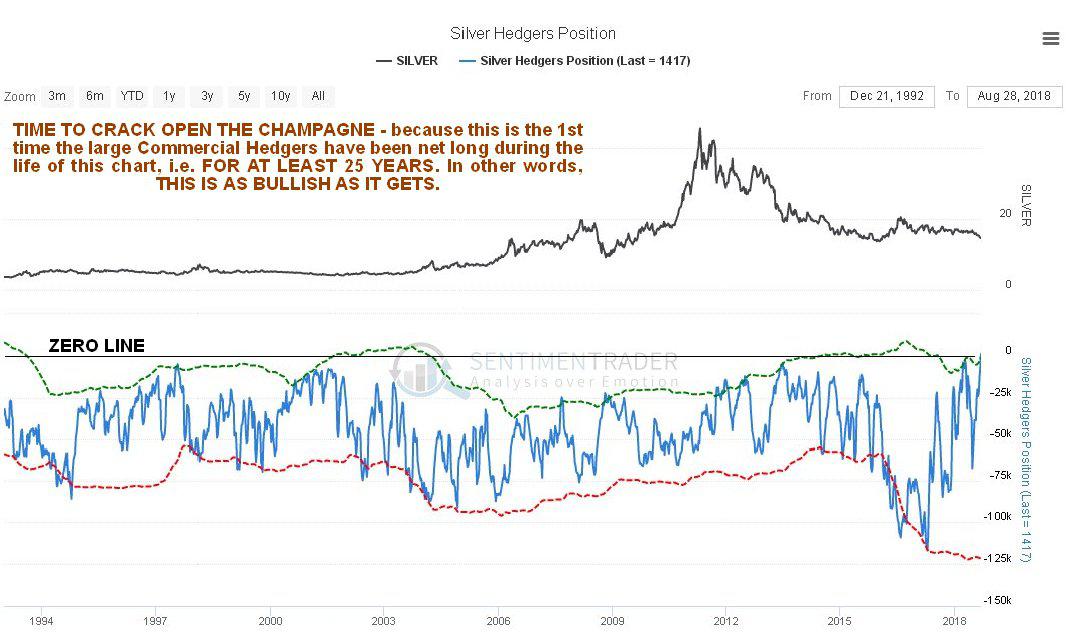
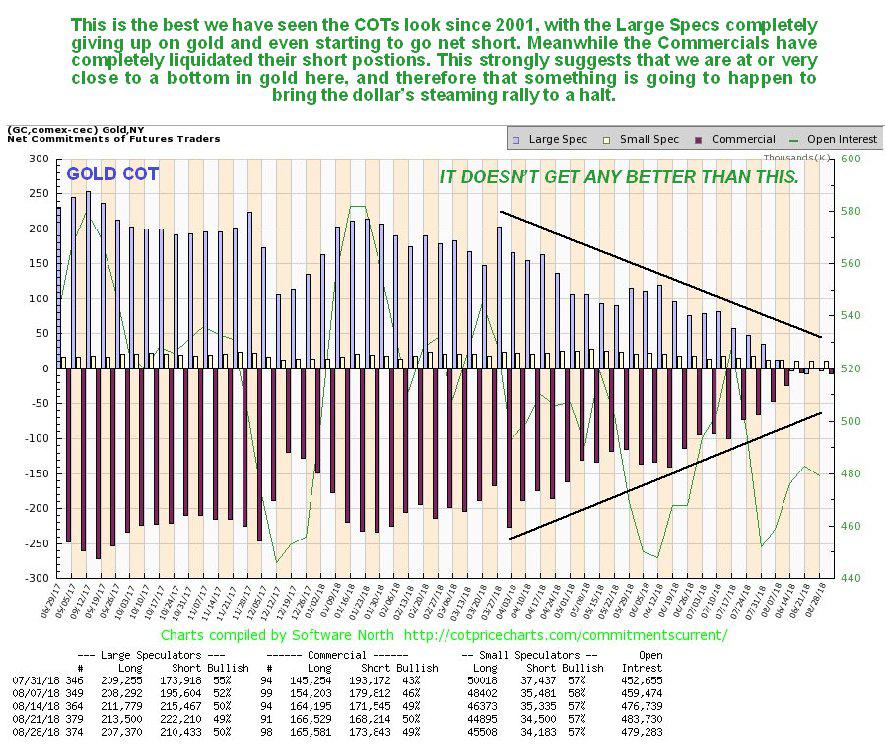
The net Commercial Hedgers chart is also unprecedentedly bullish, as it shows that this is the 1st time during the life of this chart, i.e. for the past 25 years at least, that they have held a net long position – put simply it doesn’t get any better than this…
Click on chart to popup a larger, clearer version.
Chart courtesy of sentimentrader.com
The 6-month chart for silver shows recent action in more detail. On this chart we can see that last week’s dip brought the silver price back close to its mid-August lows, with which it is suspected to be forming a small Double Bottom, and a bullish looking “inverted hammer” candle appeared on Friday, so we might be right at the bottom here.
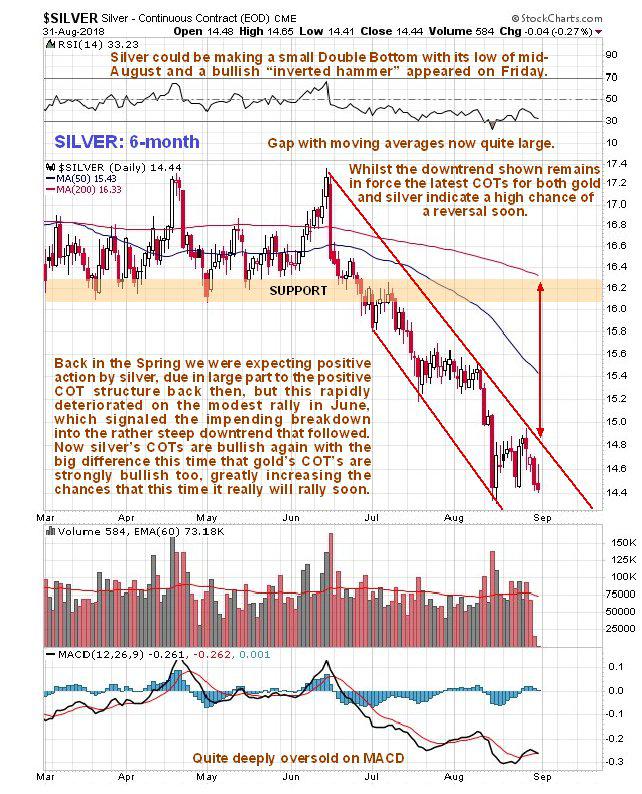
Finally, unlike back in the Spring, gold’s latest COT chart is also very bullish…
As mentioned on some of these charts, if the outlook for gold and silver is so positive, then it means that the dollar’s “wrecking ball” rally is about done. So, after looking for evidence that it is, we have this…
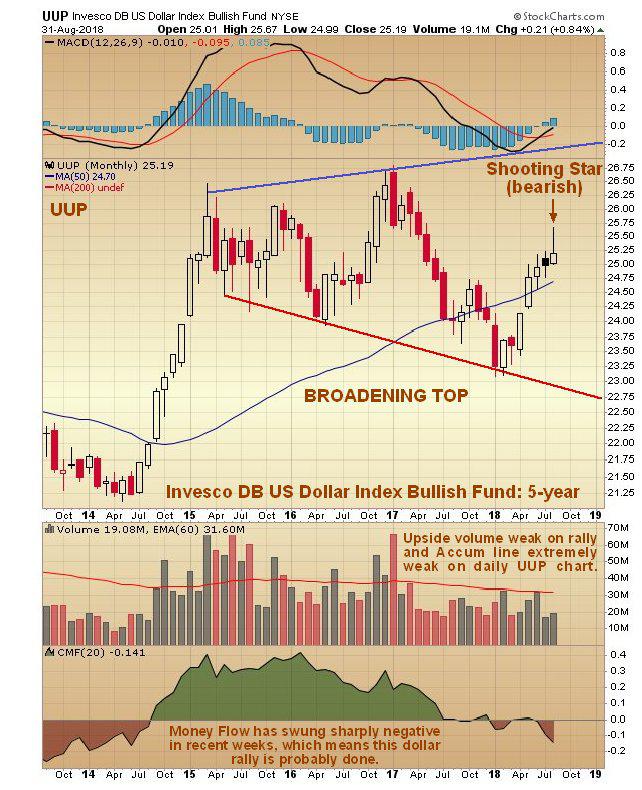
This monthly chart for dollar proxy UUP shows a bearish monthly “shooting star” for the month of August and money flow becoming negative in recent weeks, indicating that Smart Money have been taking profits in dollar trades. It also shows a big ugly potential Broadening Top. According to this chart the dollar is about to turn lower. It is also worth noting that the Accumulation chart for UUP on its daily chart has been extremely weak on this rally.
The conclusion to all this is that the coast is clear to accumulate the PM sector – even if the sector drops more, it is unlikely to be by much. That’s what Smart Money is already doing, and they are going to be sitting pretty and not have to give chase if the sector goes roaring up. At this juncture it is probably best in general to accumulate the large to mid-caps, since they are unlikely to drop much more if the sector grinds a bit lower, whereas as we know, some juniors can easily get another 30% lopped off their prices if the sector goes nowhere and there is no positive news out of the individual companies. We will accordingly be reviewing the charts for a range of large and mid-cap gold and silver stocks as a matter of priority going forward.
*********
share
share
share
share
share

Clive P. Maund’s interest in markets started when, as an aimless youth searching for direction in his mid-20’s, he inherited some money. Unfortunately it was not enough to live a utopian lifestyle as a playboy or retire very young. Therefore on the advice of his brother, he bought a load of British Petroleum stock, which promptly went up 20% in the space of a few weeks. Clive sold them at the top…which really fired his imagination. The prospect of being able to buy securities and sell them later at a higher price, and make money for doing little or no work was most attractive – and so the quest began, especially as he had been further stoked up by watching from the sidelines with a mixture of fascination and envy as fortunes were made in the roaring gold and silver bull market of the late 70’s.
Clive furthered his education in Technical Analysis or charting by ordering various good books from the US and by applying what he learned at work on an everyday basis. He also obtained the UK Society of Technical Analysts’ Diploma.
The years following 2005 saw the boom phase of the Gold and Silver bull market, until they peaked in late 2011. While there is ongoing debate about whether that was the final high, it is not believed to be because of the continuing global debasement of fiat currency. The bear market since 2011 is viewed as being very similar to the 2-year reaction in the mid-70’s, which was preceded by a powerful advance and was followed by a gigantic parabolic price ramp. Moreover, Precious Metals should come back into their own when the various asset bubbles elsewhere burst, which looks set to happen anytime soon.
Visit Clive at his website: CliveMaund.com


