Painful Short-Term Correction Came And Went?


 Last week's trading saw Gold forming its high in Tuesday's session, here doing so with the tag of the 1919.20 figure. From there, a sharp decline was seen into early in Friday's session, with the metal dropping all the way down to a low of 1855.60 - before rallying back into the daily/weekly close.
Gold's Short-Term View
In my article from last weekend (i.e., 'Will June Bring a Painful Correction for Gold?',) I noted the potential for a larger percentage decline to play out for the gold market, some of which was seen into last week - with the metal dropping some 65 points from peak to trough. Take a look at the chart below:
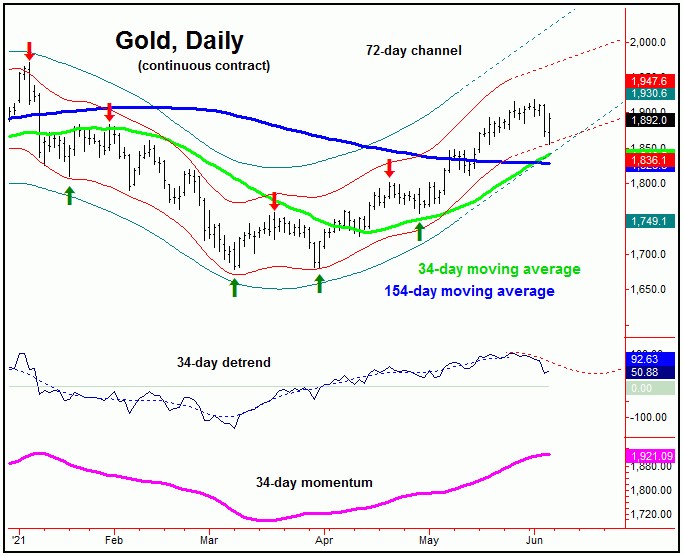
The above chart shows the 34-day wave, which, as mentioned last weekend, was in the process of topping. This same cycle was expected to be responsible for the next good correction phase, some of which has been seen with the decline into early-Friday.
In terms of price, from my work in the markets, I have found that a dominant cycle has an above-average tendency to revert back to a moving average of the same length as that wave. Thus, while the recent decline was fairly sharp, it has yet to take prices back to the 34-day moving average, which is a natural downside magnet.
With the above said and noted, the downside 'risk' going forward is still to this 34-day moving average, which the (34-day) cycle itself next projected to trough later this month. And, should the metal somehow make a higher high in-between, the best guess is that this rally would fail - giving way to the expected tag of the 34-day moving average.
Pattern Analysis favors the Mid-Term Bullish Case
In terms of patterns, however, due to the larger-degree cycles, I mentioned that any short-term correction phase - such as with the aforementioned 34-day cycle - would likely end up as a countertrend affair, inside a larger bullish upward phase. Take a look at our next chart:
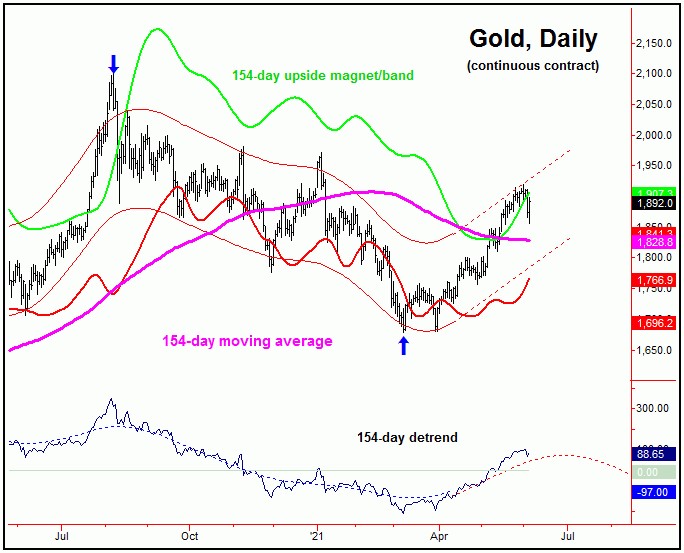
The chart above shows the larger 154-day cycle, which is two waves removed from the 34-day component. Why is this important? It is key factor, due to the fact that the larger cycle will dictate the overall trend for the market.
With the above said and noted, we can see that our 154-day wave is projected higher into at least the month of July. Having said that, due to the position of the cycles above this 154-day wave (i.e., the 310-day and four-year cycles), the probabilities favor the upward phase of this 154-day component to end up as bullishly right-translated.
In other words, the probabilities tend to favor the upward phase of this 154-day wave lasting into late-Summer, though, as mentioned earlier, coming with several in-between corrections - the first of which has been due to play out with the smaller 34-day cycle.
The above chart also provides some additional information for the gold market. That is, since pushing on above the 154-day moving average, the same will now act as support to any short-term correction phase(s). Going further, this 154-day moving average is also gravitating towards our lower 154-day cycle channel, thus adding weight to the idea of mid-term support being at or into this key level.
All said then, any short-term corrections are expected to end up as countertrend affairs, giving way to higher highs, upon completion. The overall uptrend is expected to last well into late-Summer, before the next peak of significance forms for gold.
U.S. Stock Market 'Kill' Date Looms Close
As mentioned in some of my past articles, the U.S. stock market - as measured by the S&P 500 index (or 'SPX') - is in the process of forming a mid-term peak - one which will be followed by the largest percentage correction of this year.
The last correction of significance for U.S. stocks came from the 45-day cycle, which is shown again on the chart below:
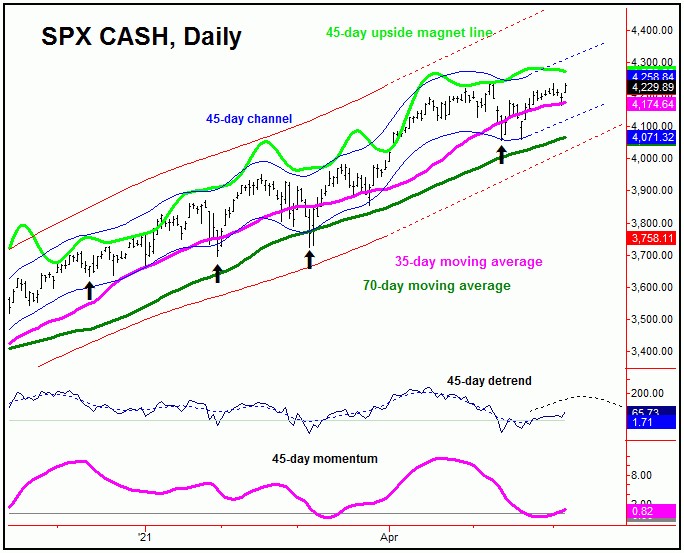
As noted in recent weeks, the last bottom for the 45-day cycle was the mid-May trough of 4056.88 on the SPX. From there, its current upward phase has been projected higher into the month of June, with the same being the odds-on favorite to peak the mid-term rally.
With the above said and noted, while we are still long from the mid-May bottom, we are looking for technical reasons for an exit going forward - with a key 'kill date' looming close. There is also another date that could mark the next key swing low for U.S. stocks, with more precise details noted in our daily Market Turns report.
U.S. Stocks, Bigger Picture
Even with the largest percentage decline of 2021 readying to assume control of the U.S. stock market, it is expected to end up as a (albeit larger) countertrend affair. In other words, while the coming decline will have many speculating that the larger bull market has come to an end, that should not be the case - due again to the position of the four-year component, shown below:
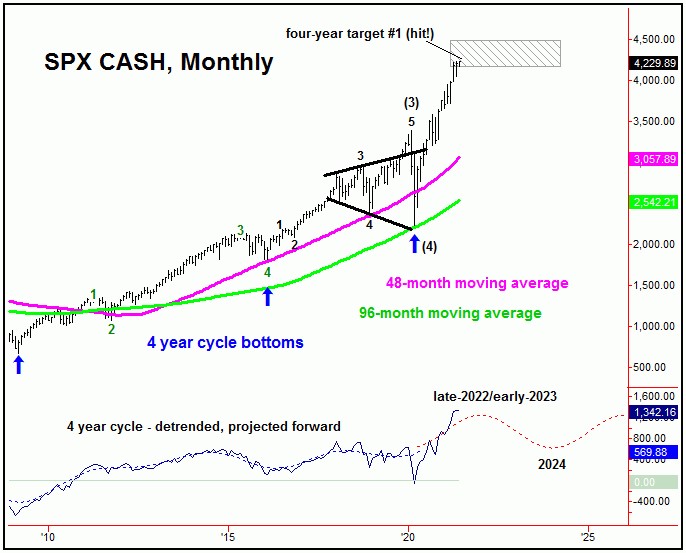
The last low for this four-year cycle was registered back in late-March of last year. From there, its next upward phase was later confirmed to be back in force, last Summer confirming an upside target to the 4157.83 - 4485.31 SPX CASH region - which has obviously been met with the action in recent months.
Even with the above said and noted, back in April of this year we were able to confirm a second upside target with this four-year wave, which is to considerably higher levels than already seen. With that, we expect the next mid-term decline phase to be followed by higher highs for the bigger swing, lasting well into next year - before any long-term peak attempts to form.
For the longer-term view, higher highs into next year - if seen as expected - should end up topping this four-year cycle, for what is expected to be a very sharp decline into the year 2024. In terms of price, that decline is likely to be in the range of 30% or more from peak-to-trough - though is favored to hold above the March, 2020 low, before turning higher again into the year 2026 or later. More on the longer-term outlook for U.S. stocks in a future article; stay tuned.
Jim Curry
The Gold Wave Trader
http://goldwavetrader.com/
http://cyclewave.homestead.com/
********


