Precious Metals Bull Market Juggernaut


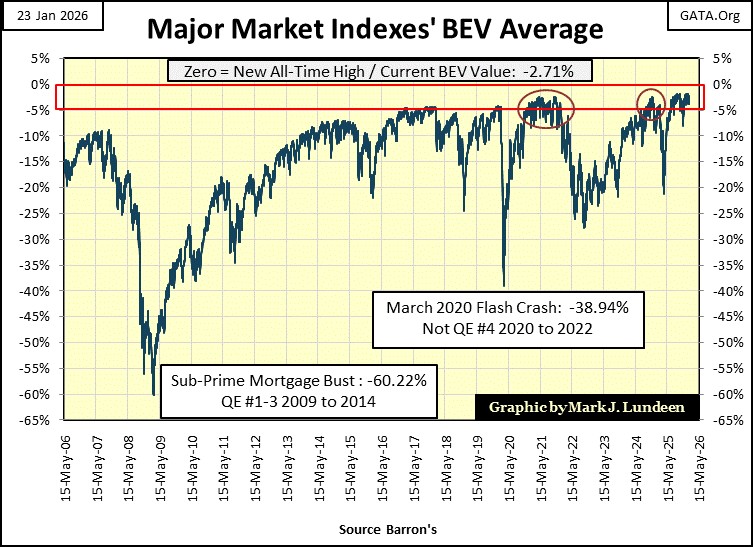
This week, the Dow Jones closed with a BEV value of -0.99%, less than 1% below its last all-time high of January 12th. At this week’s close, the Dow Jones remains in scoring position, within the Red Rectangle I placed over the BEV 0% and BEV -5% lines. So, we should expect additional BEV Zeros, new all-time highs in the weeks and months to come.
After over two years of the Dow Jones remaining in scoring position, that may sound repetitious to you. It sure does to me. But until the Dow Jones in its BEV chart below, deflates below its BEV -5% line, and makes an honest effort to break below its BEV -10% line, excitement is something the Dow Jones BEV chart below will be lacking.
Do you want some excitement with the Dow Jones BEV chart below? Wait until it deflates below its BEV -25% line (37,192), because one of these days – it will, and you’ll see plenty of excitement in the financial media.
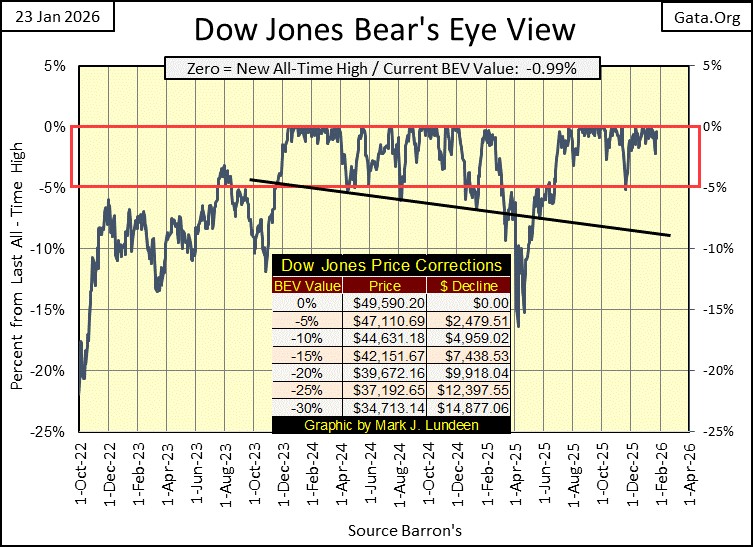
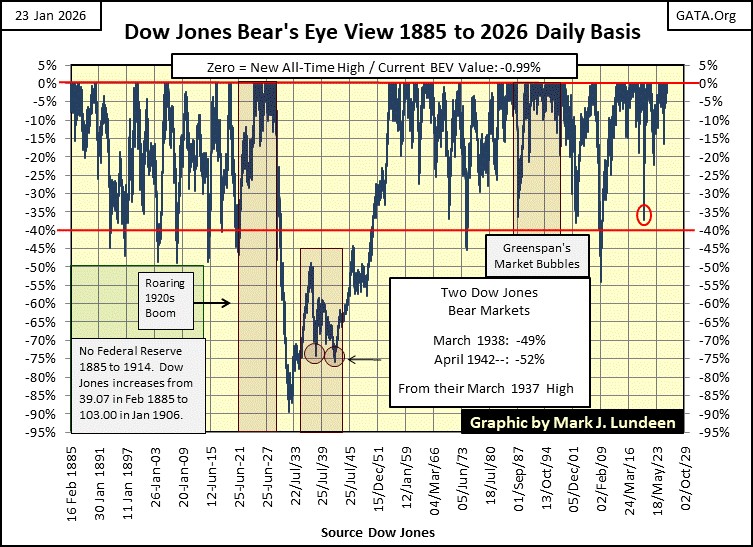
You don’t believe the Dow Jones can deflate below 37,192, a 25% market decline? Looking at the history of the Dow Jones, via the Bear’s Eye View (BEV) below, seeing a 25% decline from an all-time high, plus more deflation, is a very common occurrence, looking at the past 140 years of Dow Jones history. It’s only a question of time, before this happens once again.
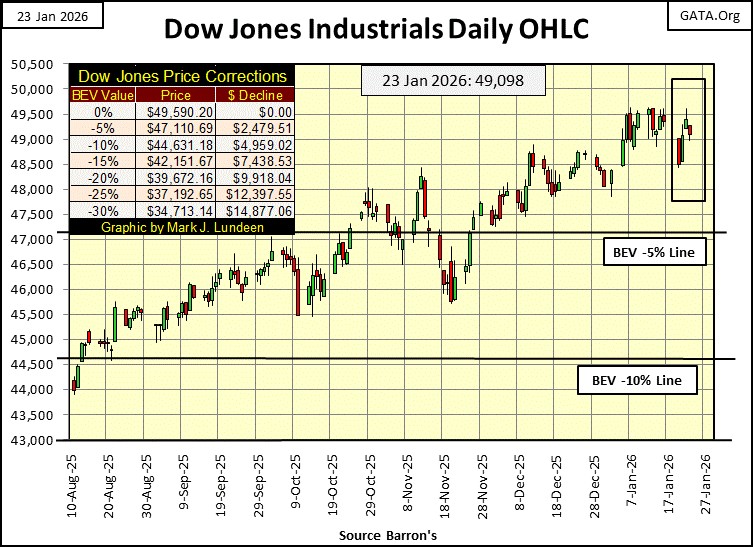
The Dow Jones in daily bars below, provides more excitement than the Dow Jones in the Bear’s Eye View above. This was the third week in a row, where the Dow Jones traded above 49,500, but failed to close above 49,500.
What should we think about that? Why think, when all we have to do is look at the Dow Jones BEV chart above. Is the Dow Jones in scoring position? Yes it is. So, in the weeks and months to come the Dow Jones will close above 49,500, on its way to then close above 50K.
Of course, should the Dow Jones’ next major move, above and below, be to close below its BEV -5%, and -10% lines, there would be little reason for continuing to being bullish on the stock market. Someday this multi-year advance will end, with the Dow Jones losing 40%, to 50%, or more of its market valuation. But for now, I remain bullish on the stock market.
In my table below, listing the BEV values for the major stock indexes I follow, the XAU is #1, at the top of the list, and for good reason, as seen in its chart below. From its lows of January 2016 (38.84), ten years ago, the XAU has advanced by a factor of 11.19. Second place in this ten-year race is the NASDAQ 100, which has since January 2016, advanced by a factor of 6.17, far below the gains of the XAU.
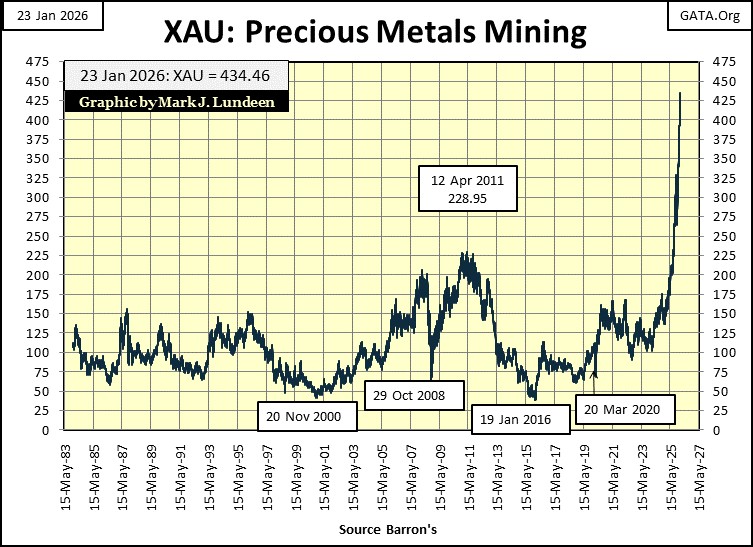
Seeing these huge advances in the XAU above, should we consider selling? Well, investors will never go broke taking profits in the market. And if someone made a gutsy market move by buying a gold and silver miner a few years ago, why not sell a bit of their position, to buy something nice for themselves, and maybe something nice for their nearest and dearest too.
This advance in precious metals assets, like the gold miners, is in the early stages of a massive, and historic bull market. It’s funny how human psychology works in the market. Early in any bull market, investors are still focusing on the now gone bear market. So, they continue thinking of selling, for fear that market may fall again. But that doesn’t happen, as it’s now a bull market.
At the top of a bull market, market psychology is such that people become fearless, believing the good times will never end. But they do, when Mr Bear once again has his way with the market.
Just being aware of market psychology in gold and silver, and for the broad stock market, I feel safe being exposed to the market risks in the gold and silver miners. As for the broad stock market, I think there are lots of investor out there, that one day, will receive a very expensive education on bull and bear markets.
Now let’s look at the table below. This week, BEV Zeros became increasingly rare market events. But not every day in a bull market, closes at a new all-time high. Most days in a bull market advance, close in scoring position, within 5% of their last all-time high, exactly what we see below
And looking at the average BEV for these indexes (#16), it too is well within scoring position, closing the week with a BEV of -2.71%. Looking at this average BEV for these indexes in the chart below, this BEV average closing within scoring position, is something that happens at market tops. And what do we know about market tops;
- market risks increase to maximum,
- the possibility of realizing a profit decrease to minimum.
This advance in the stock market could continue for a long time. Maybe into next year. But never doubt this advance’s days are numbered. There is nothing wrong selling near the top of a bull market, even if the market continues advancing after you’ve exited. That is what is called “locking in your profits.” Which is much better that selling into the following bear market, where one locks in one’s losses.
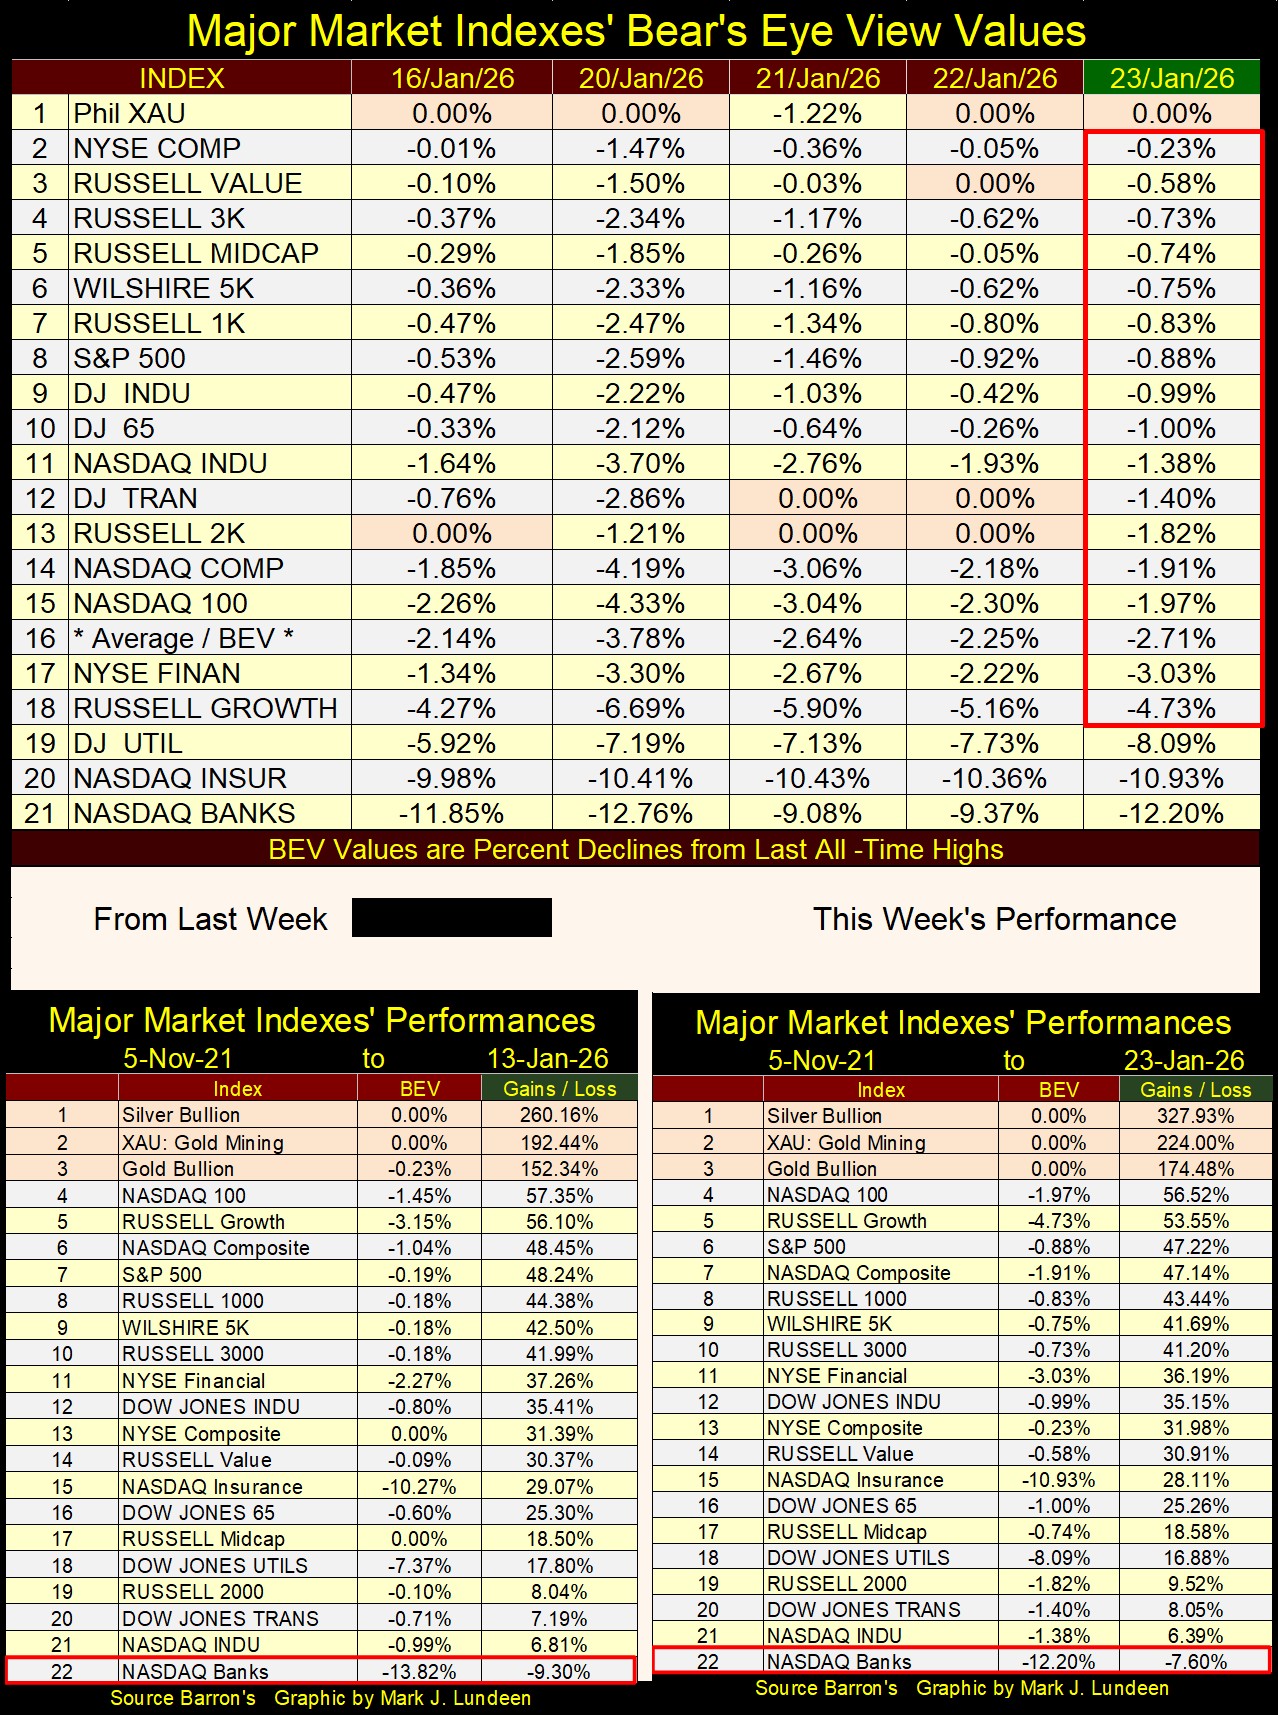
In the performance tables above, silver and the XAU (#1&2), continue soaring into the wild blue yonder. How much more, and for how many more weeks and months can this go on? I don’t know.
What I do know is; silver and the precious metal mining stocks have been manipulated far below their fair market valuations for decades. What we may be looking at above, is the precious-metal bears finally getting what is coming to them; oversized losses on their short positions in silver and the miners.
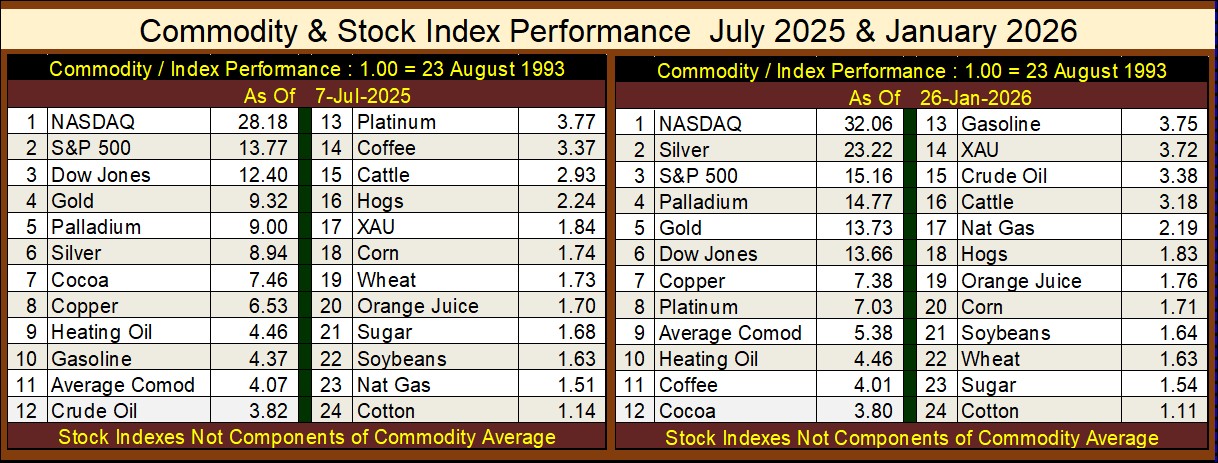
Below are two tables listing the relative performances for the commodities I follow on a weekly basis, along with the NASDAQ Composite, S&P-500, the Dow Jones and XAU. I chose 23 August 1993 as the basis date for these tables, as that was when Alan Greenspan, began inflating the bubble in the NASDAQ High-Tech stocks. That is as good a start date as any for these tables.
The table on the left is from last July, and the one on the right is data for Thursday of this week. In the six months that separate these two tables, the performances of the precious metals and XAU have been outstanding.
The major stock indexes have all advanced since last July, and respectfully so. But silver was the star of the ball, increasing from #6 (8.94) last summer, to #2 (23.22) this week. Wow! Energy issues have deflated some since last summer, which is fine with me. Same goes with agriculture issues, the meats and grain. If food prices are up since last summer, it’s not because the farmers are seeing higher prices.
What stands out to me about these tables, is how well the major stock indexes are performing during a bull market in precious metals. I think of rising valuations in the old monetary metals, as a flight to safety from deflation in the financial markets. Wealth fears deflation. Which is another way of saying during bear markets, the smart money knows when it is time to sell, and move their money somewhere else. A good port for wealth to come to in a storm, has always been precious metals, and their miners.
That is not happening now in January 2026, as the stock market continues seeing its valuations inflated, but oddly, not as fast as the precious metals valuations are being inflated.
Seeing market valuations being inflated, or deflated, as an ocean of “liquidity,” flowing from the idiots at the FOMC, sloshes around the financial system, is exactly how enlighten investors should see these variations in market valuation. Understanding that the fine point separating a bull, from a bear market is; “liquidity” flooding into a market as a bull market, and “liquidity” draining from of a market as a bear market.
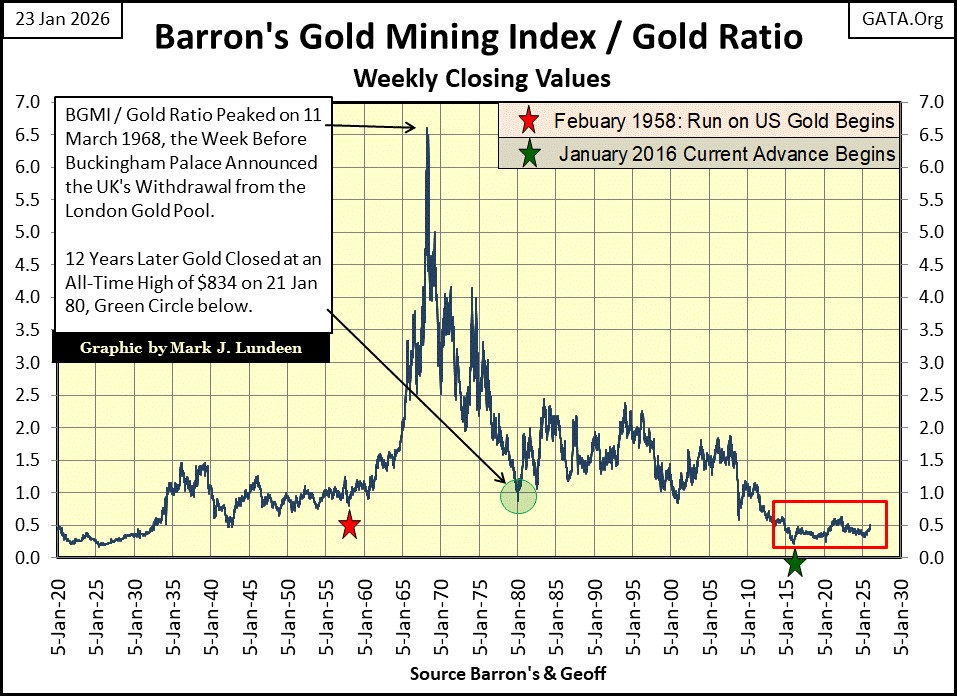
Below I have the chart plotting my Dow Jones to Gold Ratio, a ratio of the indexed values for the Dow Jones to gold, going back to January 1970. Periods where this ratio is rising, are times when investing in the Dow Jones (my proxy for the broad stock market) was more profitable than investing in gold. When this ratio is declining, gold’s performance was superior to the Dow Jones.
The movements of this ratio were once large, spanning many years. But note the red box in the chart, covering the past decade, where this ratio became rangebound, stymied between 0.50 and 1.0 in the chart.
What is happening inside this red box is anomalous. Anomalous situations in the market, such as the failure in the past decade of either the Dow Jones, or gold to establish a dominant trend over the other, don’t last forever.
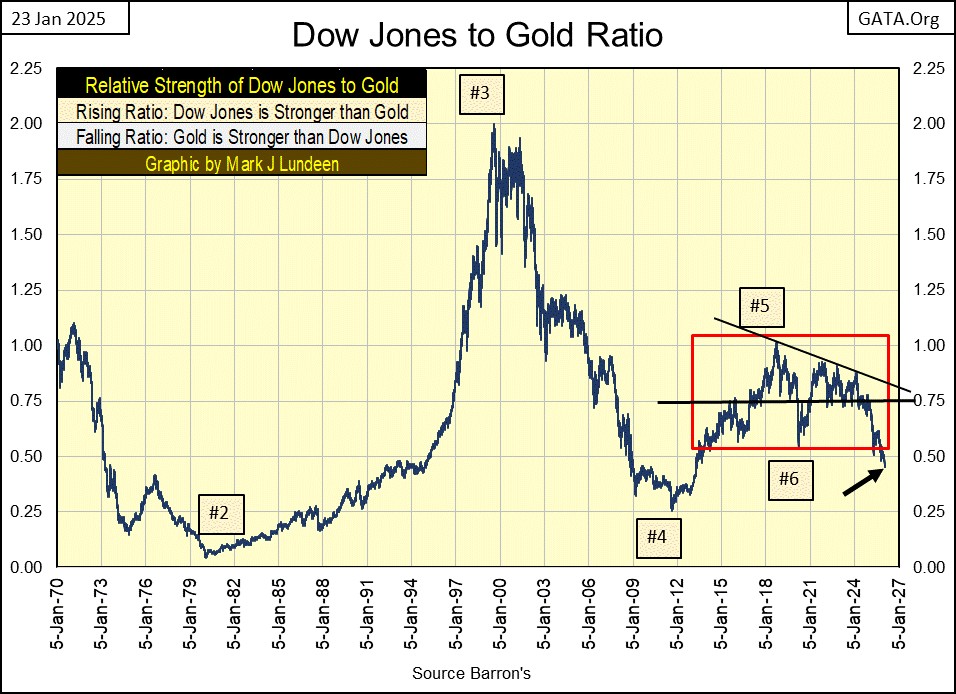
September 2021, the ratio peaked at around 0.90, and has been declining ever since. Last February, the ratio began breaking down towards its 0.50 level, and has broken out of the red box a month, or so ago.
What does this mean? The bull market in the old monetary metals will continue growing stronger, as the bull market in financial assets, such as stocks and bonds, are increasingly at risks of being terminated. In other words, this breakout from the red box above by the Dow Jones to Gold Ratio, may indicate that gold is ready to once again become the dominate trend in the market.
We may see the stock market continue rising in the weeks and months to come, but the day is coming when Mr Bear will have his way with Wall Street, to the great benefit of gold, silver and their miners.
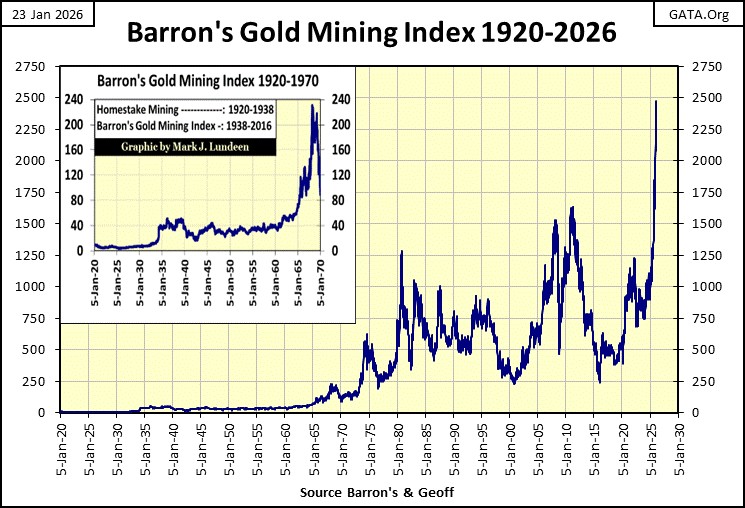
Next is a chart similar to what Eric King of King World News has been publishing for a long time, proving how undervalued the gold mining shares have been for many years. But Eric’s chart uses the XAU and gold. As the XAU only goes back to 1983, his plot is only for the past forty-three years.
But I have data on the Barron’s Gold Mining Index (BGMI), which Barron’s has published weekly since 1938. Goeff gets credit on this chart, as he took the trouble to compile weekly data on Homestake Mining back to 1920, and sent it to me. Homestake was a South Dakota gold miner that Barron’s used in the BGMI, and I used Goeff’s data to push the BGMI back to 1920.
Lots of things have changed in the 126 years of data plotted below. First, from 1920 to 1971, gold was money, fixed at;
- $20.67 (1920 to 1934),
- $35 (1934 to 1971).
So, the large movements seen below from 1920 to 1968, were due to the swings in the valuation of the BGMI alone. After 1970, both the price of gold, as well as the valuation of the BGMI moved over time. For gold, from the dollar’s old gold peg at $35 an ounce in 1970, to gold at $4,989 an ounce at this week’s close.
After studying the chart above, what significant insight we should take from it? For me, how historically undervalued the gold and silver mining shares currently are, in terms of the precious metals they mine, even after the huge gains the BGMI has seen below.
The gold and silver miners haven’t been this cheap in terms of the metal they mine, since the 1920s. And when Wall Street’s 1920s’ stock-market bubble went bust in the 1930s, look what the BGMI did for their owners. I’m expecting a 21st century replay of exactly this, in the years to come for the gold and silver mining stocks.
Think of it this way; currently there are tens-of-trillions of dollars, yen, euros, and etc. that currently circulate daily in the global financial markets. What did I say above; what does wealth fear? * Deflation! * Thanks to Mr Bear, a day is coming when most of this wealth is going to exit the financial markets in a panic, and will flee too somewhere else.
A significant percent of this massive wealth transfer will find its way to gold, silver, and precious metals mining companies. What price then will the BGMI, and the XAU trade then?
Since its January 2016 bottom, ten years ago, the BGMI is up by a factor of 10, from 250 to 2500. I expect this ten-year advance seen below, is only the beginning of what is to come for the market valuations of the precious metal miners.
Below are the indexed values for the BGMI, the Dow Jones, and US Currency in Circulation (CinC), or paper money in circulation, with January 1920 = 1.00.
Ideally, an investment should exceed the rate of inflation the FOMC’s “monetary policy” has set for the economy. If not, over time inflation will consume any capital gains generated by that investment. Think of the Green CinC plot below, as the rate of inflation all investments must exceed, if that investment is to produce an actual positive return on the capital invested.
Note that the Dow Jones plot (Red Plot) has only exceeded the rate of inflation during the 1920s. It came close to exceeding the rate of inflation in 1966, and again in 2000. But for most of the 126 years seen below, the Dow Jones has been a loser investment, in inflation adjusted terms.
You may say that isn’t fair, as the Dow Jones also pays out dividends. That is true. But the Federal Government, and most States also collect income tax on both capital gains, and dividend payouts. So, crediting the Dow Jones index below at 450 in 2026, is most likely a generous assumption of what the stock market has done for investors since 1920.
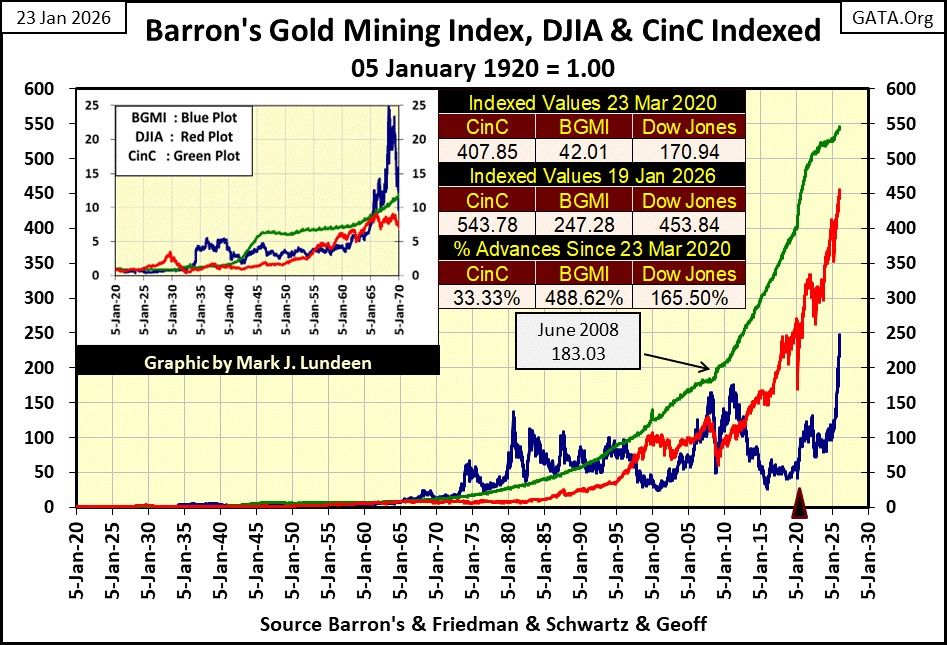
Now look at the BGMI (Blue Plot). It frequently found itself above the rate of inflation, above the Green CinC plot above. During the 1930s, and for three decades, from 1965 to 1995.
Following 1995, the BGMI fell below the rate of inflation, but attempted to exceed it twice, once in 2008, and again in 2011. Following the April 2011 top seen above, the BGMI endured a five-year bear market, that bottomed at the deepest market decline in the history of the BGMI, an 85% market decline, as seen in the BGMI’s BEV chart below. This 85% market decline soured market sentiment for the precious metals miners, really up to this day.
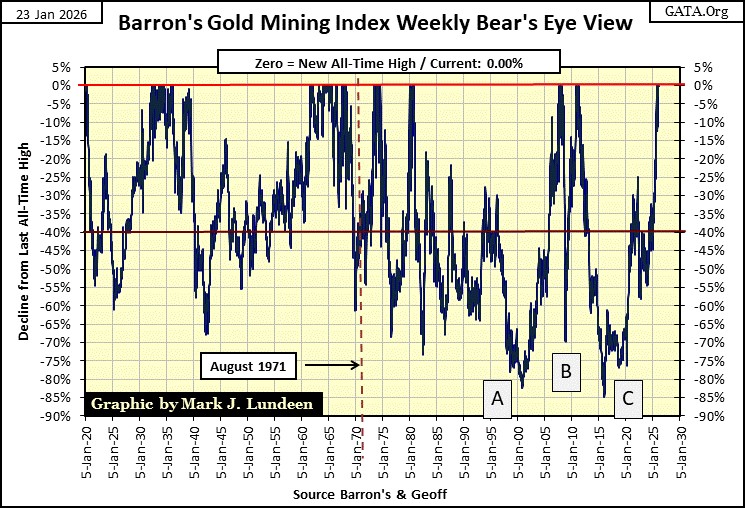
Following an increase by a factor of 10, from its January 2016, 85% bottom (Box C above), once again, the BGMI is generating new all-time highs. It is only a matter of time before investors, and money managers will once again see gold and silver mining as an attractive market sector for them to invest in.
When that happens, and it will, I expect that once again, the BGMI will trade above the rate of inflation (Green CinC Plot), in the chart above. Something the Dow Jones hasn’t done since the 1920s.
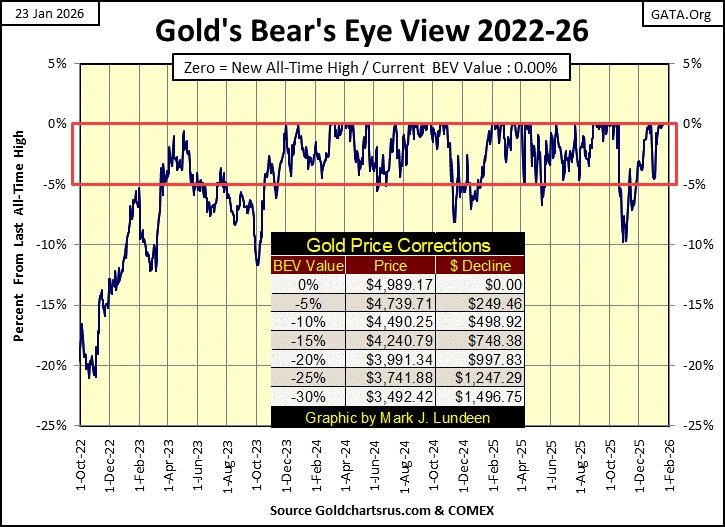
Like the Dow Jones’ BEV chart, for the past two years gold’s BEV chart below, has become very repetitive. However, when the repeating pattern seen below, inside scoring position’s red rectangle, includes 97 new all-time highs for gold since November 2023, that took the price of gold up from $1935, to this week’s close of $4989, a gain of $3054, I can learn to live with that.
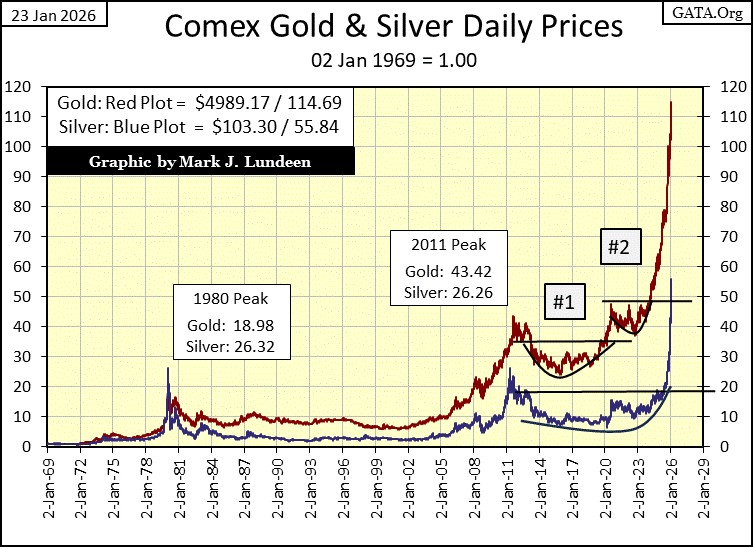
I like BEV charts. But during a bull market advance, there is no chart plot, like a dollar chart plot. Unless we index the dollar values to 1.00 = January 1969, as I did below for both gold and silver.
Every week, these indexes for gold and silver make significant advances in the chart below. That plus, silver is catching up with the gains gold has made since 1969. In January 1969, silver was trading at $1.85 an ounce. This week it closed at $103.30, or an increase by factor of 55.84. For silver to catchup with gold, it too would have to increase by gold’s factor of 114.69. $1.85 X 114.69 = $212.17 an ounce for silver.
Can silver trade at something over $200 an ounce? Sure it can, and much more. The only factor limiting the price of silver, gold and the gold and silver miners, is how much “liquidity” the idiots at the FOMC are going to “inject” into the financial system, in their on-going effort to bankrupt the global economy, in a deep morass of unserviceable debt.
And exactly how does that work? Just ask any college graduate who took on massive loans, to finance a worthless degree in some Marxist critical studies program. Using debt to purchase something that doesn’t provide for a suitable return to pay off the debt, can be a life changing event, one I don’t recommend.
Gold in its step sum table below, has seen nine new BEV Zeros since December 17th, and in the past twenty-five trading days, gold has advanced by 14.92%. This is one hell of a hot market.
How long can this continue before gold sees a 30% correction over a term of a few months? And since December 17th, silver has advanced by 55.74%, and the XAU by 28.42%, and none of these market juggernauts show any inclination of moderating their advances. There is something very wrong here. And I believe the correction for any, and all structural defects in these markets are currently struggling with, are in fact their amazing advances.
I’ve been looking at gold, silver and their miners for decades. And for years, I was stunned how the old monetary metals would grievously underperform the stock market. Over at GATA, Bill Murphy and Chris Powell have for decades, documented how Wall Street, and their Federal Government “Regulators” were illegally depressing market valuations for gold and silver.
All it takes to depress the price of anything, is an increase in supply. But the manipulators in the price of gold and silver didn’t increase the supply in gold and silver bullion in the market. Instead, they used contracts in the futures markets, where thousands-of-tons of digital gold and silver, can instantly be added to the supply, with a few keystrokes on a computer.
But digital gold and silver aren’t working anymore, as current market demand is demanding actual gold and silver bullion, delivered into the spot market. If this is so, and I believe it is, these gains in gold, silver, and in the precious metal miners, could continue for a long time, before they see a 20% correction in price.
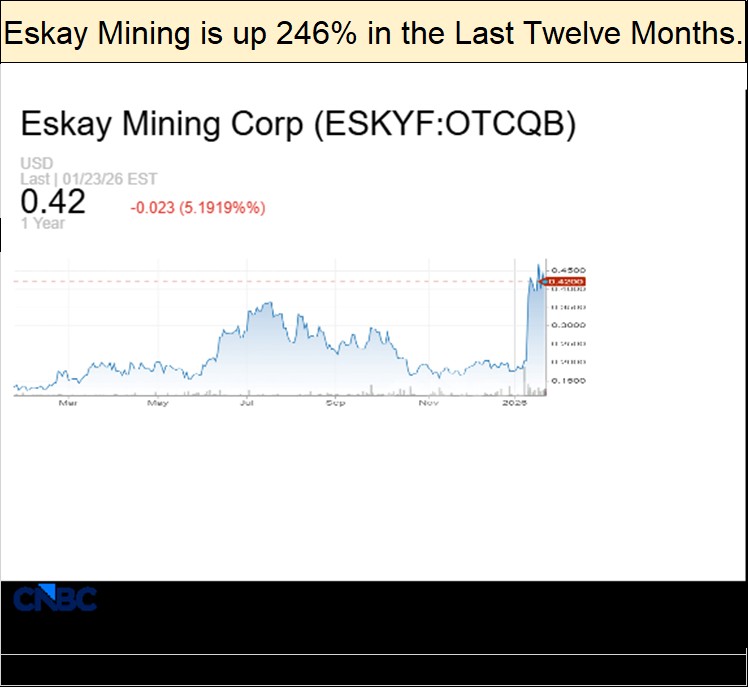
And what about the little exploration companies, such as the company I like; Eskay Mining? From $0.13 a year ago, Eskay is currently trading over $0.40. I expect 2026 will be a good year for Eskay.
Keep in mind, mineral exploration is a speculation, not appropriate for widows and orphans. But using 1% to 5% of the funds you intend to invest in gold mining shares, in an exploration company like Eskay Mining, could really spice up your gains in the next few years. If things don’t go as expected, you’ve risked only a small portion of your position, so no harm done.
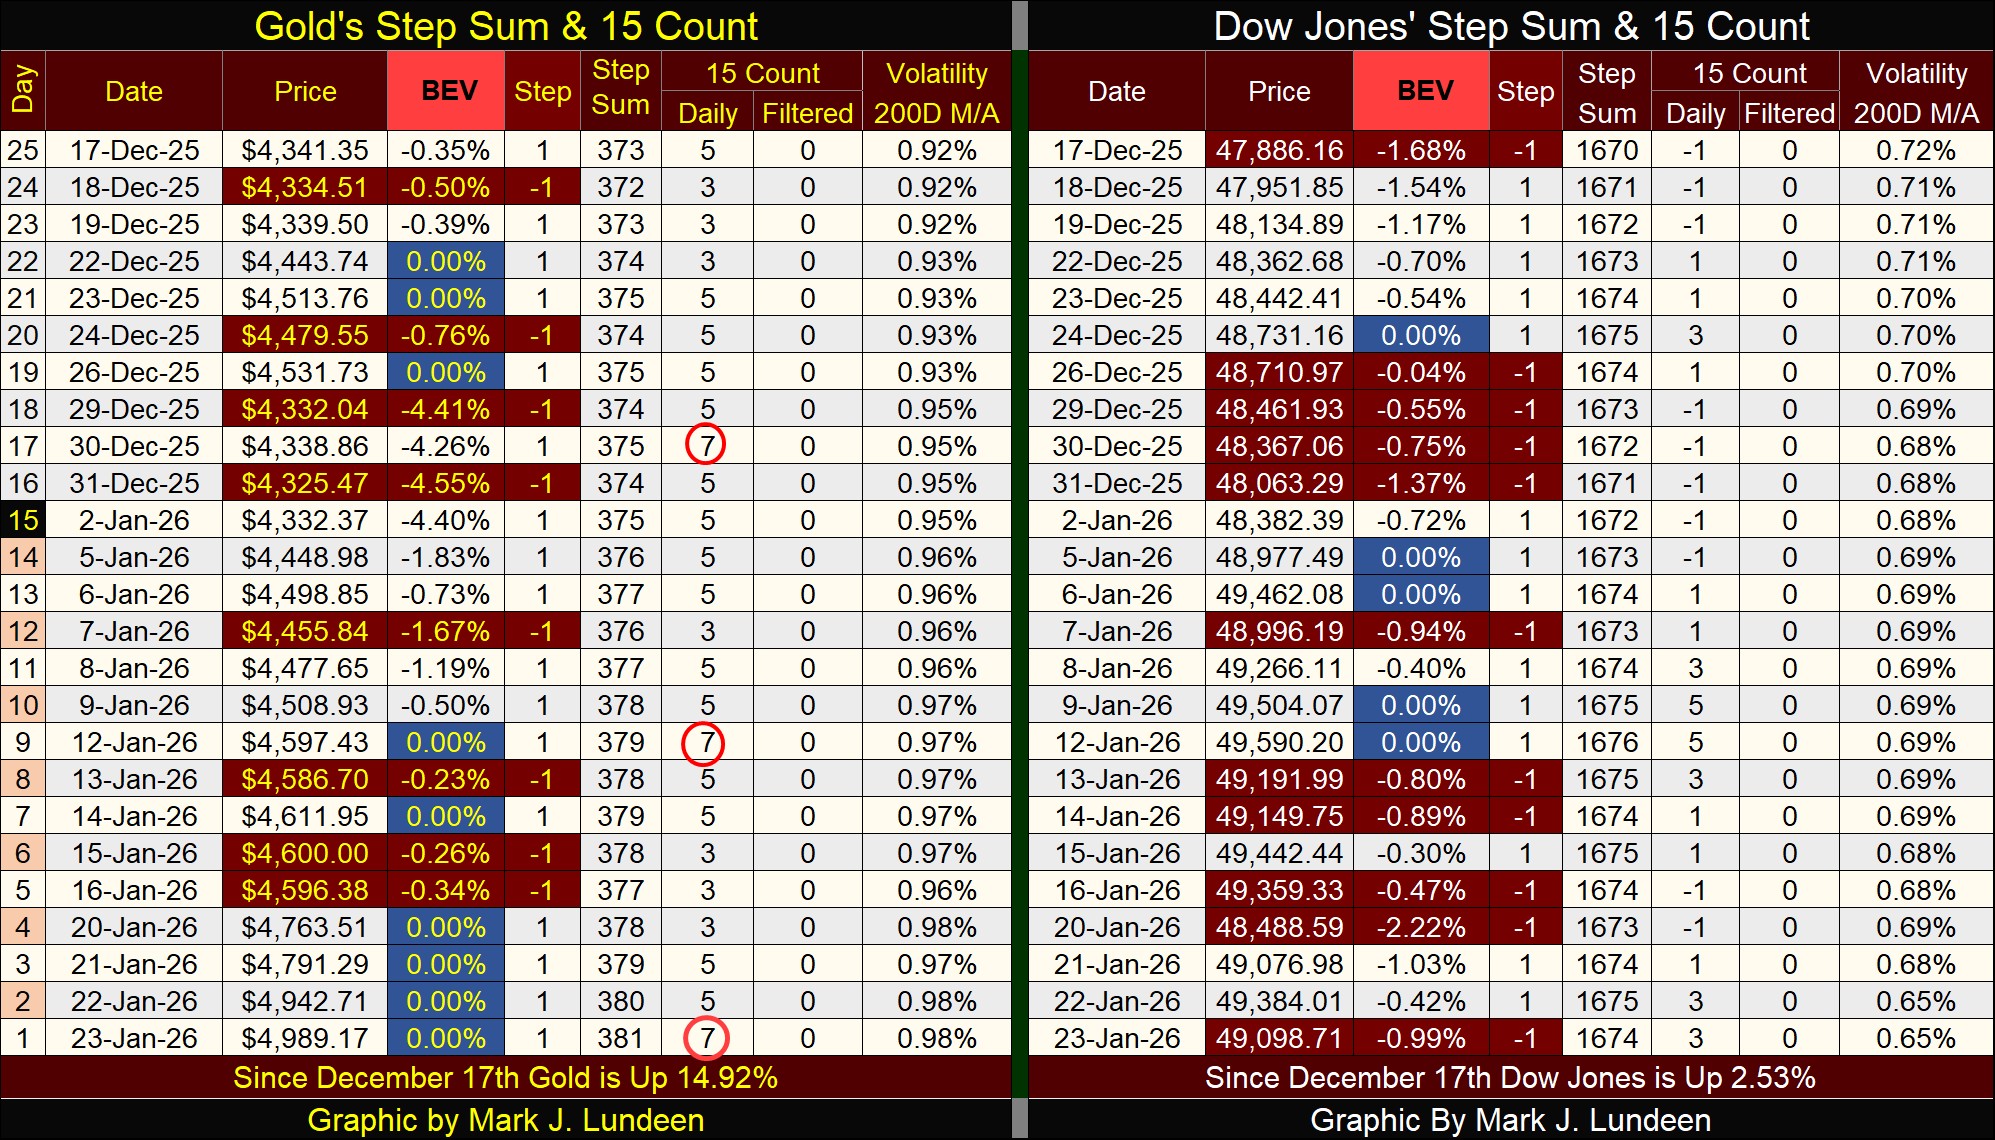
On the Dow Jones side of the step sum table above, all looks well. Since December 17th, the Dow Jones has seen five new BEV Zeros, and closed the week less than 1% away from making its sixth new all-time high. Daily volatility is coming down, and that is a big issue for the continuing health of this Dow Jones bull-market advance. And since December 17th, the Dow Jones has advanced by 2.53%.
All this is good news for the general stock market. But in the coming weeks, months and years, the real action will be found in the old monetary metals, and their miners. The stock market is going to be increasingly recognized for something it has become; a bad habit that investors will have to kick for their own good.
Mark J. Lundeen
********


