Precious Metals Complex Combo Chart


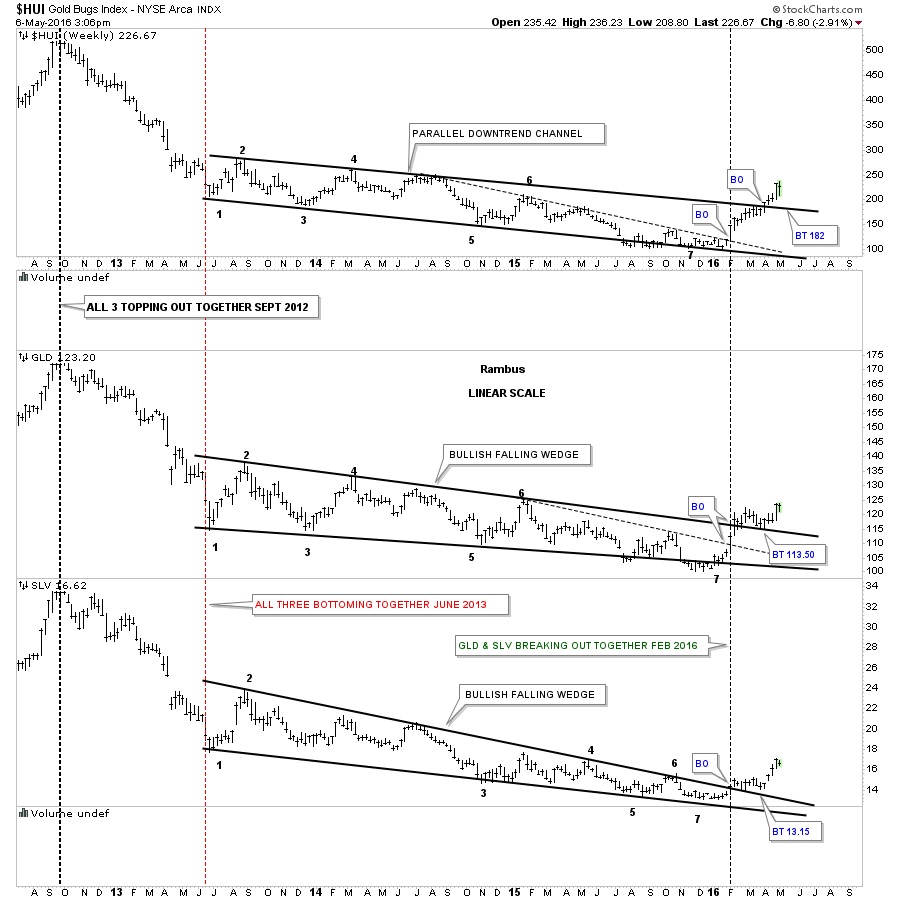
Below is a long-term weekly chart we’ve been following which shows the breakouts and back-testing that have been going on for several months with GLD and SLV, and just 5 weeks or so for the HUI. This big picture look from 35,000 feet shows how infant this new bull market is right now. It was basically born back in January of this year and is just opening its eyes. What we want to see now is a higher high in the coming days and weeks.
 Meet Rambus, a seasoned trader and technical analyst renowned for his unbiased and insightful chart work. Through his website, Rambus Chartology, and Substack newsletter, Rambus shares his expertise with a global community of subscribers, providing daily updates, commentaries, and hands-on training in the art and science of chartology. With his calm, humble, and down-to-earth approach, Rambus demystifies complex market trends, helping his followers navigate the challenges of today's volatile markets. Join the Rambus Chartology community today and discover a unique blend of technical analysis, trading expertise, and time-tested protocols. Subscribe now at www.rambus1.com or https://rambuschartology.substack.com/


