Precious Metals Ratio Charts


I can remember there were times during the PM complex bull market before 2011 that sometimes the PM metals would rally but the PM stocks were very weak. Then there were times when the PM stock would rise while the PM metals moved very little. At the time of those occurrences it was bewildering as common sense suggested they should all move together and the stronger the metals moved so should the PM stocks. I don’t have a good answer for the bifurcation at times only that it can happen.
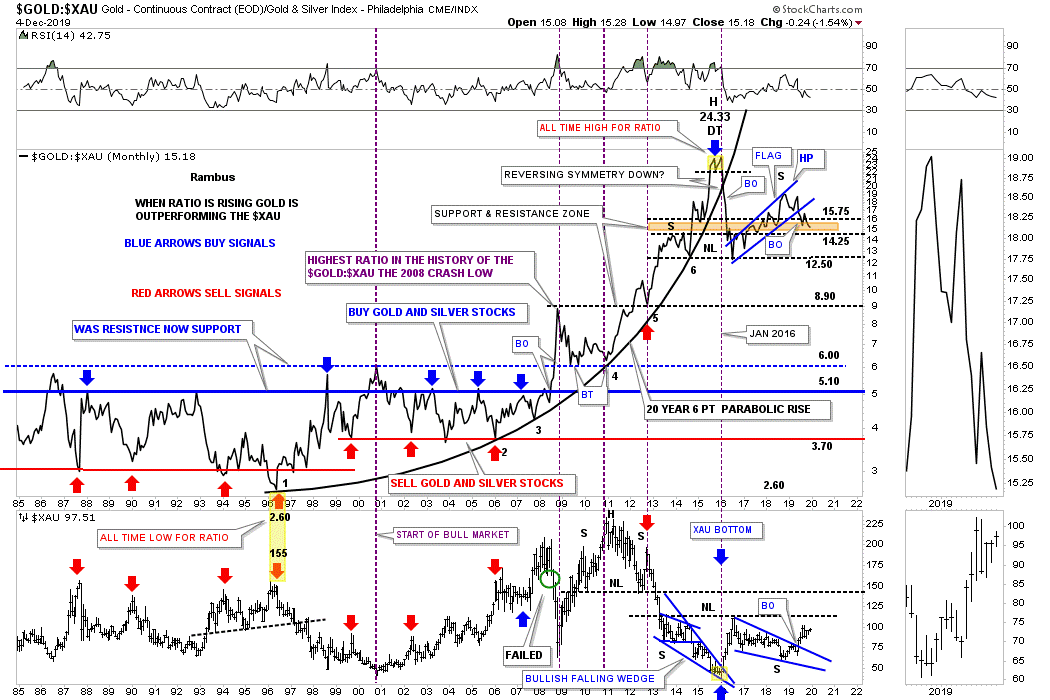
This first chart for tonight is the old ratio combo chart which has the Gold:XAU ratio on top with the XAU on the bottom. When the ratio is rising gold is outperforming the XAU. Going all the way back to 1996 you can see that gold outperformed the XAU in parabolic fashion until the top in January of 2016 which lasted about 20 years. When that 20 year parabolic arc gave way in early 2016 that broke the back of gold outperforming the XAU.
After the initial breakdown gold began to outperform the XAU once again forming the blue bear flag that took almost 3 full years to complete. The ratio broke down from that 3 year blue bear flag in early June of this year with the recent backtest to the underside of the bottom rail so all the work now looks complete. What this ratio chart is showing us is that we should now expect to see the XAU along with the other PM stock indexes outperforming gold. After 20 years of underperforming gold it now looks like it’s the XAU and PM stocks turn to outperform gold in a big way. I’ve often wondered if we’ll ever see the ratio trade all the way down to its old horizontal trading range between 5.10 and 3.70 which lasted for most of the life of the ratio.
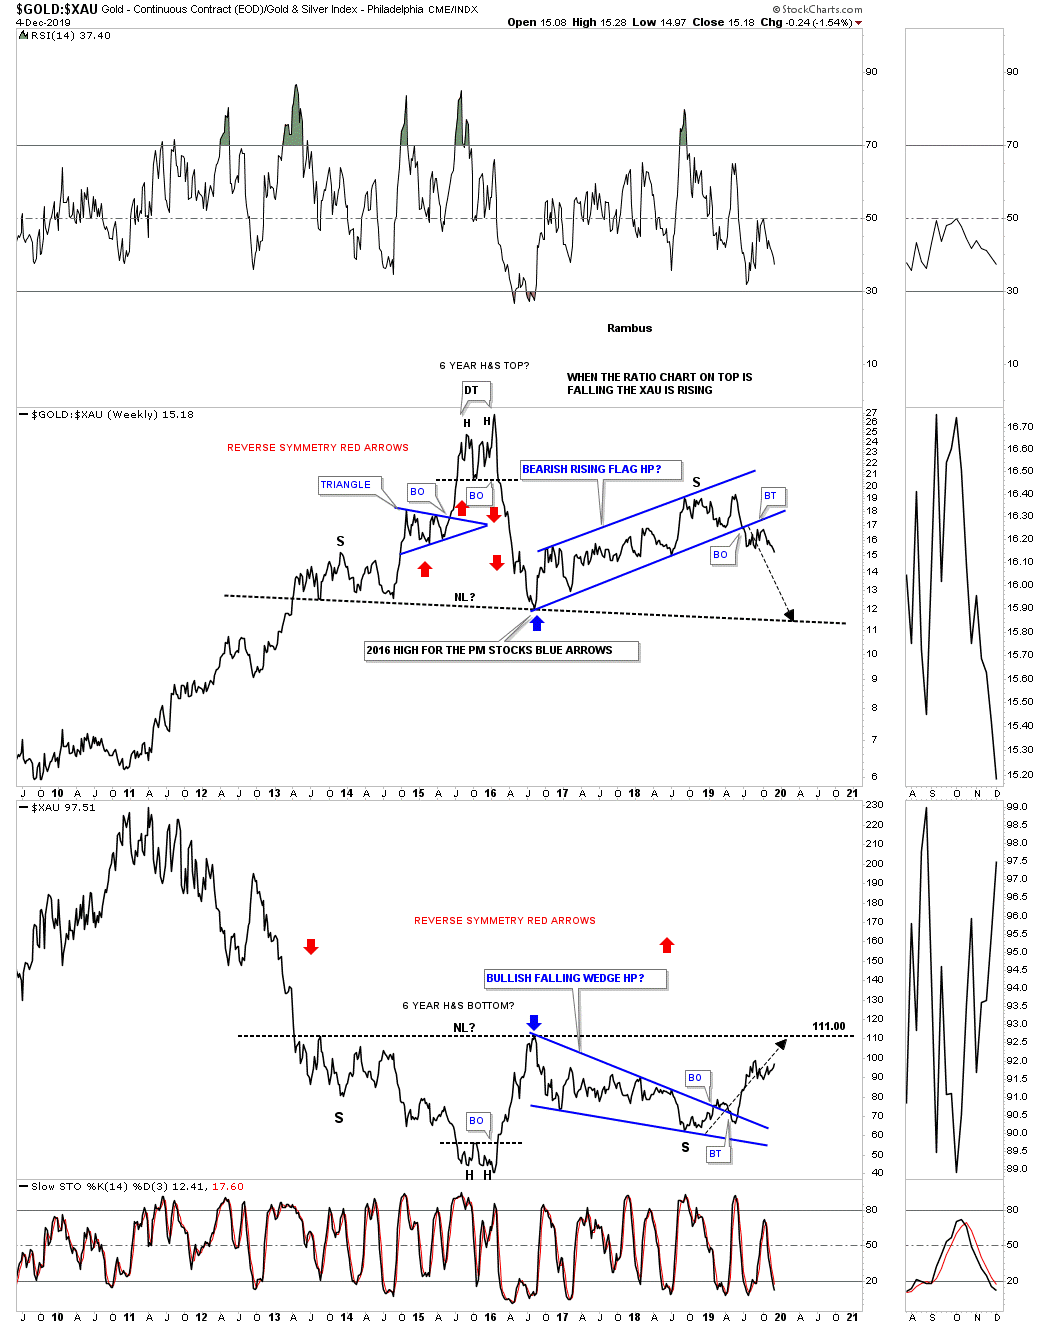
Next is the 7 year weekly chart which has the Gold:XAU ratio on top with the XAU on the bottom, same as the monthly chart above. This chart reminds me of the “Jaws of Life” chart for the INDU we followed for several years waiting for the breakout to finally happen. It’s been several years since I first posted this chart waiting patiently for the breaking out and backtesting process to complete which now looks to be finished as the ratio chart is making a new low this week vs the July low.
What I find is so intriguing about this ratio combo chart is the possible massive H&S top on the ratio and the equally massive H&S bottom on the XAU. Again, after 20 years of gold outperforming the XAU we should now see something similar for the XAU and the rest of the PM stocks as they work their way back to normal, where ever that ends up being, hopefully between 3.70 and 5.10.
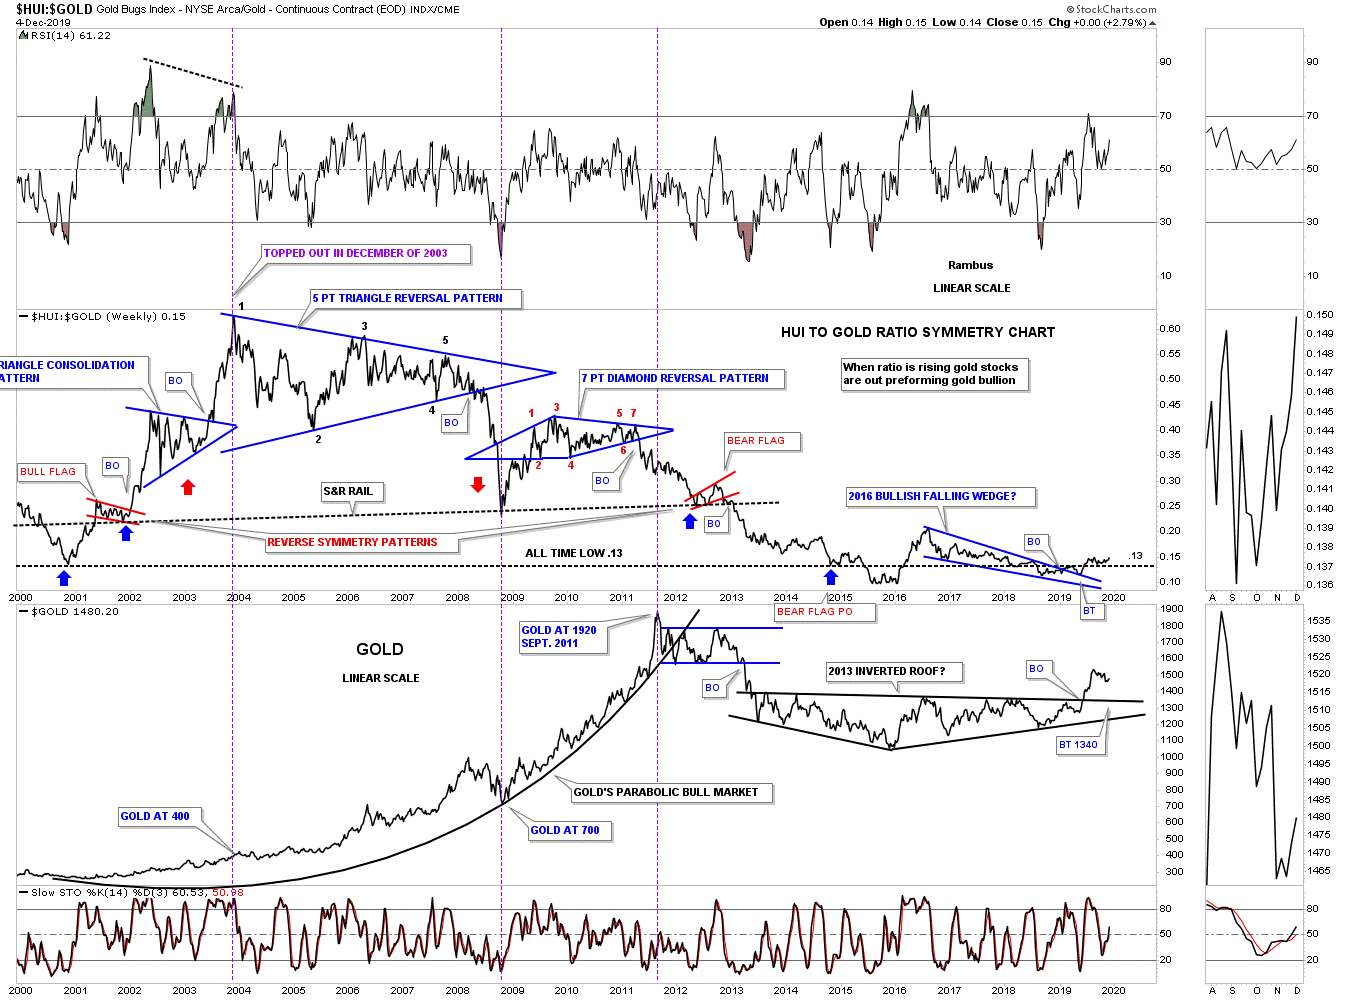
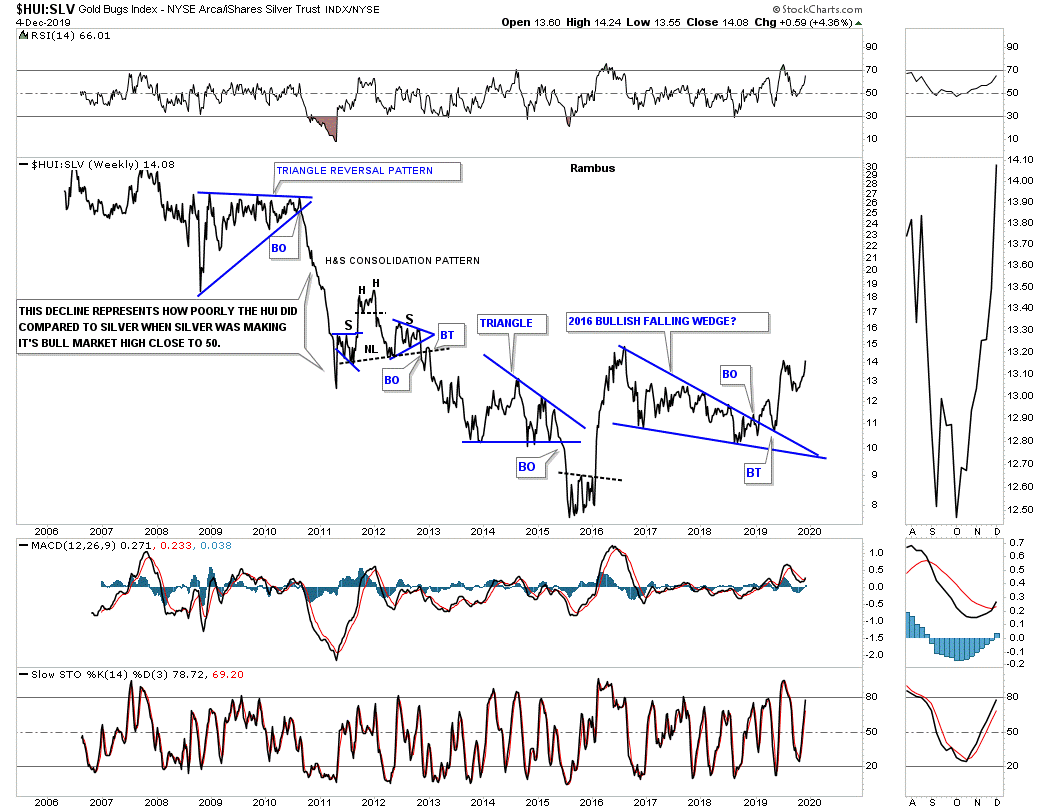
Below is another old ratio combo chart we’ve been following for many years which has the HUI:Gold ratio on top with Gold on the bottom. Here again you can see how the HUI has underperformed gold in a big way going all the way back to the ratio high in December of 2003. Even though the HUI was in a bull market until 2011 you can see how it underperformed gold. Note the 2016 bullish falling wedge with the backtest completing in June of this year. The ratio hasn’t set the world on fire yet with its recent rise but the price action is starting to curl up while gold is still curling down which means the HUI is beginning to outperform gold in a modest way. What we want to see is the ratio chart on top performing like it did from the 2000 low to the 2003 high. Those were the days to be holding PM stocks.
Next is the 5 year weekly chart for the HUI:Gold ratio which shows the 2016 bullish falling wedge with the breakout and backtest looking complete. There is also that classic 18 month H&S bottom which formed at the last reversal point with the left shoulder and head forming inside the falling wedge and the right shoulder low forming on the backtest to the top rail. The next thing we need to see is for the ratio to make a new higher high above the September 3rd high.
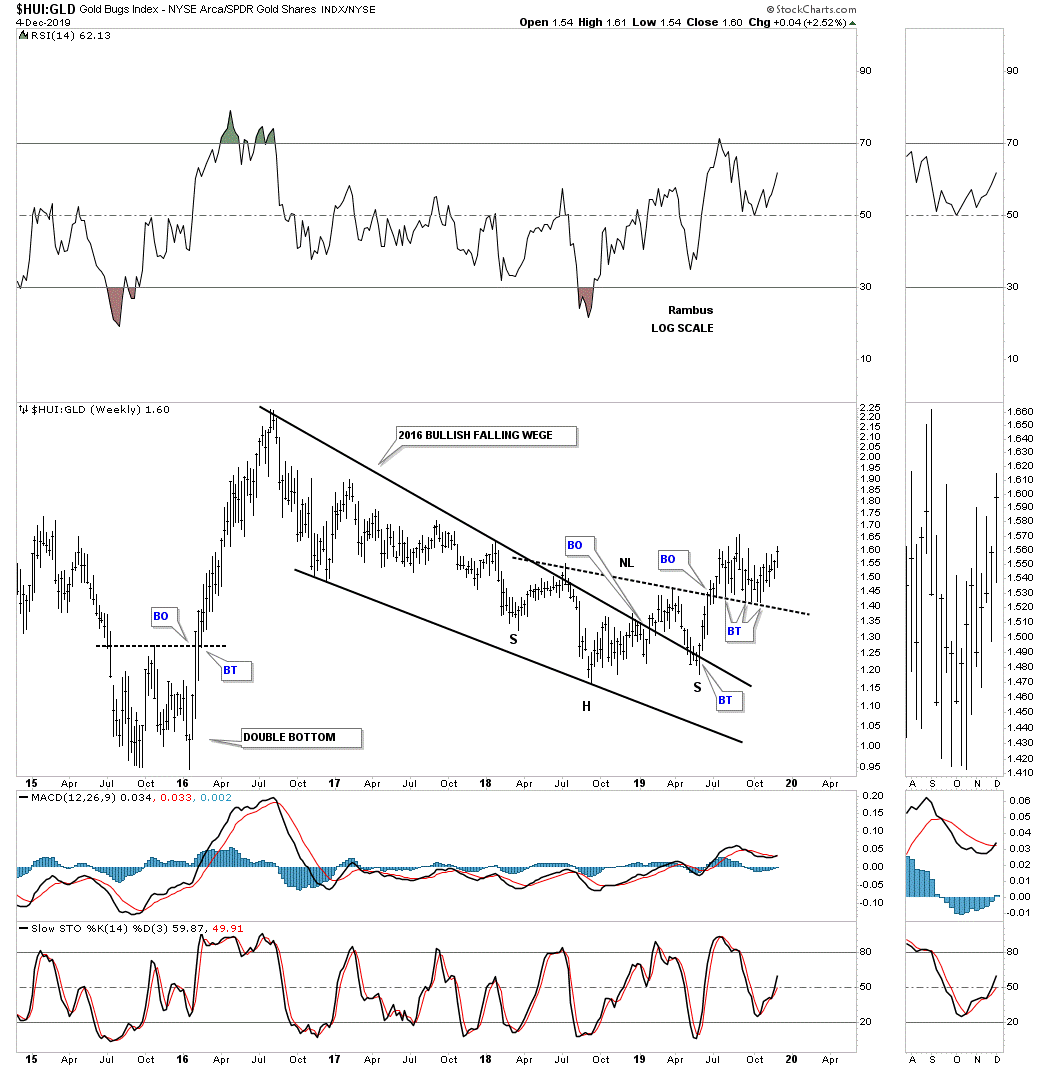
I can still remember one of the most frustrating times toward the end of the bull market was when SLV was going parabolic into its April 2011 high while the HUI / PM stocks in general barely moved. You can see the underperformance when you look at the vertical move down in the ratio from 2010 to 2011. In hindsight that was probably a very big clue that the end of the bull market was near. The ratio finally bottomed in late 2015 and has been moving up slowly but surely after breaking out and backtesting its 2016 bullish falling wedge. The ratio is getting very close to making a new higher high.
Almost everyone has noticed a big divergence with silver to the silver stocks over the last month or so. Yesterday I showed you the H&S bottom on SIL with the breakout. Today while Silver declined sharply the SIL backtested its neckline and held support.
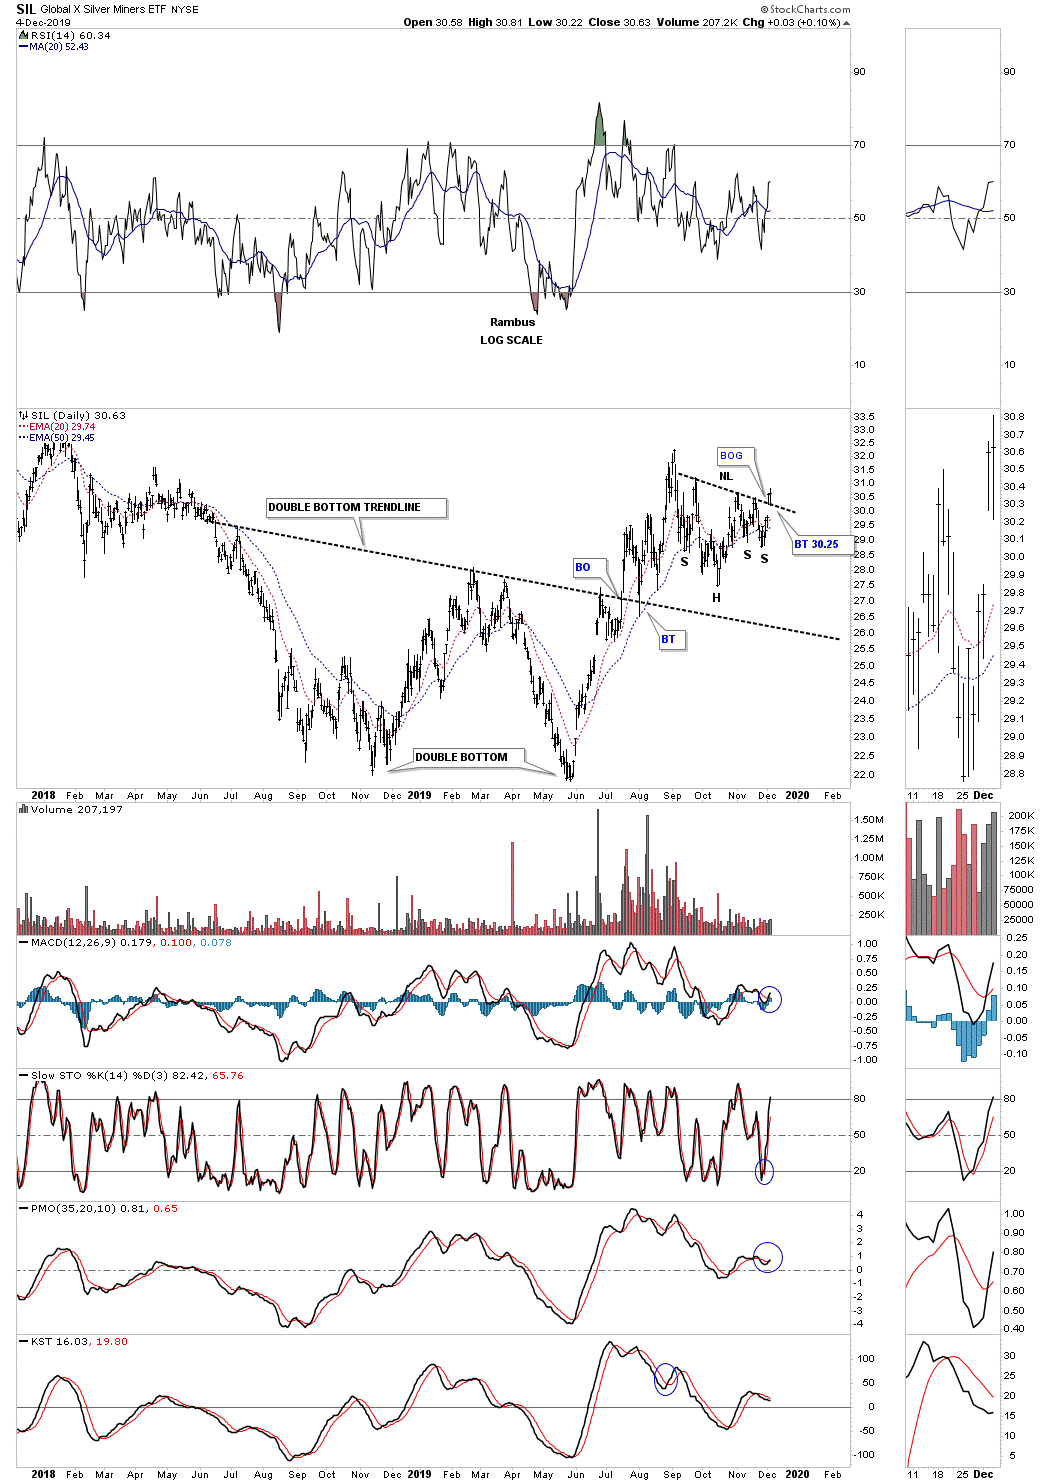
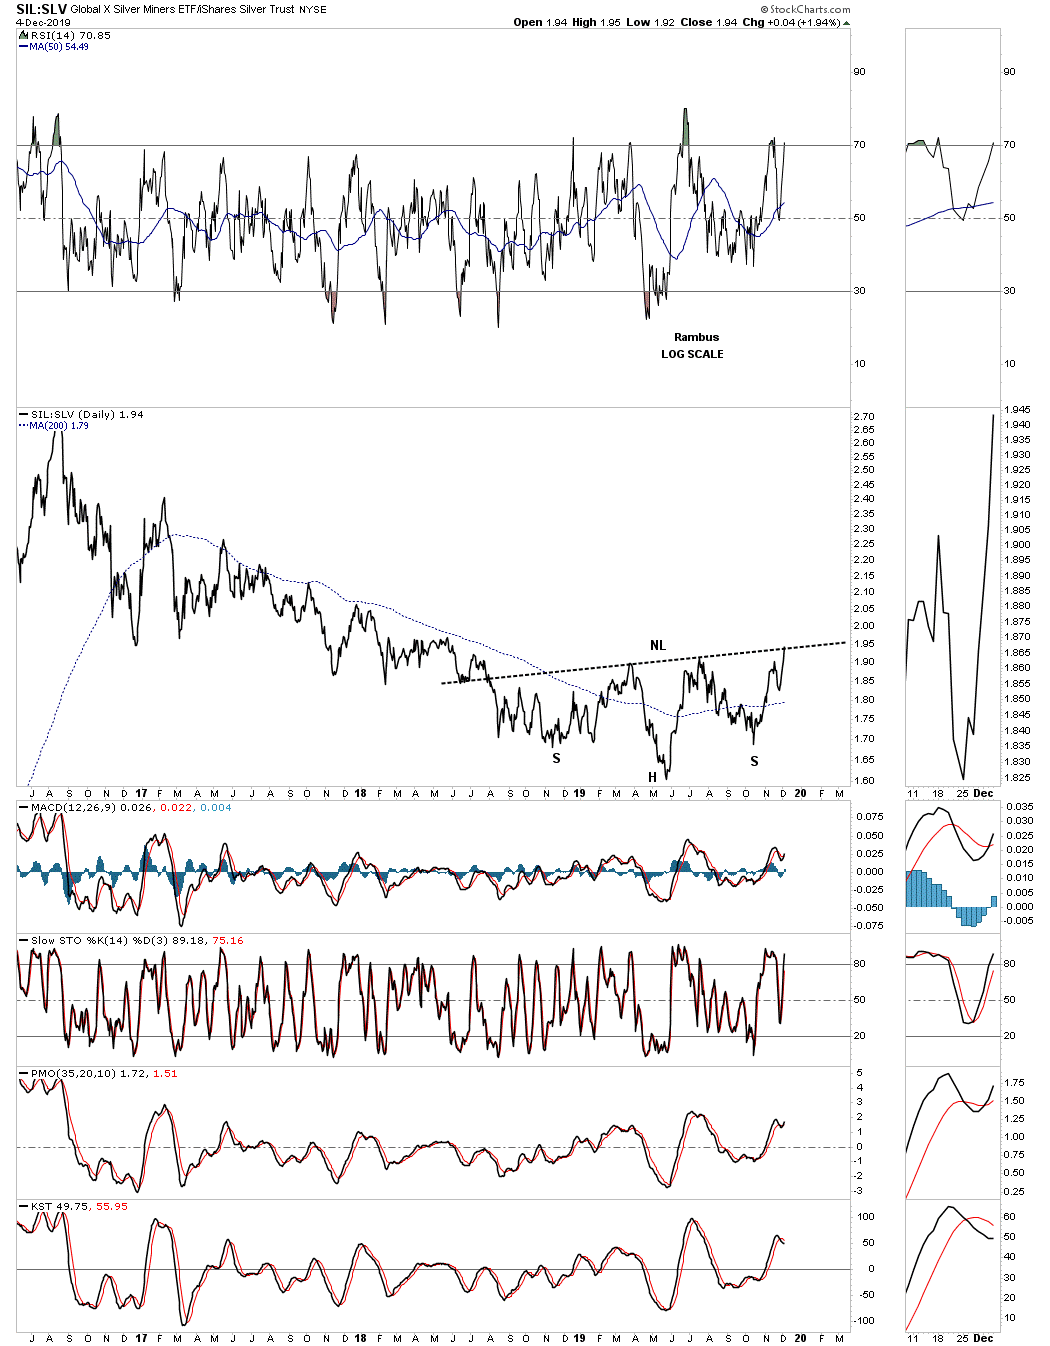
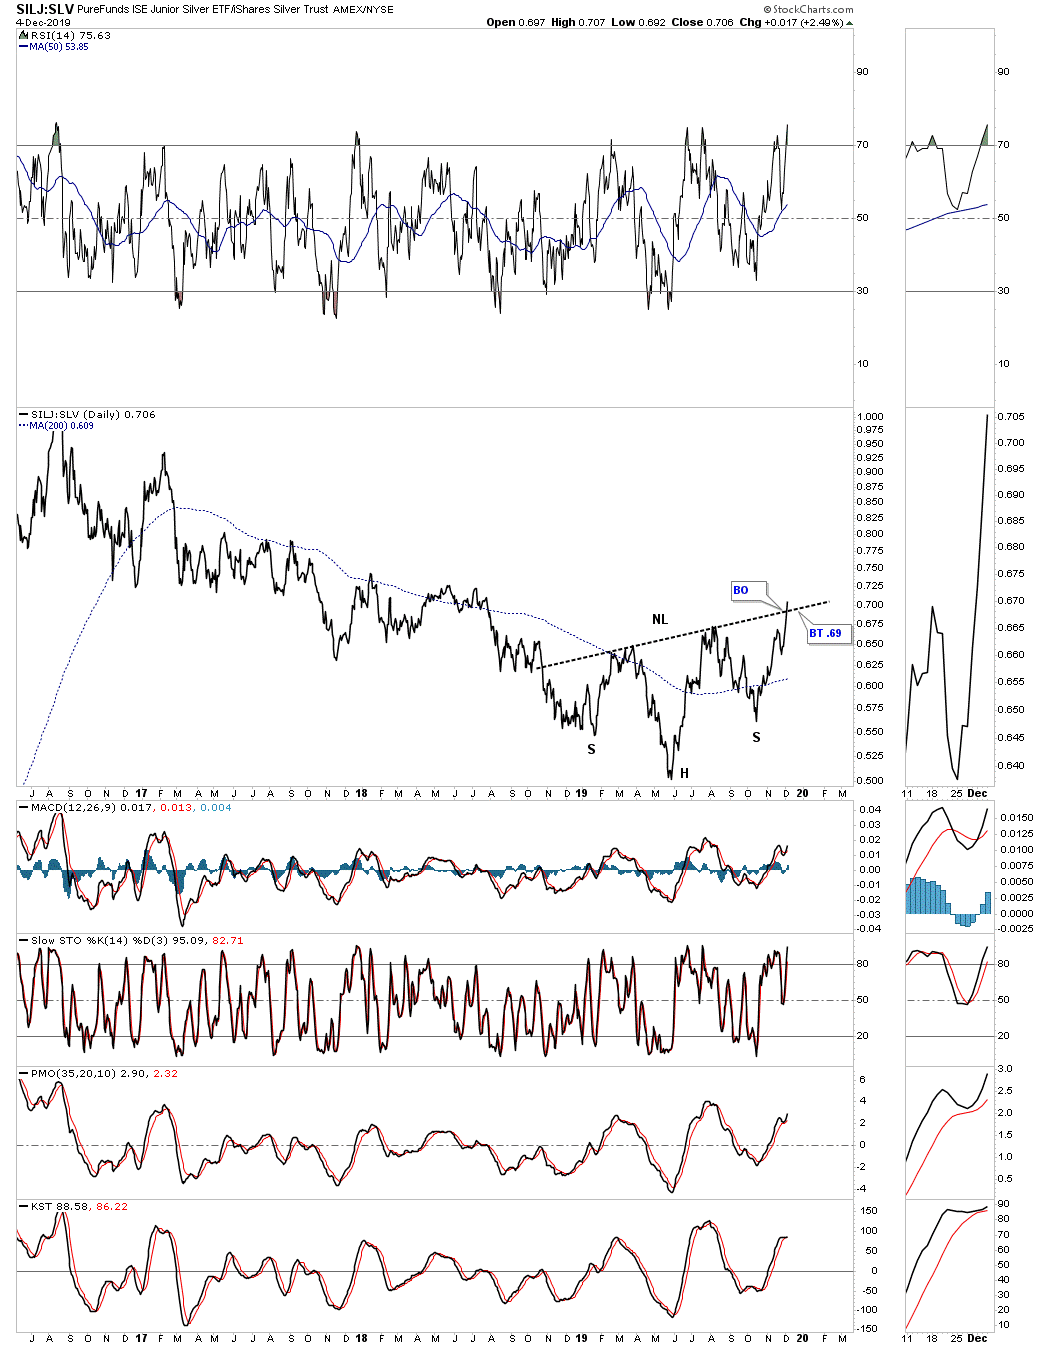
This morning Sir Fully posted a couple of ratio charts, one that compared the SIL:SLV and the other one compared the SILJ:SLV. I don’t know if he noticed it but both ratio charts have formed pretty large H&S bottoms. Today the SIL:SLV ratio, silver stocks, touched the neckline while the SILJ:SLV ratio, junior silver stocks, actually broke out above its large H&S bottom neckline.
One thing we like to see in a strong bull market is for the PM stocks to outperform the metals which hasn’t been the case in a long time. All these charts tonight now show that the PM stocks are taking the lead which is a very healthy development. This is one of the major clues I’ve been waiting for to get back into the PM stocks. They have a lot of catching up to do so don’t be discouraged if the metals aren’t performing well because the PM stocks are going to outperform and hopefully in a big way if these ratio combo charts have anything to say about it. All the best…Rambus.
SIL:SLV ratio chart:
SILJ:SLV ratio chart:
*********
 Meet Rambus, a seasoned trader and technical analyst renowned for his unbiased and insightful chart work. Through his website, Rambus Chartology, and Substack newsletter, Rambus shares his expertise with a global community of subscribers, providing daily updates, commentaries, and hands-on training in the art and science of chartology. With his calm, humble, and down-to-earth approach, Rambus demystifies complex market trends, helping his followers navigate the challenges of today's volatile markets. Join the Rambus Chartology community today and discover a unique blend of technical analysis, trading expertise, and time-tested protocols. Subscribe now at www.rambus1.com or https://rambuschartology.substack.com/


