On Rapid Descent Of Dow Index 2020-2021
 share
share
 share
share
 share
share
 share
share
 share
share
Major Reasons for Imploding Dow
This article examines the major factors that caused the rapid decline of the Dow index. We select the 1929 Great Depression model for the study. As we mentioned in our earlier articles, our current crisis situation is most similar to the 1929 Depression. We observe the following key points:
- The Covid-19 plaque is just a trigger. The seeds of current deflation have been sown long time ago.
- We disagree with many analysts that there will soon be high inflation. We affirm that deflation will last a very long time from now in excess of 4-5 years.
- In spite of our government’s fearless monetary printing, common people are just not spending money. In technical term, the Money Velocity (M2V) measure is at historical low. The cheering leading of President Trump’s team will be of no avail. The debt in all aspects of our nation is too high.
- The wealth gap between the rich and poor is also at historical high. The majority of the people have no discretionary income to spend.
Forecast of Dow Descent Near-Term
Our forecast is based on the 1929 Depression Model as discussed in our earlier articles. This forecast is for 2 years. The absolute bottom will be reached in 4+ years.
Chart 1 – Rapid DOW Descent using Great Depression Model
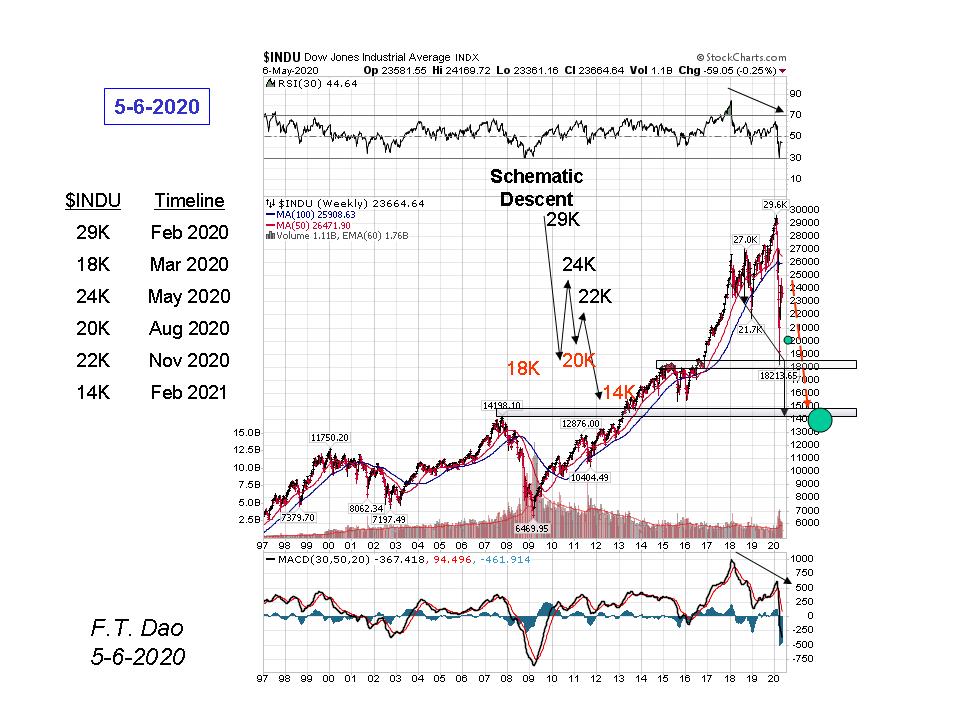
The pattern of declines and the approximate dates are given as guidance only. This should be compared to the market volatility measures in the next section.
World Turmoil by Covid-19 Epidemic
The equity market does not like turmoil, i.e. high Volatility. The following chart showed the correlation between DOW and the Inverse VIX (1/VIX). The Inverse VIX has an advantage in that this measure precedes the top of DOW, and it leads the decline. From the chart, we see no real bottom in 2-3 years.
Chart 2 – DOW and Inverse VIX
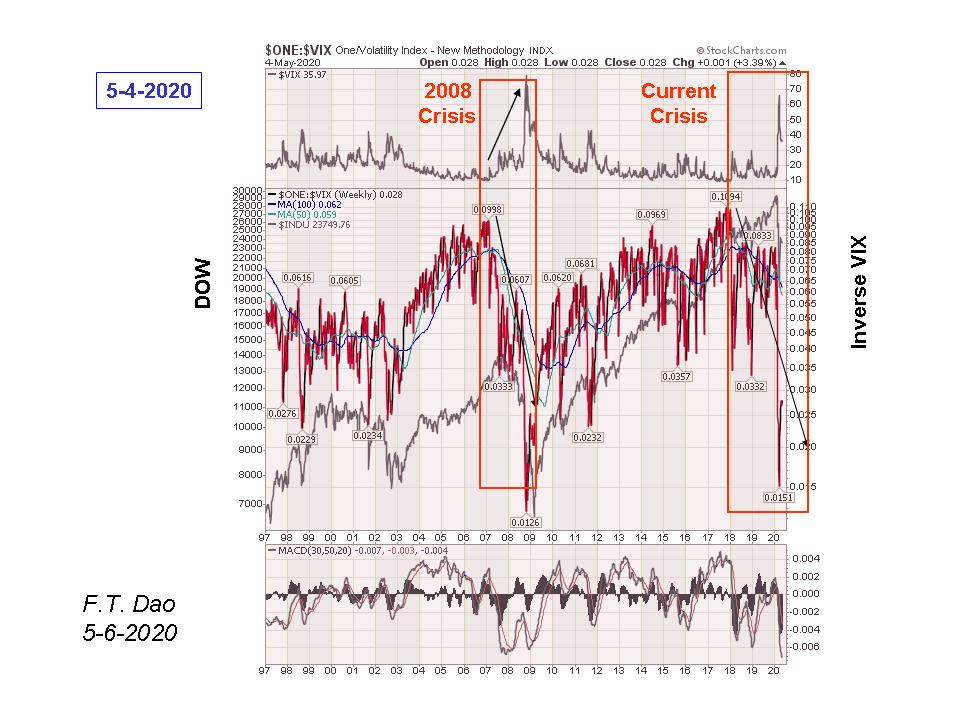
Inverse VIX is the opposite of VIX
The Wide Wealth Gap
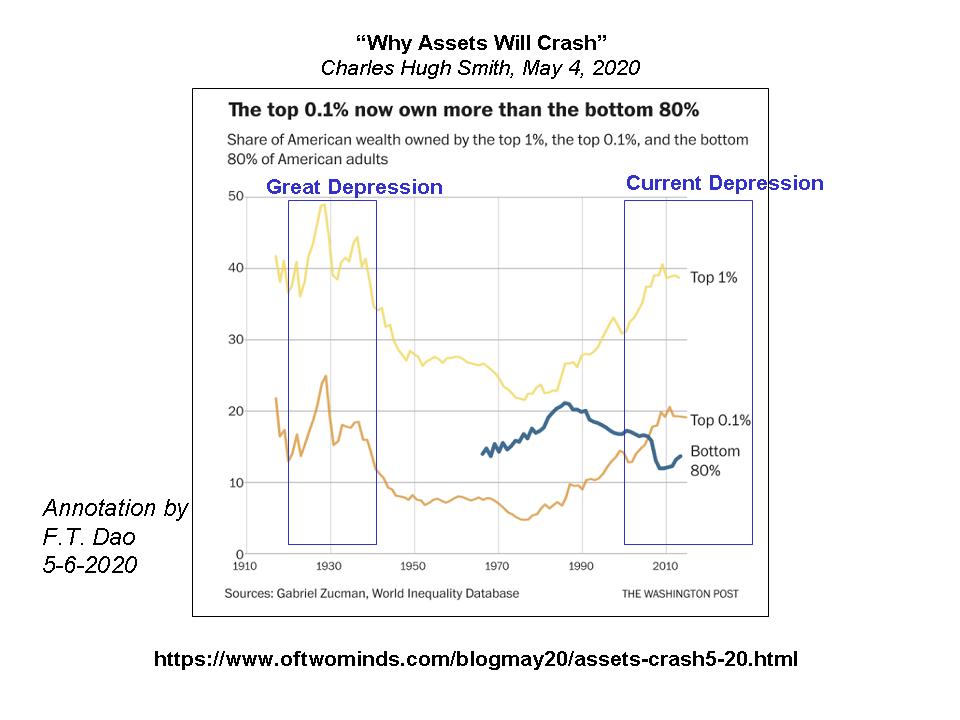
Recently Charles Smith reported on a very interesting wealth gap between the rich and the poor. Such a wide unhealthy gap only occurred twice in our history. During these periods, the bottom 80% population own less than 20% of entire national wealth. No wonder the Fed has to buy up everything in sight. Even Warren Buffet sold all airline stocks and maintained a substantial amount of cash.
Chart 3 – Profile of Extreme Wealth Gap
Crazy Printing leads only to Extreme Low Money Circulation
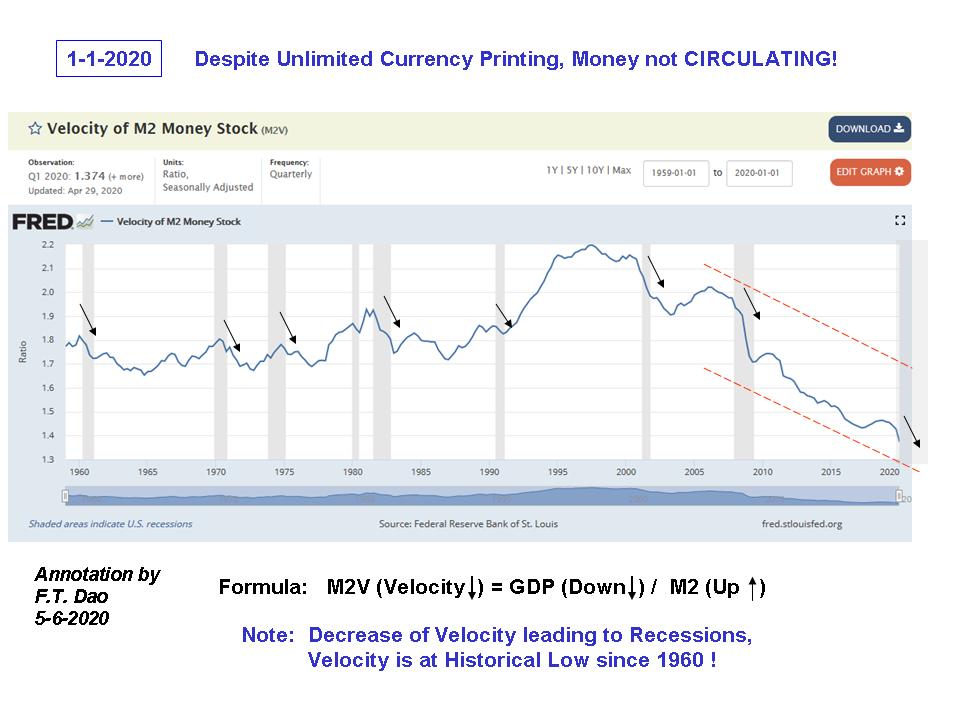
Why does unlimited monetary printing not lead to high money circulation and thus high inflation? The simple answer is: loss of faith in fiat (fake) money by the citizens. The analyst’s talk of high inflation is just false. One is advised to study the formula of Money M2 Velocity in the following chart.
Chart 4 – Profile of Monetary M2 Velocity & Recessions
Summary
We conclude that the Dow index will continue to fall in 2020 and 2021. This is Nature’s process of cleansing the misdeeds of the past. We as individuals can only prepare to do our best to survive near-term and to thrive in the future.
We are not certified or qualified financial advisors. Please consult your certified financial advisors for actual trading and investing.
*********
share
share
share
share
share


