Rare Signal For Gold And U.S. Stocks


Last week's trading saw gold once again saw its high for the week made in early-week trading, here doing so with Monday's tag of the 1757.40 figure. From there, a sharp decline was seen into later in the week, here dropping all the way down to a Friday low of 1683.00 - before bouncing just slightly to end the week.
Gold 's Near-Term Picture
For the very short-term, the most dominant cycle that we track is the 34-day wave, which, as mentioned in past weeks, has been pointing south. The next good rally phase should come from this same component, and which is due to materialize at anytime. Here again is that 34-day cycle:
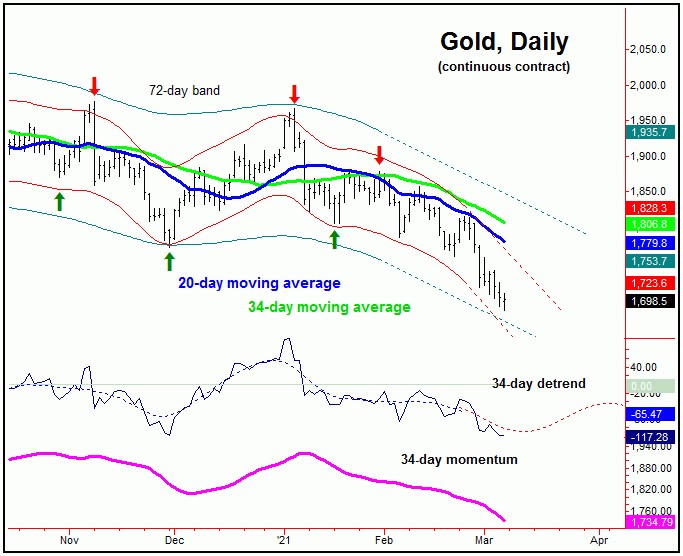
As of Friday's session, our 34-day wave is now some 34 trading days along - and with that is right into its average range for a bottom. Once the low for this cycle is set in place, the probabilities will favor a minimum rally back to the 34-day moving average for the metal, with that key moving average currently at the 1806 figure and declining - over 100 points from current price levels.
Having said that, there is the decent potential for additional strength through our 34-day moving average, due to the fact that the current downward phase of this wave should also end up as the bottom for the larger 72-day cycle, which is shown below:
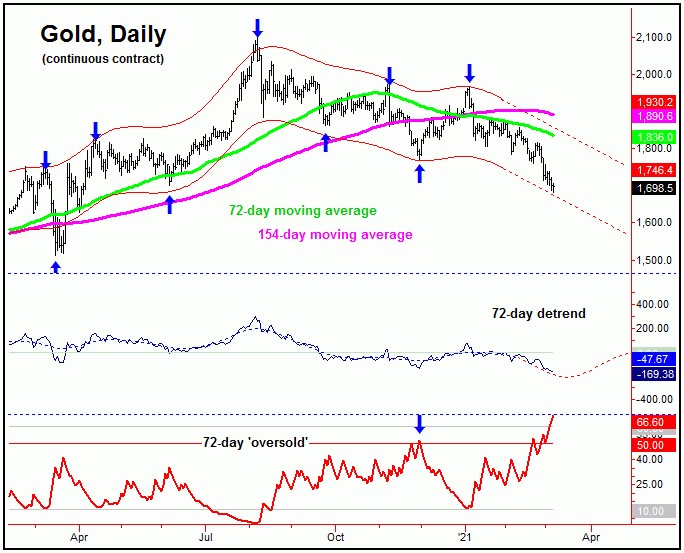
On the chart above, we can see our cycle detrend indicator is projecting the bottom for this 72-day cycle to also materialize at anytime. Since cycles are 'harmonic' in nature, the low for the current downward phase of the smaller 34-day cycle should end up as the trough for this 72-day component.
Rare Signal for Gold
Of more key note on our 72-day cycle chart is the red indicator on the chart above, shown in the lowest pane. This is our 72-day 'oversold' indicator, and is a signal that does not appear often. The last time this signal was seen was near the late-November, 2020 trough, which gave way to the sharp rally into early-January of this year. (Note: this indicator is inverse to price action - similar to how the VIX acts in regards to the U.S. stock market).
Going further with the above, we can look at a stepped-back view of this particular indicator, which is shown on the chart below:
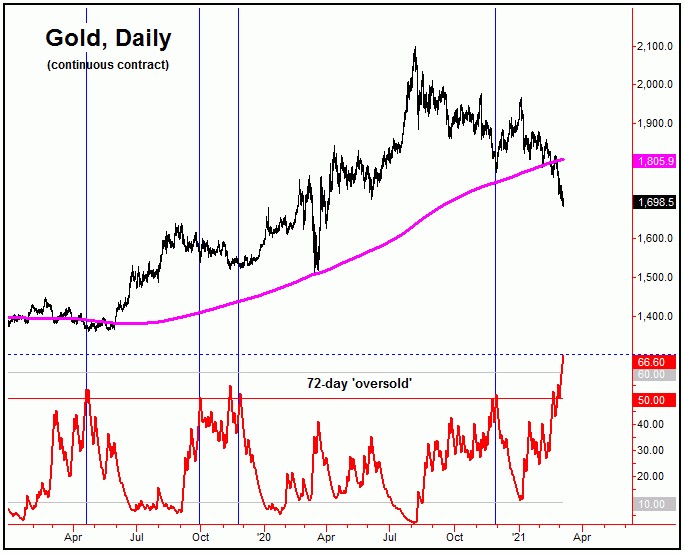
The chart above goes all the way back to early-2019, and shows each instance of our 72-day oversold indicator spiking above its upper reference line. As can be seen on this chart, nearly each instance was near a key low for gold, though not always seen the day of the actual bottom - which no indicator can do.
In other words, even with our 72-day 'oversold' indicator spiking above its upper reference line, this won't mean that lower lows can't continue to materialize, at least in the very near-term.
Having said the above, we do have a key upside ‘reversal point’ for price, one which, if taken out in the days/weeks ahead, would be our best indication that the next short-term rally is in force for the metal, with precise details noted in our thrice-weekly Gold Wave Trader report.
U.S. Stock Market (Update)
As mentioned last weekend, U.S. stocks were seen as being back in correction territory, with the ideal path looking for a drop back to or below the 70-day moving average on the SPX, though with the potential for additional weakness through the same. Take a look at our next chart:
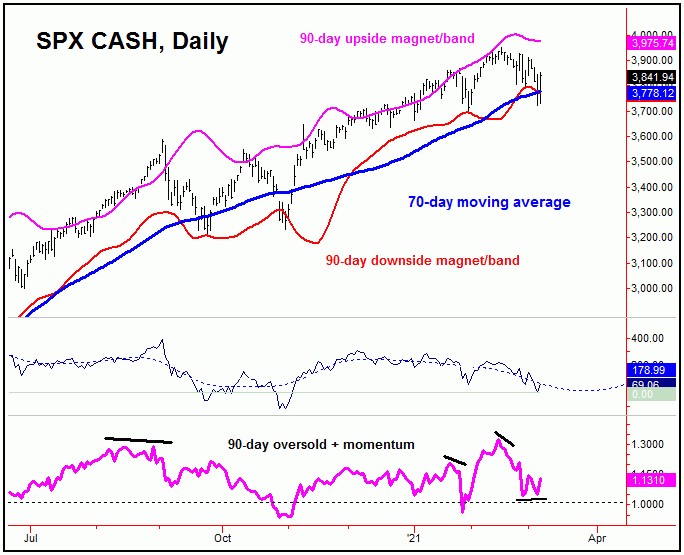
With the above chart, we can see that a spike down to our 70-day moving average was seen into late last week - thus satisfying our expectation in regards to price for the overall correction down. Whether or not the decline has bottomed is still speculation at this point, and would need to be confirmed.
Having said the above, of particular note is that our 90-day 'oversold/momentum' indicator, shown in the lowest pane (in magenta) registered a divergence at the recent new low - which is something seen closer to market tops. On the flip side, the indicator registered a divergence prior to the 3950.43 swing top - which warned of a coming correction. This divergence was also seen prior to the January peak for stocks.
Rare Signal for U.S. Stocks
With the action seen into last Thursday's close, a rare signal was also generated for the U.S. stock market, which is our SPX/VIX bottoming pattern - which is shown below:
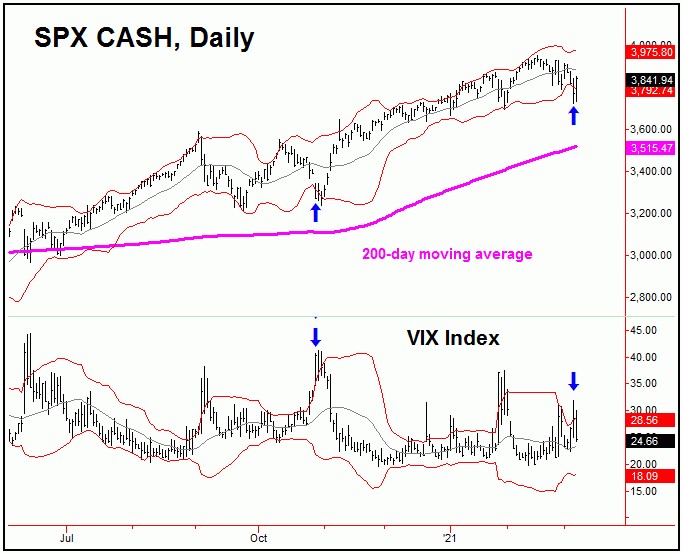
The SPX/VIX bottoming pattern is also a rare one, and one which will often appear at or near market bottoms, within a larger uptrend – or at least will seen as an initial warning to the same.
This particular setup occurs when the SPX closes below it’s daily Bollinger band, and - on the very same day - the VIX index closes above it’s own daily Bollinger band. This signal occurred at Thursday's close, with the SPX closing that day at the 3768.47 figure.
As mentioned above, the SPX/VIX setup that does not occur often - perhaps only 1-3 times per year - and is a pattern that can often be seen near or just ahead of key market bottoms. This is even more important, when the 200-day moving average is pointing higher on the SPX - which is the case here.
U.S. Stocks, Mid-Term
For the mid-term picture for U.S. stocks, the larger uptrend is favored to remain intact well into next year, before the next major price top attempts to form. With that, any corrections in-between are favored to end up as eventual countertrend affairs, giving way to higher highs, upon completion. Even said, it is still too early to confirm the next upward phase to be back in force, though we will continue to monitor this in real-time, as we move along. Stay tuned.
Jim Curry
The Gold Wave Trader
http://goldwavetrader.com/
http://cyclewave.homestead.com/


