Real Estate is Becoming a Problem Again


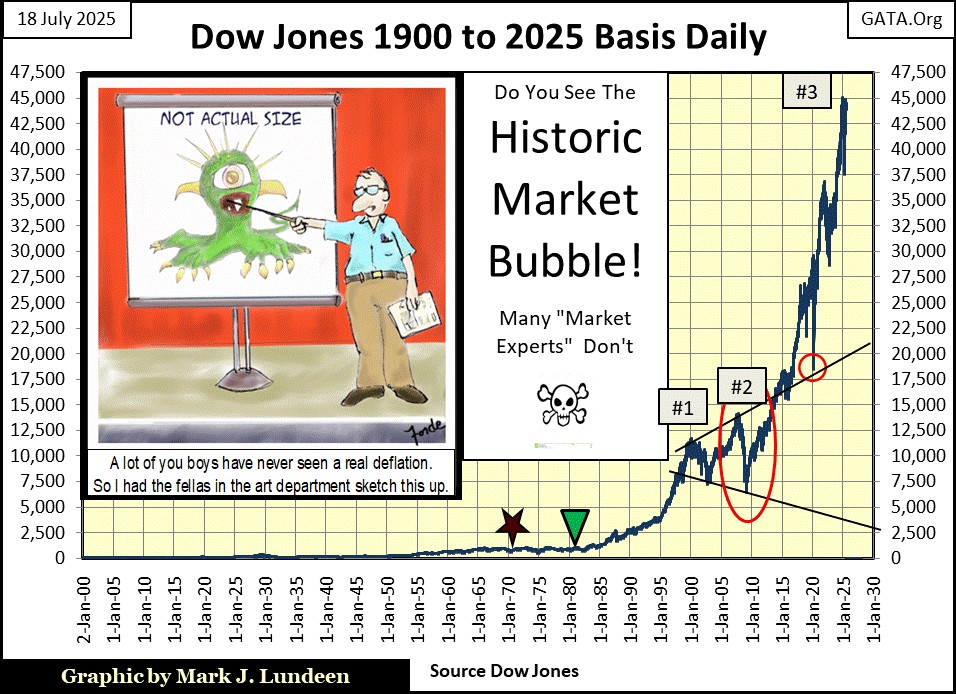
This was a very slow week for anything I follow in the market. So, I thought I’d review my Bear’s Eye View (BEV) charting technique for new readers of my articles. First, why would a new charting technique be needed? If someone is interested in historical market data, and I am, charting market data in the dollars it is published in, quickly becomes nonsensical when charting in dollars. For instance, the Dow Jones in the chart below, plotted in its dollar values since January 1900.
Where is the Roaring 1920s’ Bull Market, and the Great Depression Crash? In the chart below, plotted in the dollars the Dow Jones was published in, these historic market events have disappeared. How could they not? The peak of the Roaring 1920s’ bull market happened on 03 September 1929, with the Dow Jones closing at a then astounding 381.17 points. Today in 2025, the Dow Jones frequently moves from one day to the next by that much, and more without much market commentary.
The difference between 1929 and today, is in 1929, the dollar was defined in terms of gold, at $20.67 / ounce of gold. In other words, the US Treasury could only issue $20.67 paper dollars for each ounce of gold held in its reserves.
But America’s bankers, and politicians, assisted by academics who were looking for steady work managing “monetary policy” at the Federal Reserve, didn’t like gold performing this most effective check on paper money inflation. So, they got rid of gold as money, and the dollar’s new monetary policy became one of monetary inflation, as admitted by former FOMC Idiot Primate; Benjamin Bernanke in his quote below.
The context for this quote is; in November 2002 the stock market was still reeling from the crash in NASDAQ High-Tech shares. Doctor Bernanke was pointing out how to reinflate the valuations in the stock market; print as many dollars as needed to make that happen.

Because the “policy makers” have taken the dollar off the gold standard, enabling them to inflate the volume of dollars in circulation by vast quantities, charting the daily values of the Dow Jones since January 1900 in dollars, looks like the chart below; a huge inflationary bubble. What a mess!
By the way, box #1 is the Dow Jones’ top for the NASDAQ High-Tech bubble. Box #2 is the Dow Jones’ top for the sub-prime mortgage bubble. Each of these bubble tops were seen as huge bull market tops at the time. But since then, the idiots at the FOMC have worked overtime inflating the Dow Jones to its current bull market top, last December’s 45,014.
Well, the higher one flies, the farther one has to fall. When this inflationary boom becomes a deflationary bust, it will be as bad as the market crash of the 1930s, if not worse.
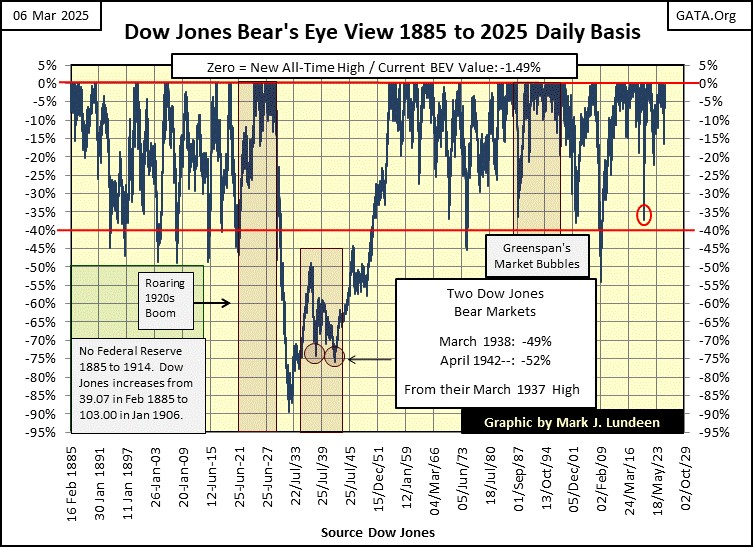
A more logical way of understanding the historic Dow Jones, would be to ignore the dollars it is published in. Instead, looking at it in terms of all-time highs, and percentage claw-backs from those all-time highs, which is exactly what the Bear’s Eye View does.
Using the dollar price data seen above, converting it into percentage values, restricted into a range of only 100 possible percentage points;
- 0.0% = new all-time highs, aka BEV Zeros,
- -100% = total wipeout in valuation,
we see the Dow Jones in a much more logical, and understandable format for the past 140 years of Dow Jones history; in terms of all-time highs (0.0%) and percentage claw-backs from those all-time highs.
Looking at the Dow Jones in the BEV format (below), without a doubt the horror of the 1929-1932 market crash becomes fully apparent, a crash of 89% from its last all-time high of September 1929. No other bear-market bottom of the past 140 years comes close.
The next deepest bear-market bottom was the March 2009 sub-prime mortgage bottom, a claw-back of 54% from its last all-time high of October 2007. The Bear’s Eye View below, in terms of all-time highs, and claw-backs from them, provides a very logical, and insightful view of the Dow Jones since February 1885.
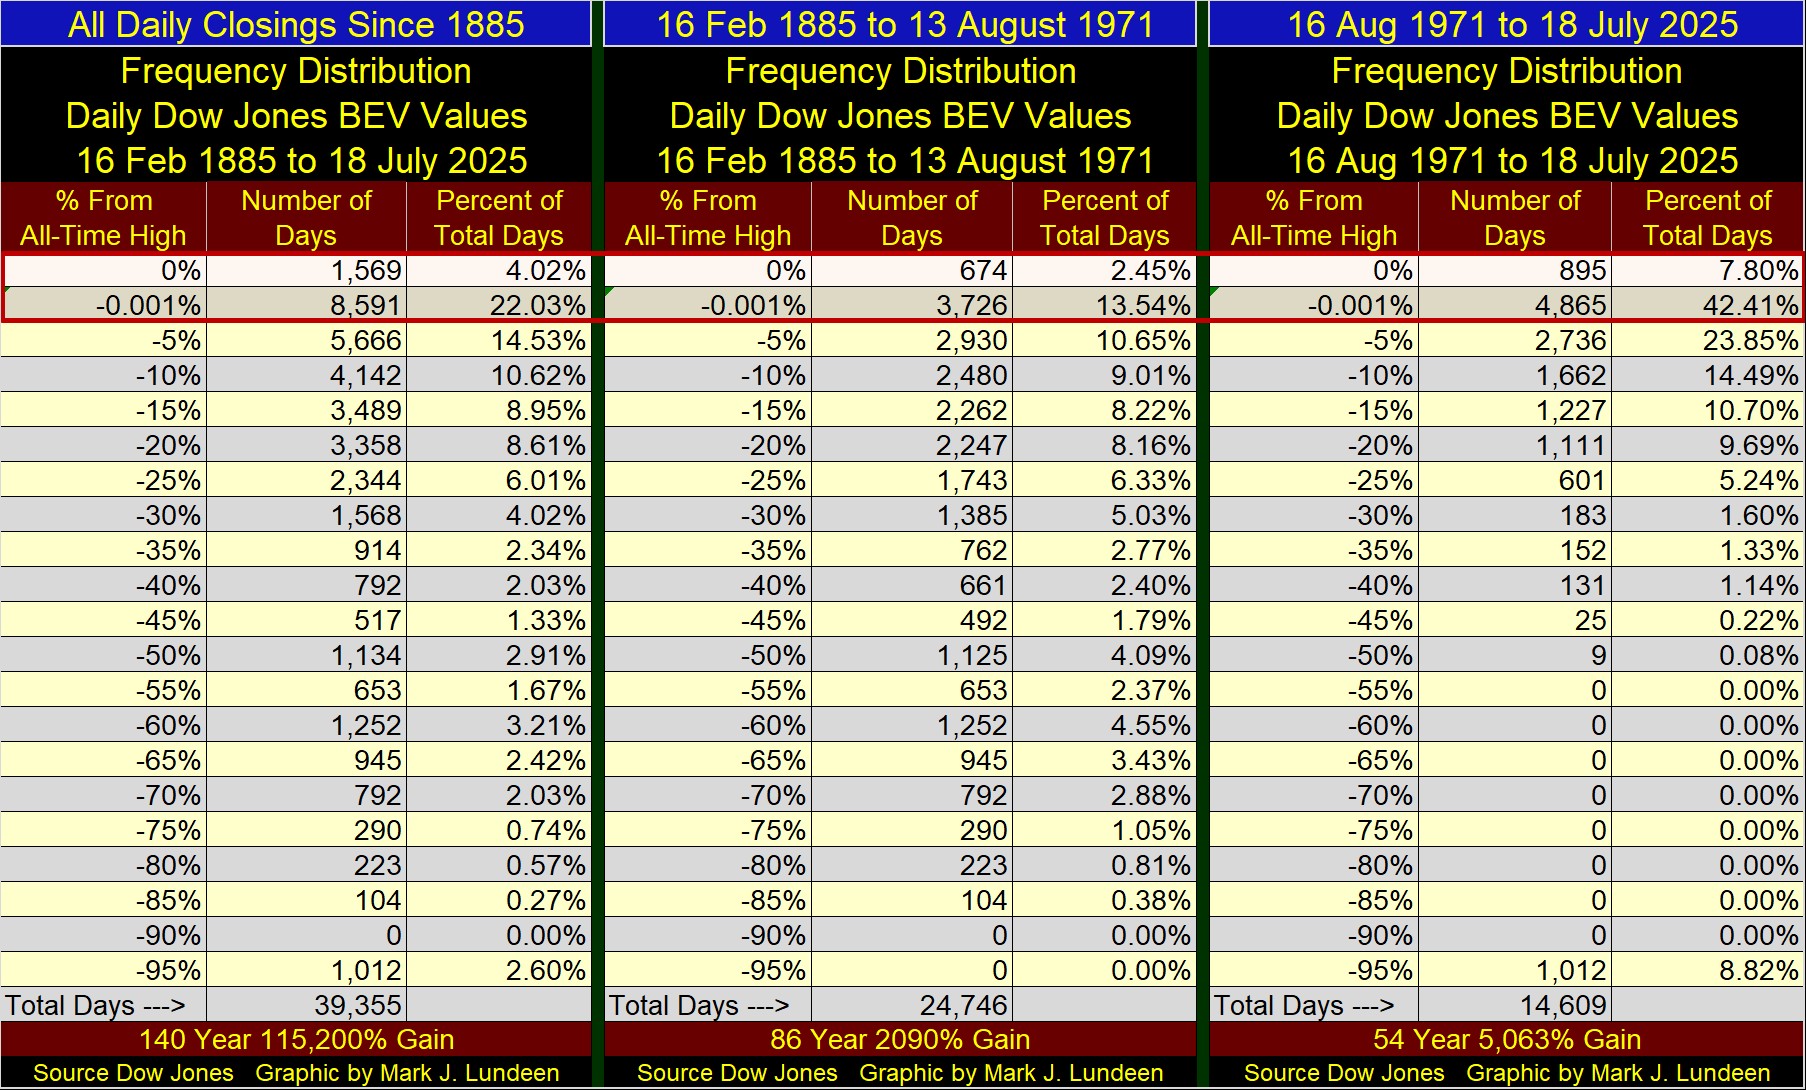
Below I have the frequency table for the Dow Jones’ BEV plot above. How many new all-time highs, from February 1885 to July 2025, can be seen in the left side freq table, in its 0% row; 1569. The Dow Jones’ 1569th BEV Zero happened just last December 4th. Should it see another new all-time high in the weeks and months to come, this number will then increase to 1570.
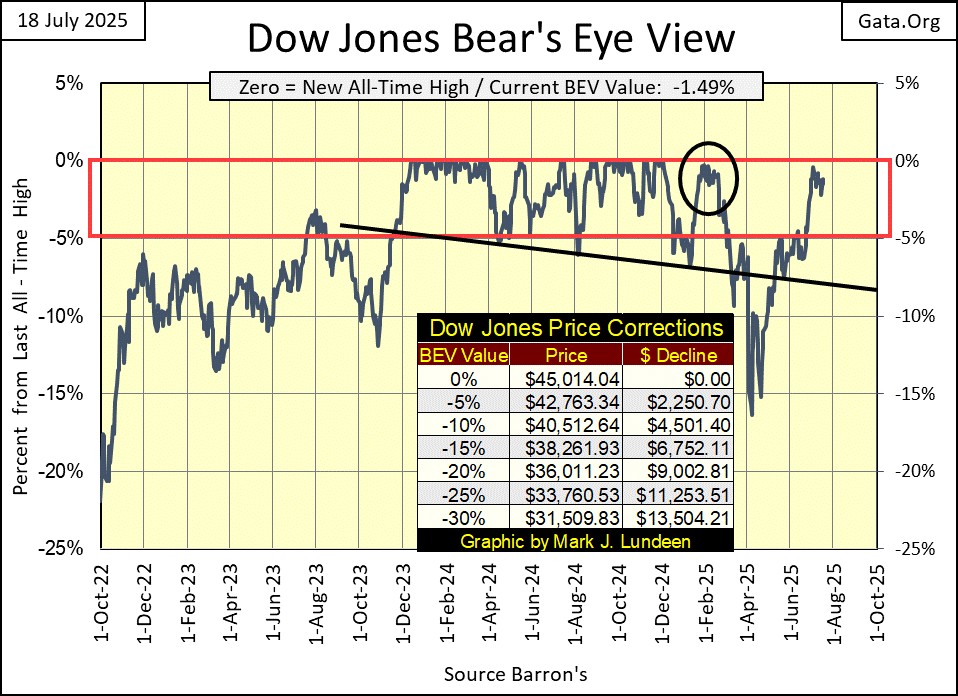
So much for that. Now we go to this week’s BEV chart for the Dow Jones below. This week the Dow Jones closed with a BEV of -1.49%, or 1.49% below its last all-time high (0%), seen on December 4th in the BEV chart below. It’s been seven months since the Dow Jones has made a new all-time high. That seems like a long time.
Can the Dow Jones advance to a new all-time high? As long as the Dow Jones remains in scoring position, maintains a BEV of something less than -5% (remains within the red box below), one must assume the Dow Jone will make additional new all-time highs. Something the Dow Jones with a BEV of -1.49% at this week’s close, suggests will happen.
This will change when the Dow Jones deflates below scoring position, as it did in March and April this year, when becoming bearish on the stock market was very justified. But since then, the Dow Jones has reinflated back into scoring position. So, once again I’m short term bullish on the stock market.
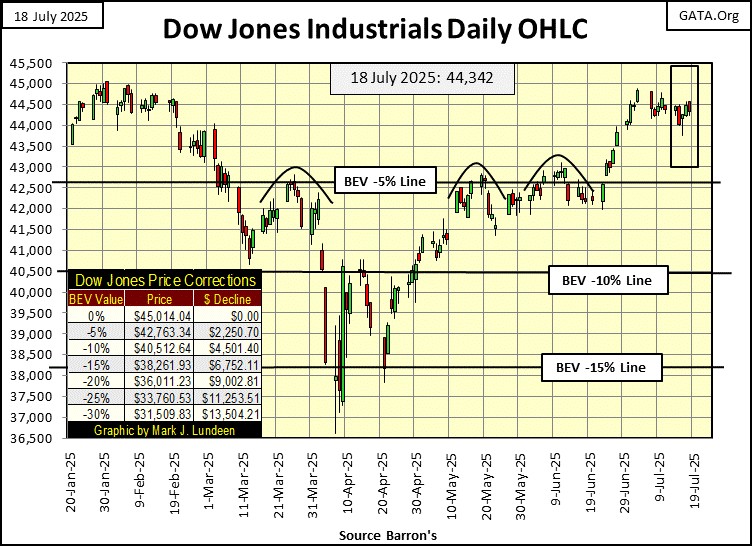
I really do like looking at the Dow Jone plotted in the dollars it is published in, as long as it’s a short-term chart, as seen below with the Dow Jones charted in its daily bars since last January.
The Dow Jones’ last all-time high of 45,014 of last December is now off this chart. But seeing the Dow close above that is the desire of every bull, now running wild and free on Wall Street. However, this week the bulls didn’t try all that hard, as the Dow Jones traded between 44,000 and 44,500. So close, but so far from making a new all-time high. Maybe the bulls will have better luck next week.
I follow twenty major market indexes, and the best way to compare them, one to another, is converting their dollar valuations into BEV values, as seen in the table below.
This week saw quite a few of these market indexes making new all-time highs, as seen below with their BEV’s of 0.00%. Friday closed with three of these indexes at a new all-time high, or BEV Zero. The next twelve of these indexes, and their average BEV, (#16), closed in scoring position, with BEV values below -5%. So, each of these indexes could be making new all-time highs in the days, weeks, and months to come.
All and all, the stock market is looking very bullish in July 2025. But should it continue to advance, it will do so without me, as I believe we are approaching a historic market top. Which isn’t a good time to be risking money in the stock market.
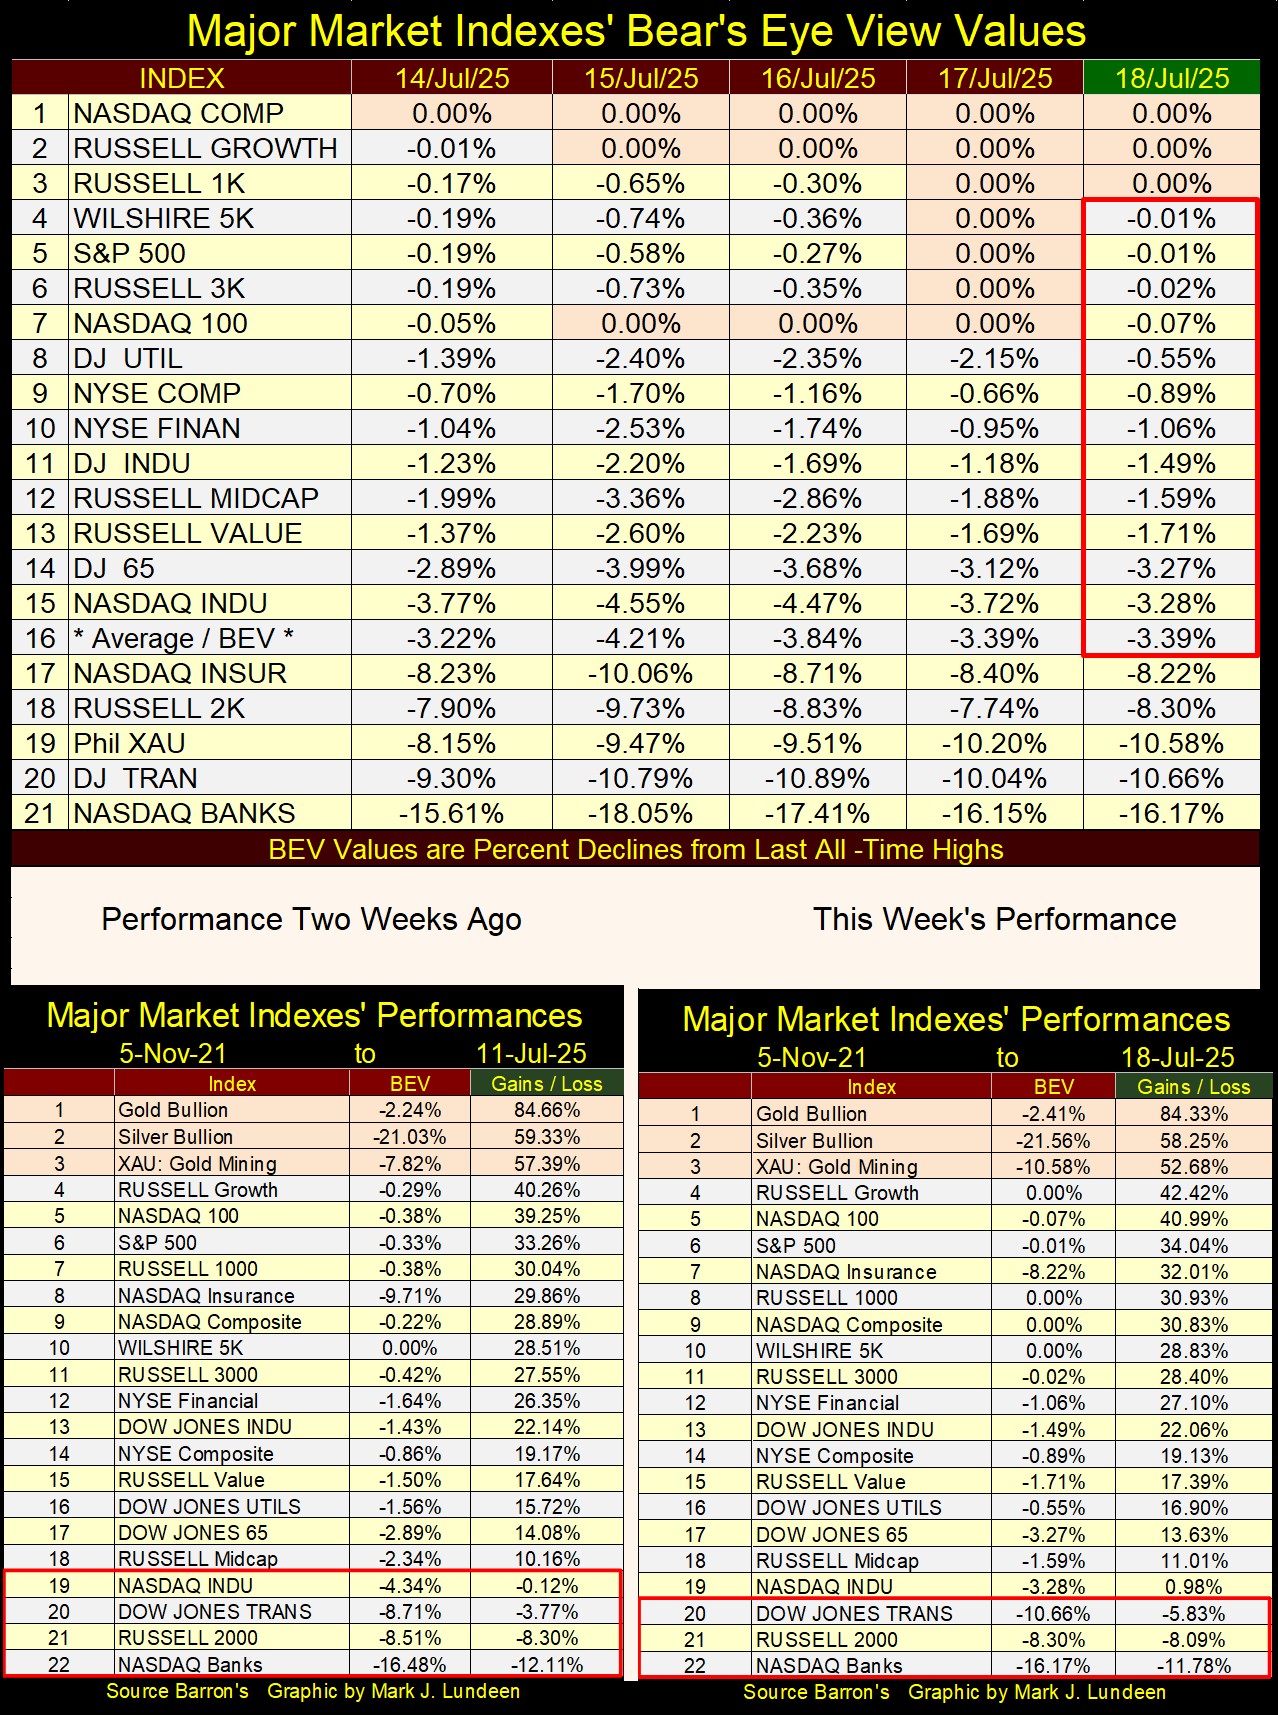
As I said before, last week was a boring market for anything I follow. For example, this week’s performance table above. Not much has changed since last week’s table. Sometimes, that is just how things go with the markets.
Real estate, once again is becoming a major problem in the financial markets, for the reasons given in the CNBC.Com article below;
- overinflated home prices,
- high mortgage rates,
- Rising supply and falling demand.
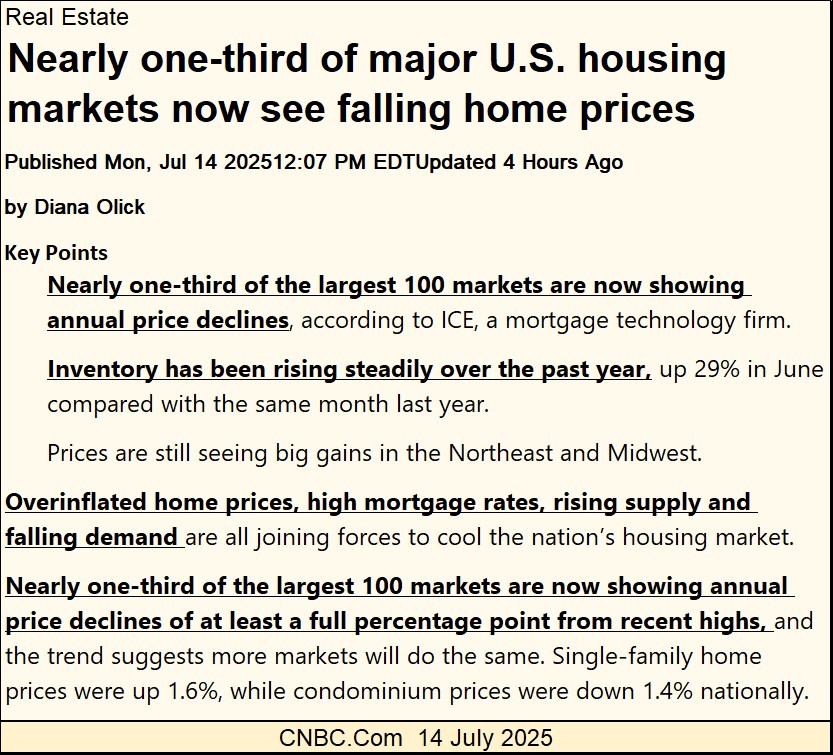
https://www.cnbc.com/2025/07/14/us-housing-markets-falling-prices.html
And the problem is not just in the residential real estate market, but in commercial real estate, and most likely farmland too.
As real estate is universally purchased via debt / mortgages, the core of this problem is one of financial leverage. Using leverage to purchase assets works like heroin in a financial market; euphoria as market valuations inflate, but becomes excruciatingly painful when credit is cutoff from its source; the Federal Reserve System, and market valuations begin deflating for lack of inflationary dollars.
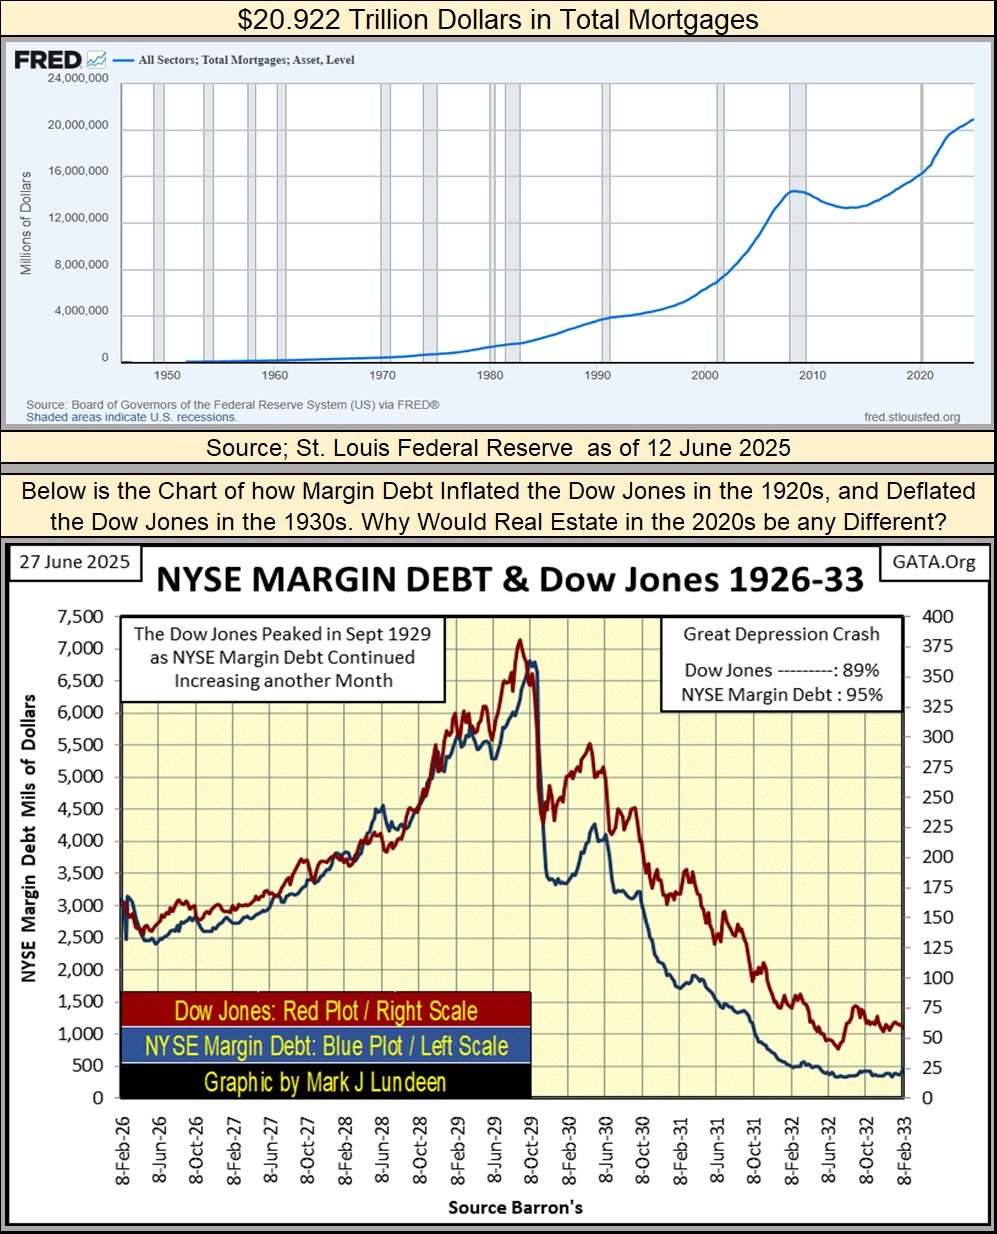
Back in the 1920s, margin debt was used in purchasing stocks at the NYSE, with 10% down by the speculator, the other 90% with credit provided from the Federal Reserve. The Roaring 1920s bull market, that inflated Dow Jones’ valuations to levels that would not have been believable in 1919, was fueled by an expansion in bank credit. In the Depressing 1930s, the Dow Jones’ valuation deflated to levels that would not have been believable in 1929, when the Federal Reserve System cut off credit to the stock market.
During the Great Depression, the financial system learned a hard lesson of not allowing speculators in the stock market to overleverage their position by using bank credit. Stock-market speculators today must put up at least 50% of their own money, when using margin debt to purchase shares in the market. So, a century ago it was discovered that for purposes of speculation, allowing speculators to purchase stocks using only 10% of their own money, the other 90% on margin, was not a good idea. That is, unless people are buying real estate, where typically a 10% downpayment is how things have been done for many decades.
In May 2025, latest data for margin debt was $920 billion. But as of June 2025, total mortgages outstanding was twenty times that, at $20.922 trillion dollars, as seen in the chart below from the St. Louis Federal Reserve Bank.
Exactly how overvalued the real estate market is in 2025, can be seen in the chart below, where the idiots at the FOMC have “injected” $20.922 trillion dollars into American real estate. This is a major reason America has a huge problem with homelessness; these idiots’ “monetary policy” have inflated shelter valuations far above the means of many people to afford housing.
When this boom in real estate finally goes bust, will 2020s’ real estate deflate by 89%, as did the Dow Jones in the 1930s, when the Federal Reserve System cut off credit from Wall Street a century ago? In time, we’ll find out. But the farther real estate prices deflate in the coming crash, the less homelessness will become a problem.
Of course, maybe the idiots at the FOMC will refuse to withdraw credit from today’s real estate market, as they did to Wall Street in the 1930s, as seen above. That is something to consider.
But US demographics are such that, after the Baby-Boomers go on to meet their maker, the following generations are not going to provide the demand required to maintain current inflated real-estate valuations. Also, and this is a huge factor; most “consumers” aka “homeowners” are maxed out when it comes to debt. All too many of them are only a paycheck away from financial disaster. Come a recession, or worse in the economy, defaults in all classes of debt, including mortgages are going to rise. It will be a replay of the 2007-09 mortgage crisis.
The problem in our world is; there are just too many multi-trillion dollars debt markets out there, for the real economy of tax payers and consumers’ wages and income to service.
In 2025, the US national debt (Treasury market) is $36 trillion, more debt than the $20.9 trillion mortgage market. The corporate bond market is huge, so it must also be multi-trillion dollars, as are school loans and credit card debt. Today, we also have multi-trillion-dollar market cap companies trading in the stock market, because of the “liquidity injected” into the financial system by the idiots at the FOMC.
A trillion of anything is best left to astronomy. A trillion stars, or a trillion galaxies are all good and fine in the vastness of space. But here on Earth, a trillion dollars of anything, especially for debt, is something that makes my head spin!
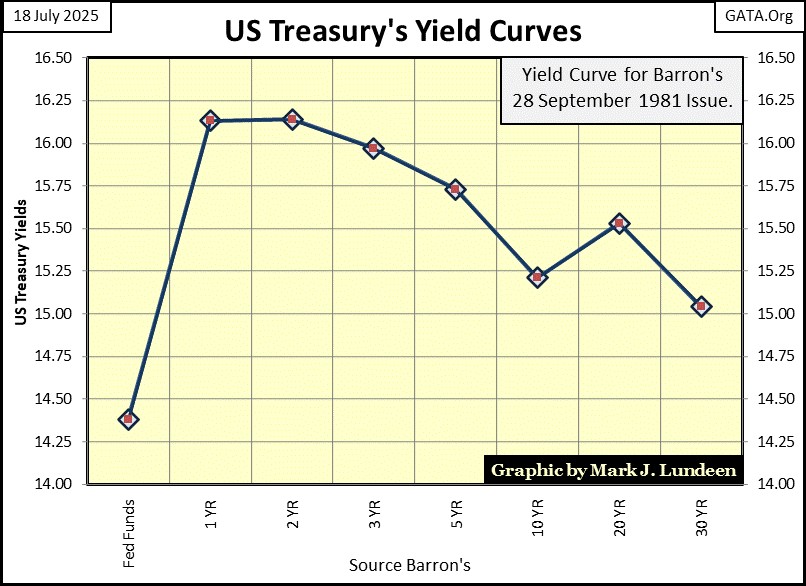
In the autumn of 1981, the US national debt broke above $1 trillion dollars for the first time in history, and the Treasury bond market freaked out. The T-bond market’s reaction to this, then staggering development, was to send the yields on all Treasury instruments to over 15%. (see yield curve chart below)
In October 1981, the size of the mortgage market in the chart above was $1.35 trillion dollars, as mortgage rates soared to 18.53%, as seen in the mortgage rate chart below.
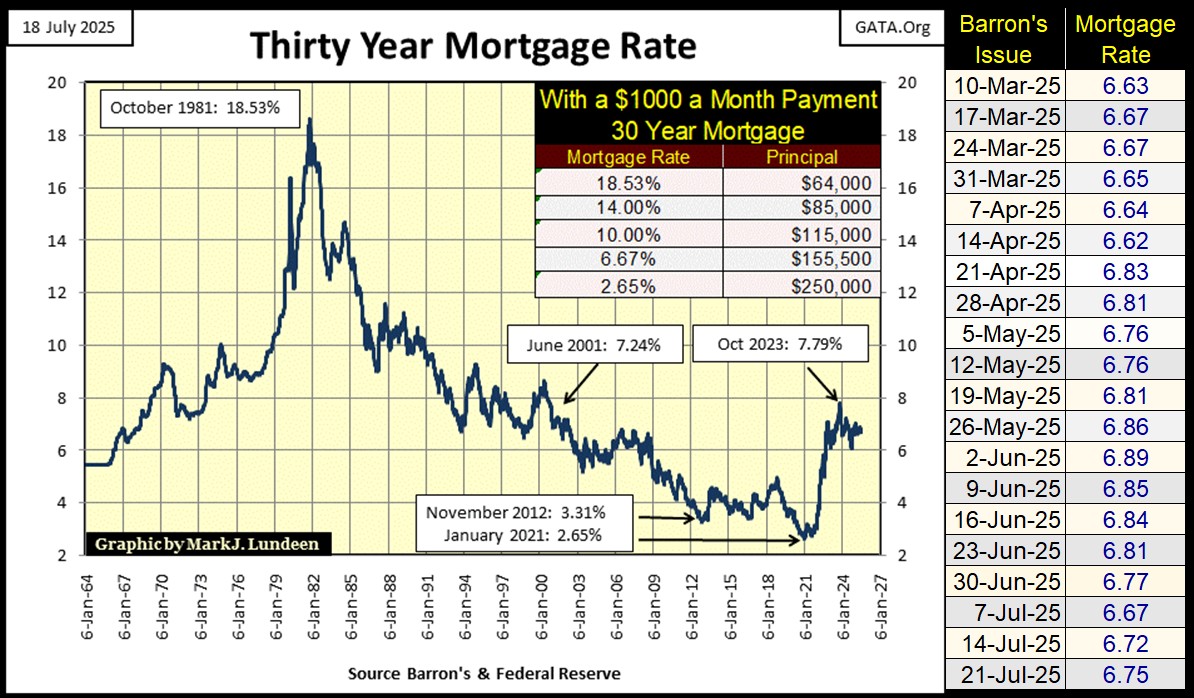
Then in 1981, FOMC Idiot Primate; Paul Volcker, was successful in diverting monetary inflation then flowing into consumer prices, into asset valuations, and an epoch of bull markets began, as interest rates and yield declined for the next four decades.
In the chart of mortgage rates seen above, as rates declined from 18.53% in October 1981, to 2.65% in January 2021, a gigantic bull market in real estate occurred. But seeing mortgage rates once again begin to rise since January 2021, strongly suggests real estate valuations have peaked, and have nowhere else to go but down, if mortgage rates continue to rise. Which I believe they will.
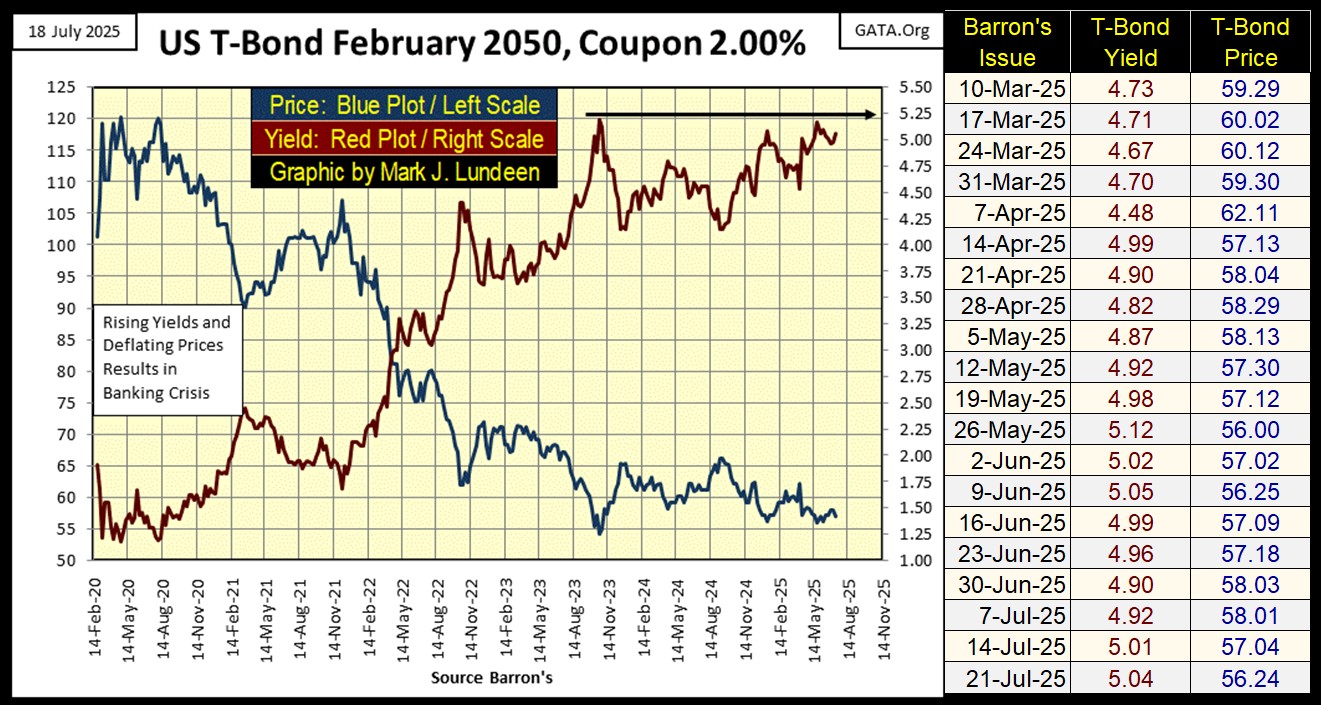
Below is a 30Yr T-bond I’ve followed (weekly closing data) since it was issued in February 2020. Since this T-bond saw its peak valuation (Blue Plot) in August 2020 of 120. Its valuation has only deflated, as bond yields (Red Plot) have risen these past five years. This week it closed with a valuation of 56.24, a decline of 53% since August 2020.
Losing over half of its valuation in five years, is something that is not supposed to happen with Treasury debt. But, * THIS IS * what did happen with this, and other long-term bonds in the past five years, as their yields have increased. Here is something to consider; since gold’s highs of August 2020, it is up 67%, from $2061 to $3433. Obviously, these past five years gold has benefited from rising bond yields, as bond valuations were deflated by them.
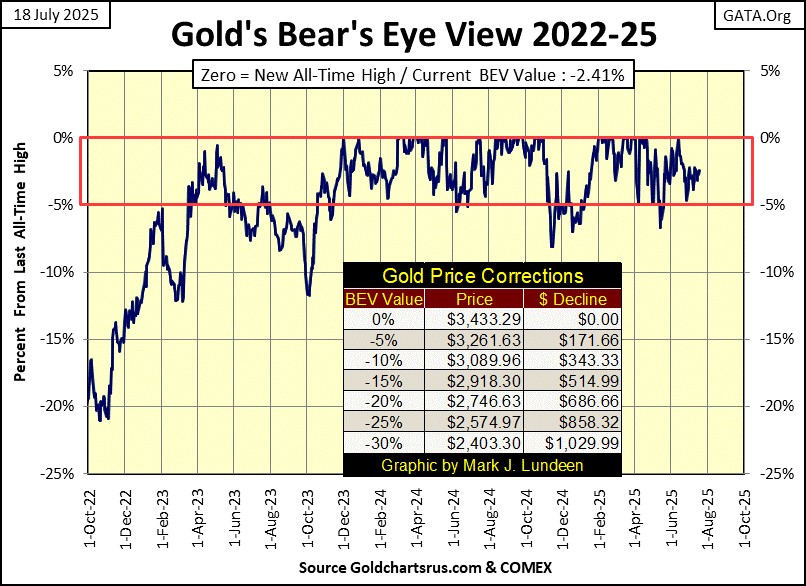
As with the Dow Jones and the stock market, last week’s market action for gold was one of tedium, as seen in gold’s BEV chart below. Like the Dow Jones, gold too closed in scoring position. So, we should be anticipating additional new all-time highs for gold in the weeks and months to come.
Since November 2023, when gold entered scoring position in the BEV chart below (red rectangle), gold has so far seen sixty-six new all-time highs, BEV Zeros in the chart below. Fingers crossed, I’m expecting to see that number exceed seventy new all-time highs before 2025 flows into 2026.
Taking a quick look at gold’s step sum table below, its 15-count has turned positive, as gold is beginning to see more daily advances than declines. If this continues, hopefully these net advancing days will soon push the price of gold up into new all-time highs.
With this week’s close of a BEV of -2.41%, gold would have to advance by only 2.42% to make a new all-time high in the days to come. That’s nothing, but will it? I’ll tell you all about that next week.
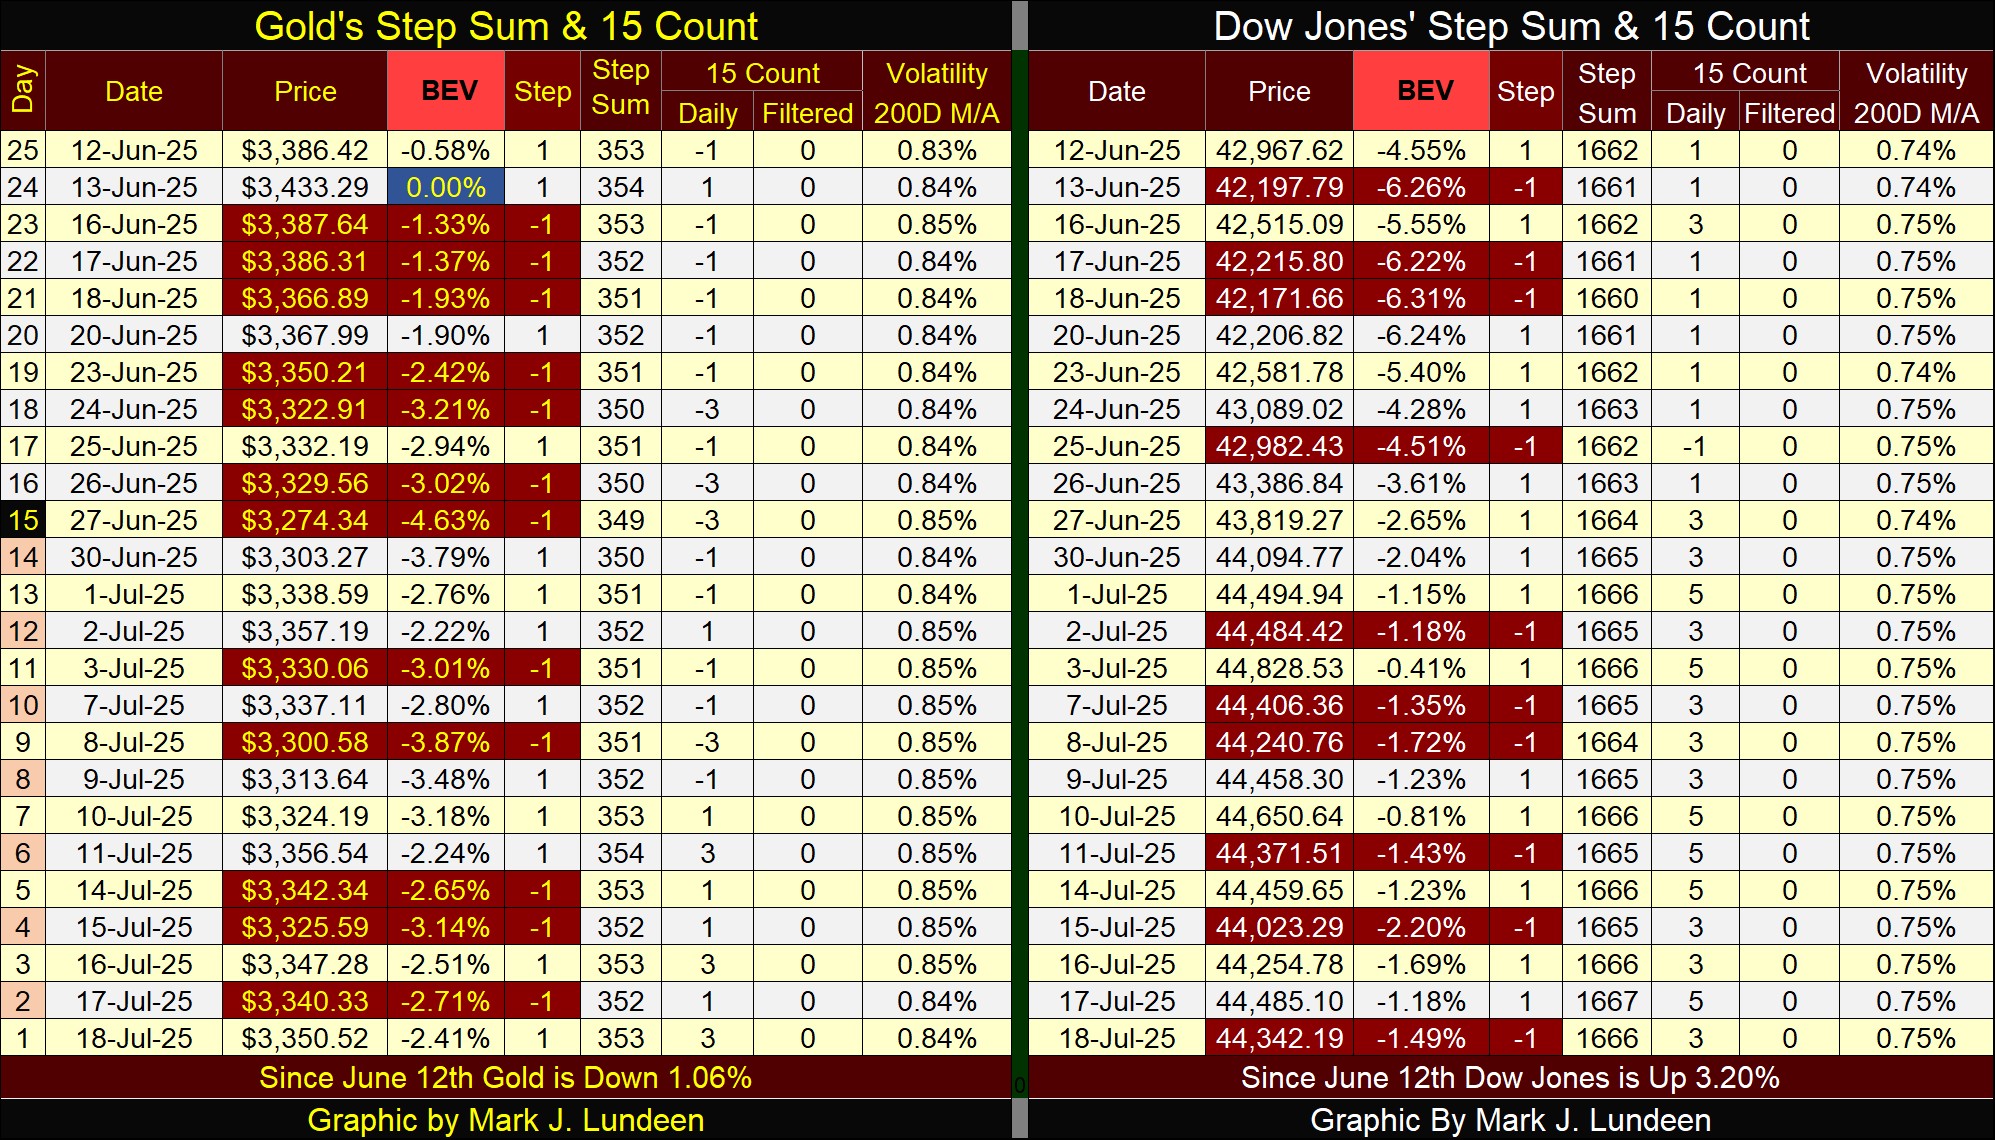
For the Dow Jones step sum table, its 15-count has been positive for many weeks now, as the Dow Jones has for the most part, remained in scoring position. However, with all these net-daily advances (positive 15-counts), it still hasn’t managed to generate a new all-time high for the Dow Jones since last December. What is with that?
With the Dow Jones closing this week with a BEV of -1.49%, it had better make a new all-time high (0.0%) in the next few weeks, or something is definitely wrong with this market.
That’s it for this week. Hopefully, next week will provide a little more excitement than this week did.
Mark J. Lundeen
*******


