Recalling 2010


On several occasions since late 2018, we've written about the current similarities to 2010. This "2010 9" theory became our theme for 2019, and we wrote about it here:
• https://www.sprottmoney.com/Blog/gold-and-silver-2...
Well, here we are in May and it's time to check in on the status of this forecast. The parallels to 2010 are becoming clearer. Plus, there are additional risks that are coming to the forefront.
COMPARISONS OF 2010 vs 2019
- Slowing U.S. economy … "Green shoots" fade, GDP slows
- Federal Reserve appearing to be “in control” … QE1 vs QT
- Pending reversal of Federal Reserve policy
- Political discord … budget blowout, debt ceiling, ratings downgrade
To that list, we must also add these 2019-specific events:
- Nearly $22T in total U.S. debt with annual $1T deficits
- Over $10T in global negative-yielding debt
- Unlimited currency creation leading to Modern Monetary Theory
- Global central banks hoarding physical gold (651 mt in 2018)
- Deepening global trade wars and tariffs
So let's take an in-depth look at what transpired during the first half of 2010 for the Dollar Index, COMEX gold, and COMEX silver.
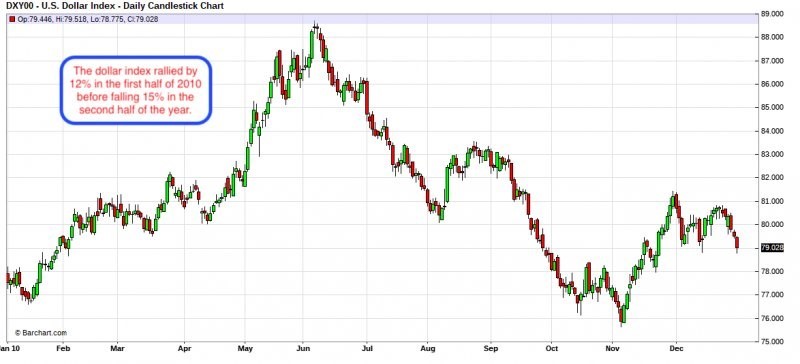
The first half of 2010 saw a huge gain in the U.S. dollar. The Dollar Index rose from 78 to 88 for nearly a 13% gain. Why? This was primarily due to a strong U.S. economy. Those "green shoots" were everywhere, and 2010 Q2 GDP came in at 3.7%. Chairman Bernanke and The Fed were hailed as geniuses and heroes.
But then something unexpected happened. The U.S. economy rolled over, those green shoots withered, and the dollar began to fall. U.S. GDP fell to just 1.0% by Q4 and then contracted by 1.0% in Q1 of 2011. As economic growth ground to a halt, the dollar index reversed and suddenly went into a 15% free fall. See below:
Given the worsening trade wars, the inverted yield curve, and the slowing economy, is it reasonable to assume that the second half of 2019 could resemble the second half of 2010 for the U.S. dollar?
So now let's look at COMEX gold and silver.
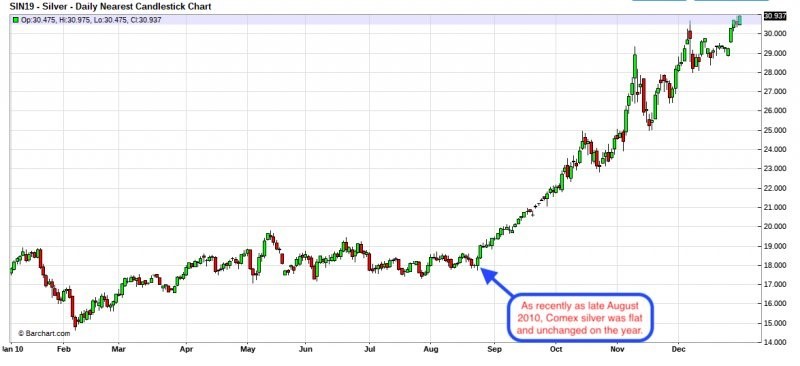
The strong U.S. economy, the soaring dollar, and confidence in the central bankers all combined to stifle both gold and silver through the first half of 2010. Through July, COMEX gold was only up $40, or about 3%, on the year and COMEX silver was flat to unchanged. But then what happened? See below:
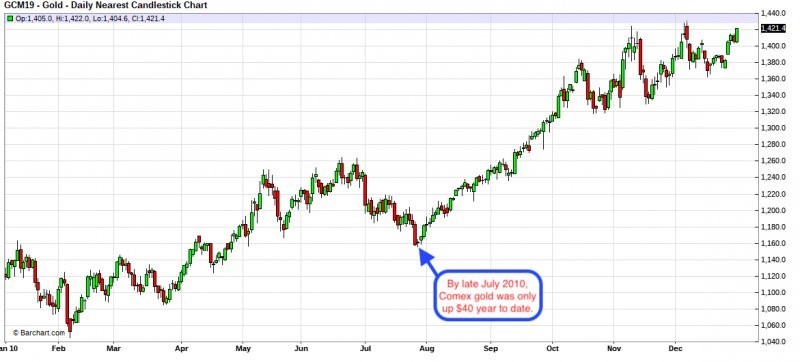
And be sure to take a really close look at the 2010 COMEX gold chart and note the $100 price decline from late June 2010 through late July 2010. Beginning in early 2010, you might have correctly forecasted all that was to come in the economy and Fed policy. However, if you allowed that $100 decline to shake you out in mid-summer, you'd have ended up chasing price all through the second half of the year and into 2011.
The point is this: The year 2010 was terrific for both COMEX gold and silver, but if you got impatient or allowed yourself to be filled with self-doubt, you may have missed the move. And how large were the gains? Through calendar year 2010 alone, COMEX gold ultimately gained 27% while COMEX silver gained nearly 70%.
Thus, now is the time to get positioned ahead of the coming rally. Similar to 2010, COMEX gold just fell nearly $80 from late February to late April and COMEX silver is actually down year-to-date. If 2019 is indeed shaping up to be 2010 on steroids, are you positioned for the gains to come or have you allowed yourself to be shaken out due to fear or, worse, ambivalence?
Our Ask The Expert interviewer Craig Hemke began his career in financial services in 1990 but retired in 2008 to focus on family and entrepreneurial opportunities. Since 2010, he has been the editor and publisher of the TF Metals Report found at TFMetalsReport.com, an online community for precious metal investors.
********
 Craig Hemke began his career in financial services in 1990 but retired in 2008 to focus on family and entrepreneurial opportunities. Since 2010, he has been the editor and publisher of the TF Metals Report found at TFMetalsReport.com, an online community for precious metal investors.
More from Gold-Eagle


