Revitalised Markets After The ‘Time Out’


A week ago, the “Time Out” heading to the US Markets report wrote about the quiet week that was; it now seems that most markets took the breather to store up fresh reserves which they unleashed last week. Gold, silver, the DJIA and crude all came forth with significant rallies. It was only the dollar index that turned weaker – thus to assist the euro to reverse off support – and the yield on the US 10-year Treasury note that had a bad week. Gold and Wall Street, surprisingly both holding the same trend, surprised with the exuberance of their rallies. How long can this strange pair continue in step like this? They represent complete opposites in market sentiment.
There was a time when the now so fashionable bear raids in the form of a waterfall attack kicked off out of the blue with a smashing through enough of the bid stack to wipe $20 and more from the price of gold, timed with a similar attack on the silver price. This seemed to have changed. Earlier, the short sellers apparently had little or no concern for the amount of new short positions this tactic generated. Now this has changed; instead of a major attack out off the new high, the rally in gold meets with gradual resistance – just enough selling pressure over some period of time for the gold bulls to sit back, cancel their higher bids and wait to see what happens.
This reduces the volume in the bid stack, at least for those bids sitting close to the ruling price. Only the laggards with bids way down in the stack, sitting there while they have a sandwich or sit through a meeting then get hit when the waterfall hits the bid stack – generating many fewer new short positions for the sellers than this tactic used to do. To me that is the only explanation for the change in the way the waterfalls are conducted – and if correct, this means that the situation has become a lot more delicate for the short sellers. These charts from Kitco are illuminating.
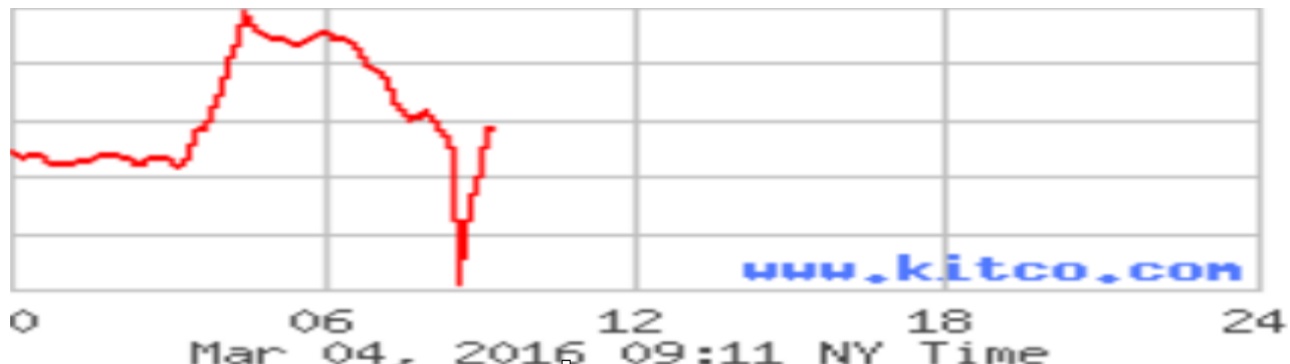
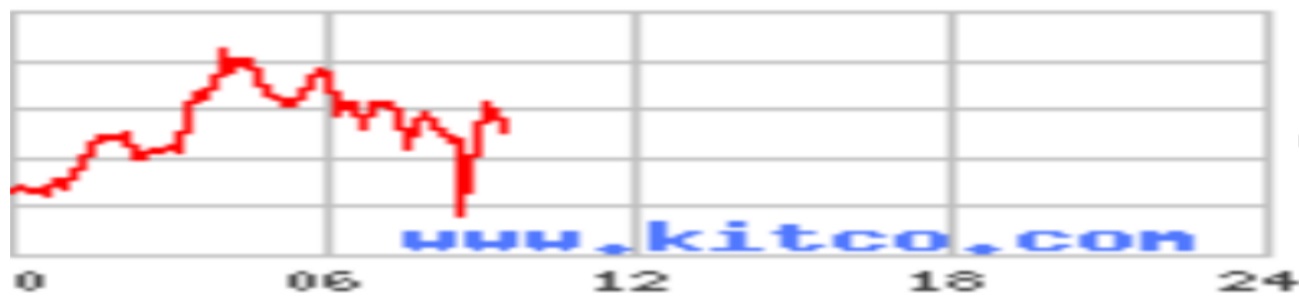
If one assumes the same strategy is used on silver, comparison of the two charts above shows that the nibbling at the silver contracts begin a short while before the gold contracts experience selling. Perhaps this is so that the bidders on silver get advance warning of what is to come so tat they have more time to cancel their bids – and thereby leave a thinner and less populated bid stack when it comes time for the waterfall. As if the short sellers are even more scared of adding to many new short positions to their silver shorts.
The apparent inconsequential fiddling with details of the rear guard tactics implies that the situation the short sellers are facing must have reached a state of near desperation. The apparent shallowness of the waterfall for silver compared to gold is further evidence of apprehension about opening too many new short positions for silver. It could be that March will become an interesting month!
Strange also that with US oil production reaching a record surplus over demand, the price of crude set a new intermediate high on Friday. Is the crude price really acting as the lever used to levitate Wall Street now that indirect direct intervention by the authorities via the Big Banks seemingly has lost its effect? It is quite visible during the trading day – and in the run up to the open – how the stock market is primed for a strong open and then supported out of the blue whenever the Bear takes over.
However, now in 2016 this tactic appears to have lost effectiveness. But Wall Street – and the Big Banks – have become almost petrified by fear that all shale producers will go belly up and let the banks sit with their debt. The stock market therefore has reacted with much hope and buying when the price of crude improves – despite all the over-supply and Iran still gearing up. It seems that crude is used as a lever that works directly on Wall Street.
Strange indeed, but it fits well in with all the other strangeness in the markets. Such as a net 129,000 new jobs created by new businesses over jobs lost by those that close their doors; this despite the real economy being in decline.
2016 is becoming ever more fascinating, even for an election year
Euro-Dollar Chart
After the weeks in a narrow if volatile sideways trend, followed by the euro rally to close in on the top of the current bull channel, the dollar two weeks ago joined Wall Street in a rush higher and the euro gave way to end that week on a low note.
The euro broke cleanly below support at line Q ($1.1101) and extended to close the gap to the key support at the bottom of channel KL now at $1.0882. This support has held and the euro improved slightly towards the end of last week to present a slightly positive picture. But if the recent wildness in the markets continues into this month, anything can happen. Europe is still facing a major crisis with the inflow of migrants and could be facing a political turnover like Greece had experienced when their population revolted against austerity, with much effect on the euro.
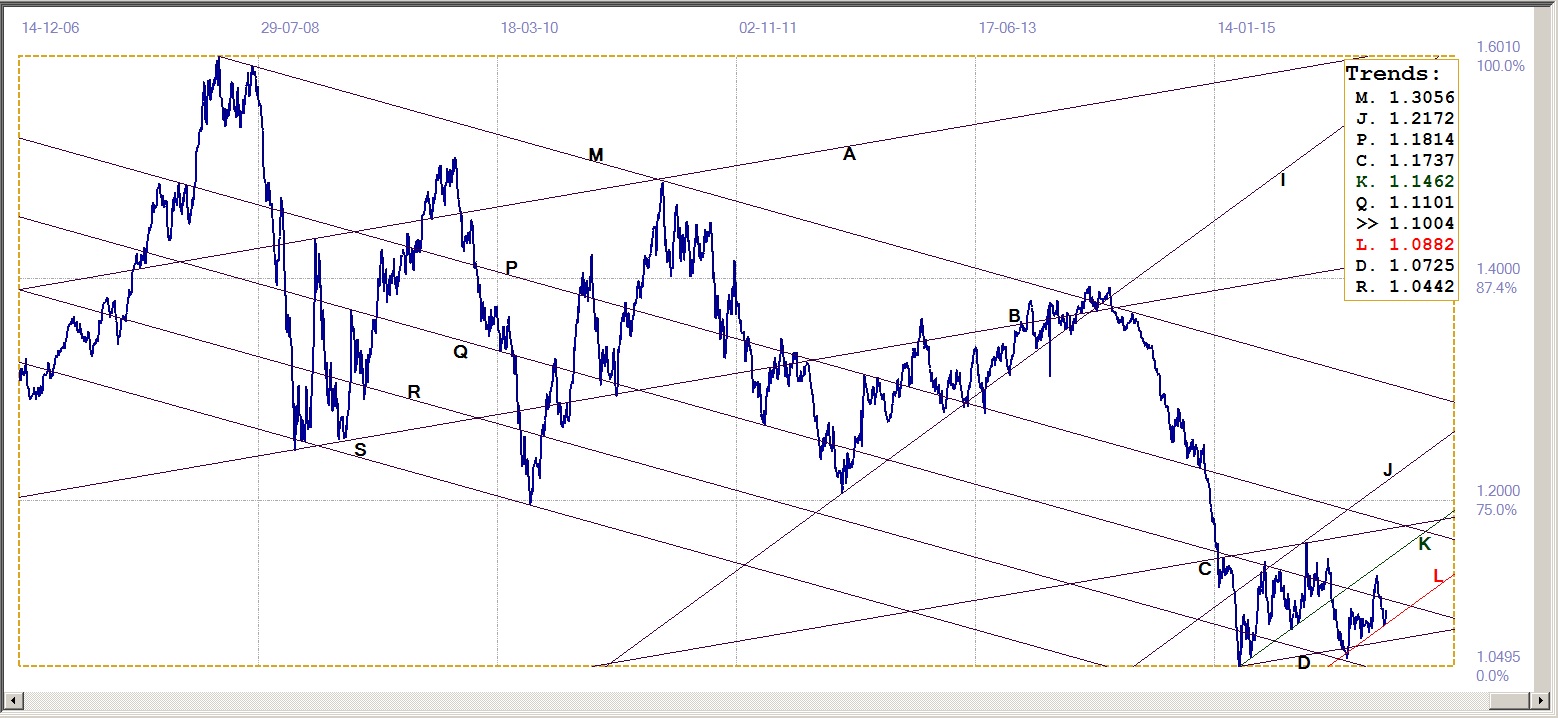
Euro-dollar, last = $1.1004 (www.investing.com)
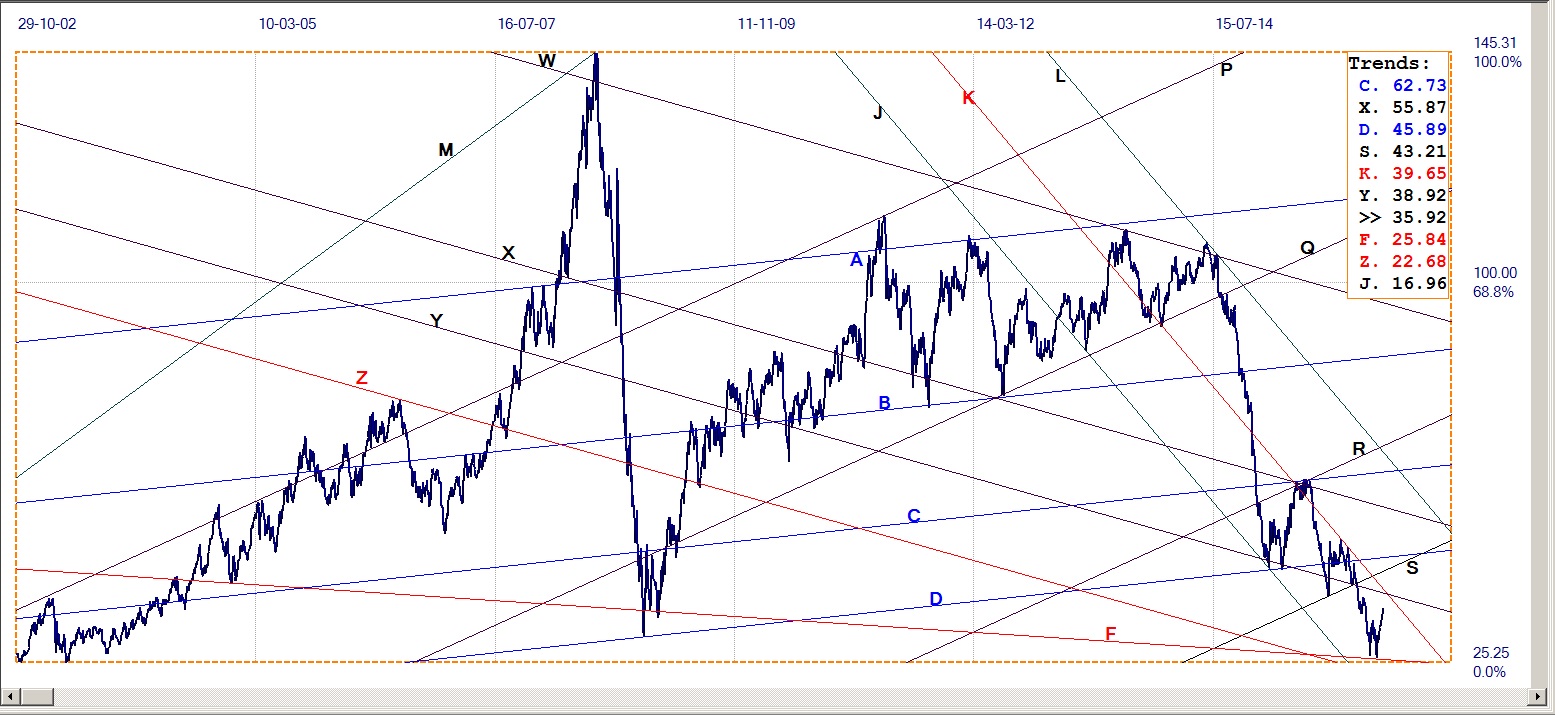
Dow Jones Industrial Average (DJIA)
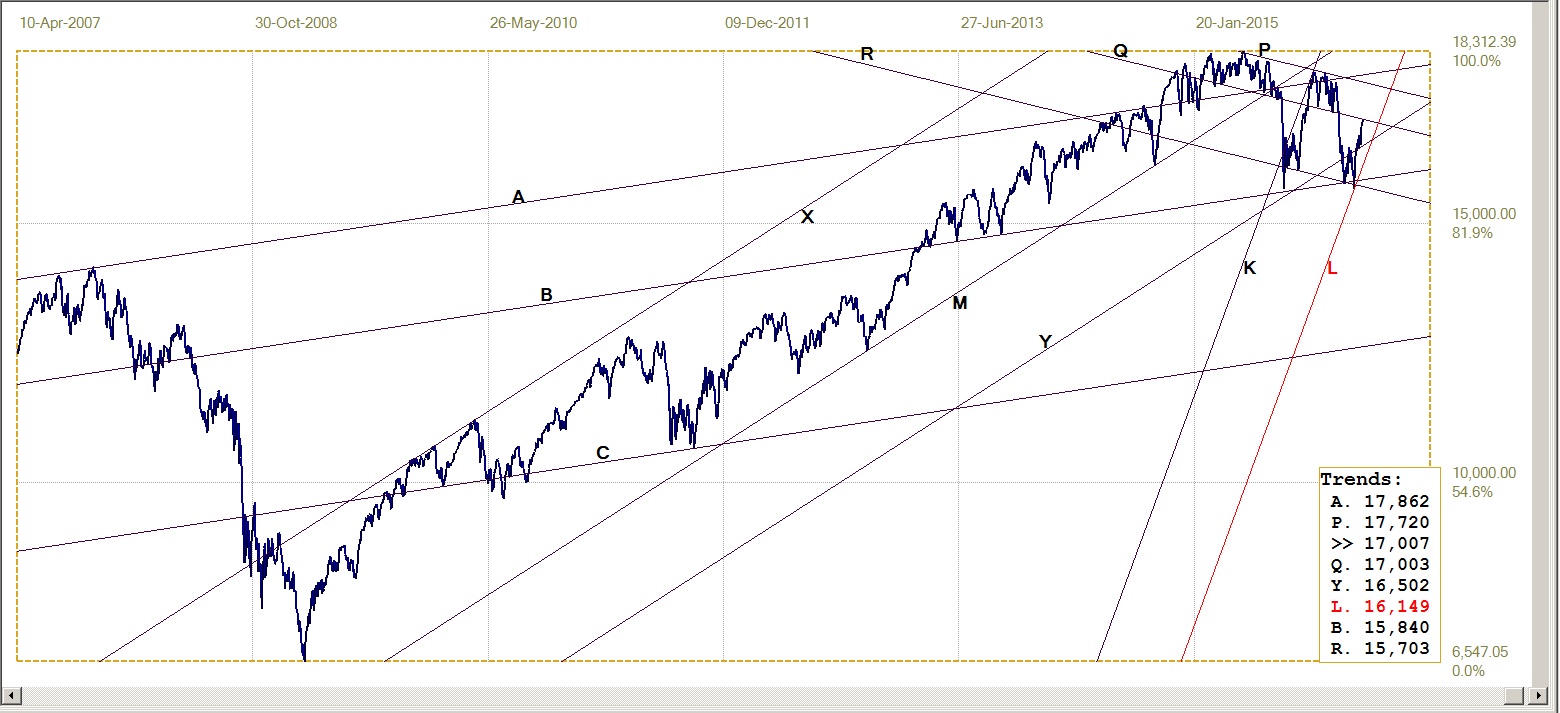
Dow Jones Industrial Index, last = 17007 (money.cnn.com)
Gold PM Fix - Dollars
The persistent waterfall attacks still continue with two such attacks in sequence or 4-5 attacks on the same day the rule rather than an exception. Attacks in sequence are designed to catch traders going for the early worm when they sense a waterfall has ended – thus allowing the waiting sellers like early birds to pounce on the early buyers to close more of their shorts on the hop.
However, despite the frequency and intensity of these attacks, the gold price has not (yet?) broken down permanently or even for an extended period, as was often the result in years prior to late 2015 or 2016. Gold’s rising trend on occasion has stalled to remain sideways for some time, but essentially it has been a case of three steps forward and one or two back, which that two weeks ago has taken the price of gold clear of the $1200 level.
The trend continued higher last week, moving into the higher ranges above $1200 and accelerated only to run into many waterfalls that halted the rally. Yet, on the chart below, Friday’s PM fix managed to close the week $6 clear of the long time resistance at line C (1271) to set a good start to the new week.
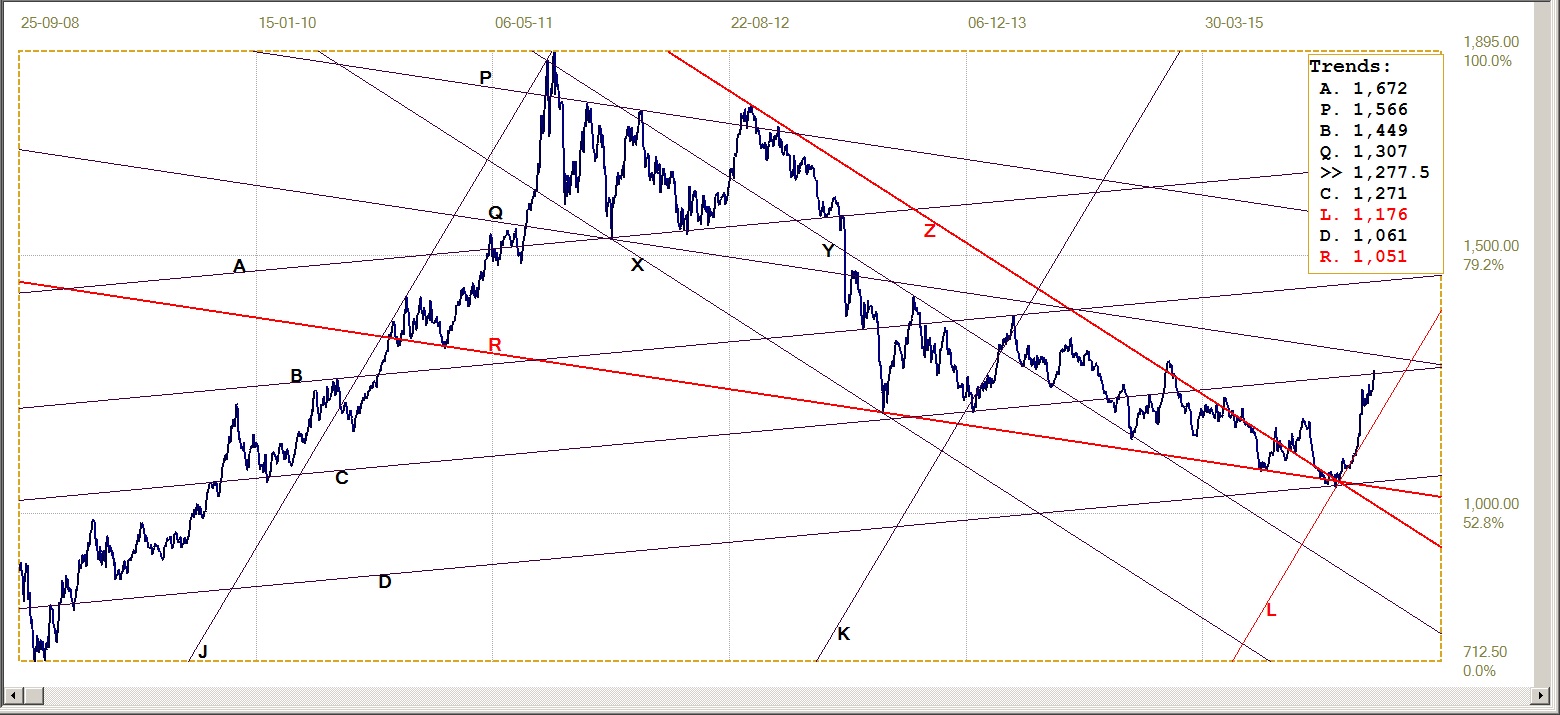
Gold price – London PM fix, last = $1277.50 (www.kitco.com)
Gold PM Fix - Euro
The knock the euro took recently when the US dollar set off in pursuit of Wall Street and the price of crude – a stronger dollar apparently having a positive effect on the former and no negative effect on the latter! – which decline of course boosted the euro price of gold, enabling it to sustain its rising trend. It is still creeping higher towards resistance at lines R (€1179) and W (€1182).
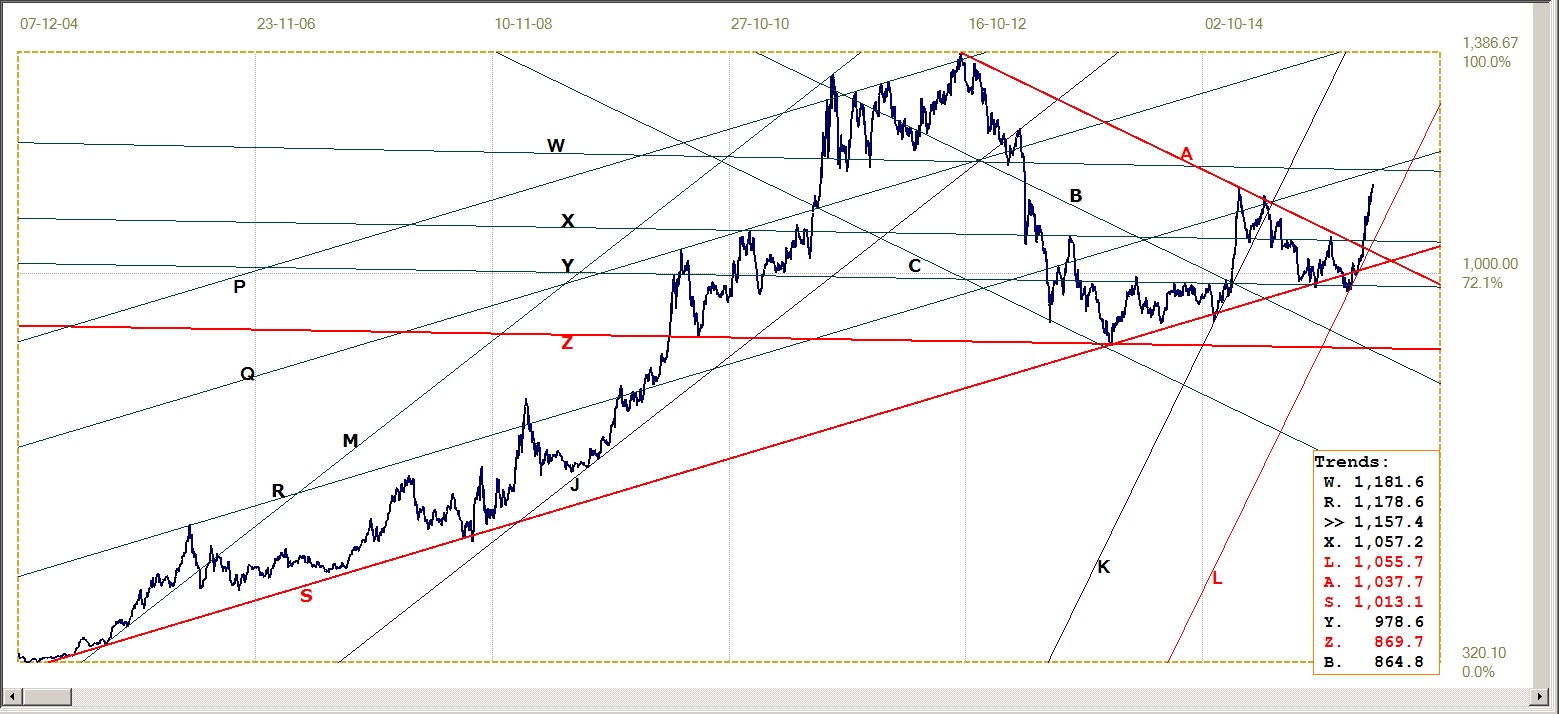
Euro gold price – PM fix in Euro, last = €1157.4. (www.kitco.com)
Silver Daily Fix Chart
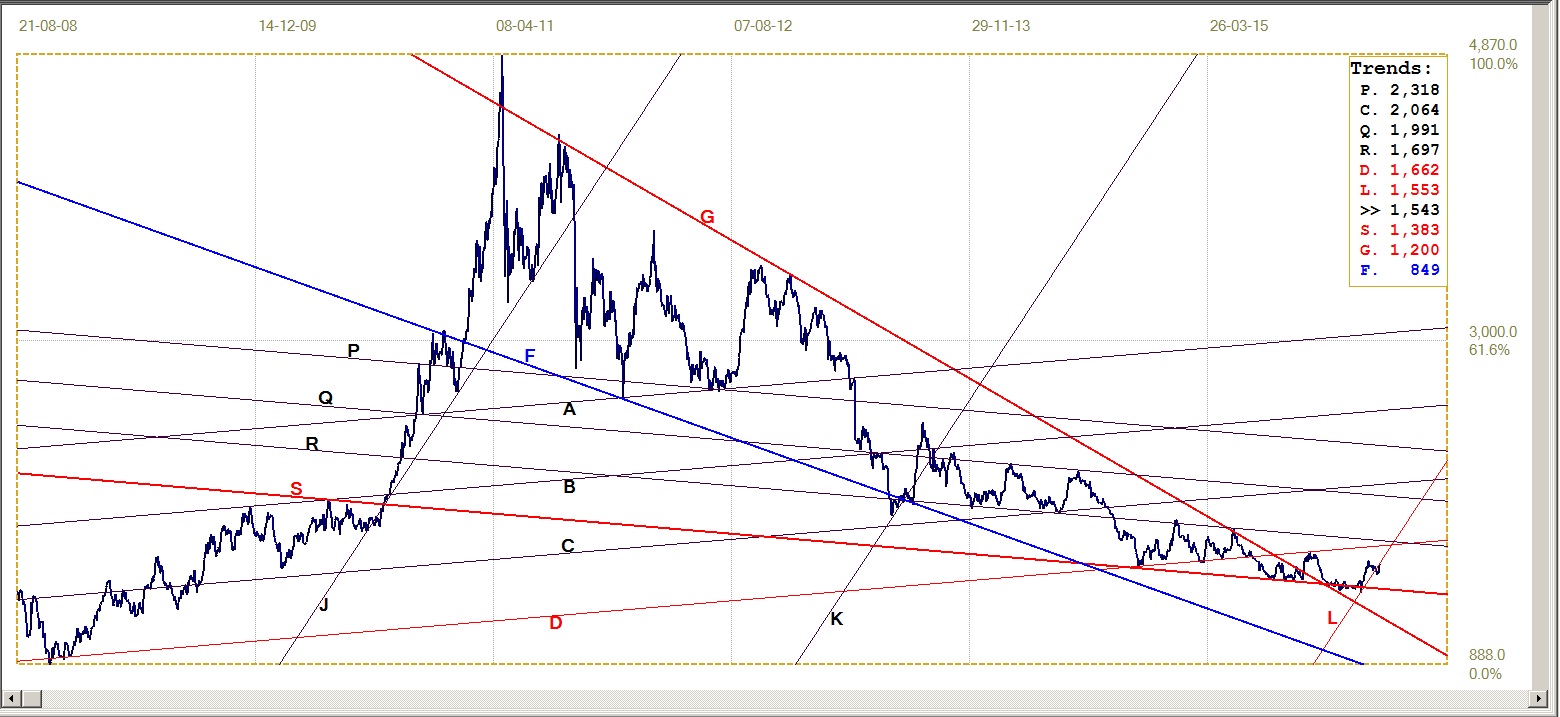
Silver daily fix, last = $15.43 (www.kitco.com)
The early 2016 silver rally has petered out and two weeks ago the price dipped to below rising support at the bottom of bull channel KL ($15.53). Last week, silver again suffered very specific attention from the short sellers and managed to make only a little headway against the headwinds. The gain brought it closer to the trend line, but it still closed the week on the bearish side of the bull channel.
Silver used to be very volatile during the trading day – more so than gold – but it has really gone to sleep the past few weeks; that is, except when there is a strong waterfall that pushes the bid stack – which with little positive action probably is on the thin side – substantially lower. The silver chart in the introduction might confirm the care taken with silver – the waterfall picture there was not one might swoop to clear the bid stack - but started with a series of much smaller ‘water features’ as if these were intended to warn buyers they are going to get hit soon.
This too supports the suspicion that the effort to control the price of silver is still on, but that the way it is now being managed is intended to reduce the number of new shorts to as low as possible and perhaps also to keep deliveries at a minimum.
U.S. 10-Year Treasury Note
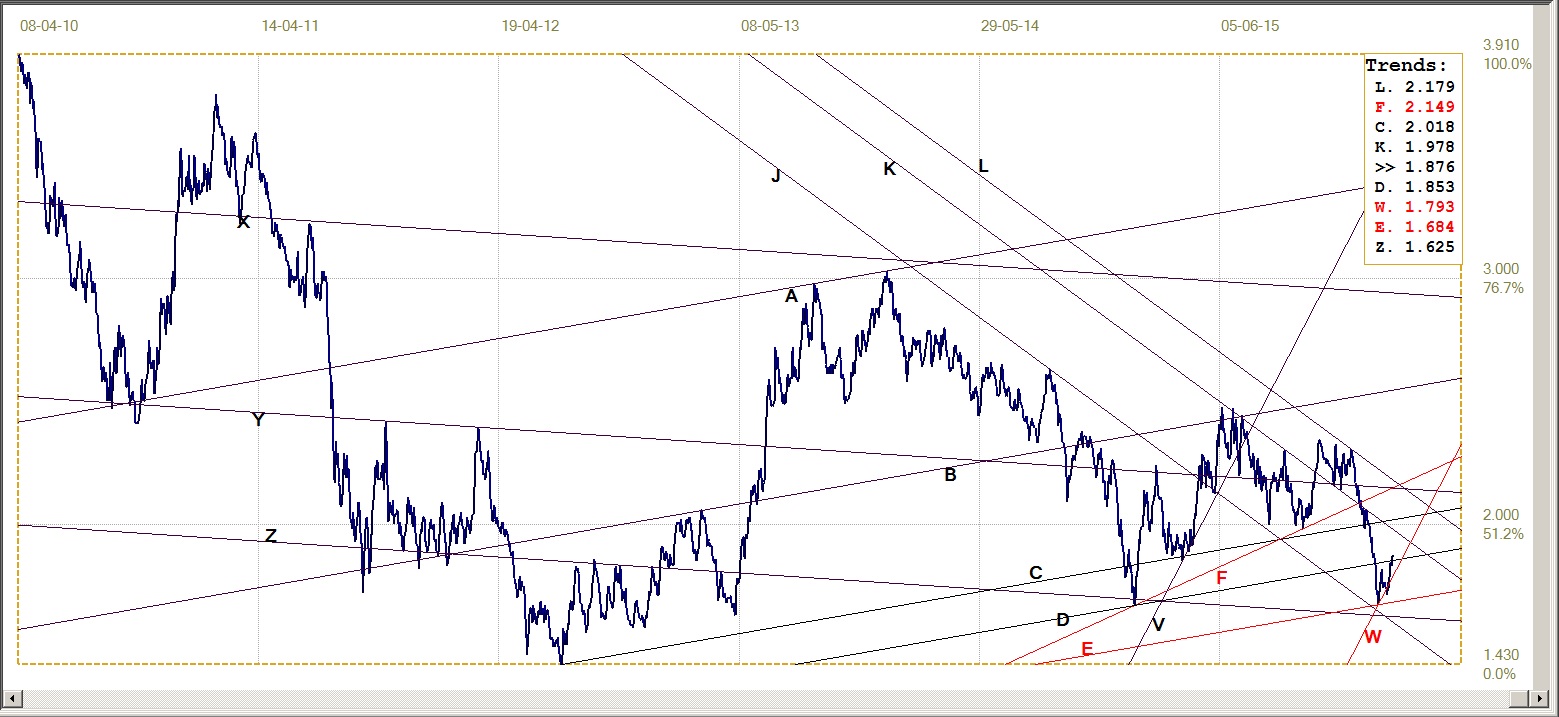
U.S. 10-year Treasury note, last = 1.876% (www.investing.com)
The US dollar index turned weaker last week and finally also against the euro. For some time, when the dollar was struggling, the yield on the us 10-Year T.note fell, so that foreign holders of the Treasuries would not perceive weakness from their perspective. Last week the dollar slipped lower, yet the yield on the 10-year broke above its market support at line D (1.853%) to extend the bear trend in channel VW (1.793%).
This is new, or at least quite a rare situation, where the foreign view of the us 10-year has turned bearish. It is not known whether this is weakness is the result of increased selling by foreign holders or whether there is domestic selling of longer term Treasuries now that they are no longer needed as a safe haven to cover for exposure to equities and other markets.
If the yield cannot reverse trend to break back below the support at line D, perhaps also channel KL, this could be the start of the long awaited bear trend in bonds. It would surprise if that does not trigger more foreign selling and then probably spill over into the equities market as well.
West Texas Intermediate Crude. Daily close
WTI crude – Daily close, last = $35.92 (Investing.com)
For a long time – many years – we had to watch Wall Street in a bull trend, rallying whenever there was a hint of a major sell-off to resume the bull. Over time it was realised that the market was quite artificial; shorts were murdered whenever they thought the bear had returned and piled in on more short positions, when the DJIA turned in its steps to rally very steeply – forcing a stop loss frenzy that boosted the market even more.
While not as severe in its effect, perhaps because fundamentals appear to be more solidly ranged against a bull trend, the price of crude is also magically levitating off it recent double bottom in a sustained rising trend. They say that if it looks, walks and quacks like a duck it has to be a duck and that makes one wonder whether the strange rally in crude – despite near record US production and growing surplus and reserves, as well as the Iran factor – is not the same as the Wall Street duck?
©2016 daan joubert, Rights Reserved
chartsym (at) gmail(dot)com


