The Rise And Fall Of Gold Stocks


Below are four charts which depict the sad story. Following each chart I will make some brief comments…
HUI – 1 Year Chart
NYSE Arca Gold BUGS Index (INDEX)

The HUI is back to its low reached earlier this year in March, at just under 255. Where it goes from here is anybody’s guess but you don’t need trend lines to see the progression of lower highs and lower lows.
HUI – 5 Year Chart
NYSE Arca Gold BUGS Index (INDEX)
The chart above shows that gold stocks are at their lowest levels since the peak in August 2020. Also, we can see that the HUI rested briefly at this same level when gold stocks were on their way up last year after the collapse in March 2020.
There is a possible (imaginary) line of support which dates back to the summer of 2018. A drop in gold stocks from here could fall from here and touch that line of support which comes in below 200 for the HUI.
HUI – 12 Year Chart
NYSE Arca Gold BUGS Index (INDEX)
The longer-term chart above provides additional confirmation of possible support just under 200 for the HUI. The line of support (same as in the previous chart) actually dates back to HUI lows reached in 2015-16.
However, even at 255 currently, the HUI is sixty percent lower than its peak in 2011 of almost 650. On its own, that is bad enough. Compared to the price of gold, it is terrible.
The HUI to Gold Ratio illustrates how poorly gold stocks have performed relative to gold…
HUI (NYSE Arca Gold Bugs Index) to Gold Ratio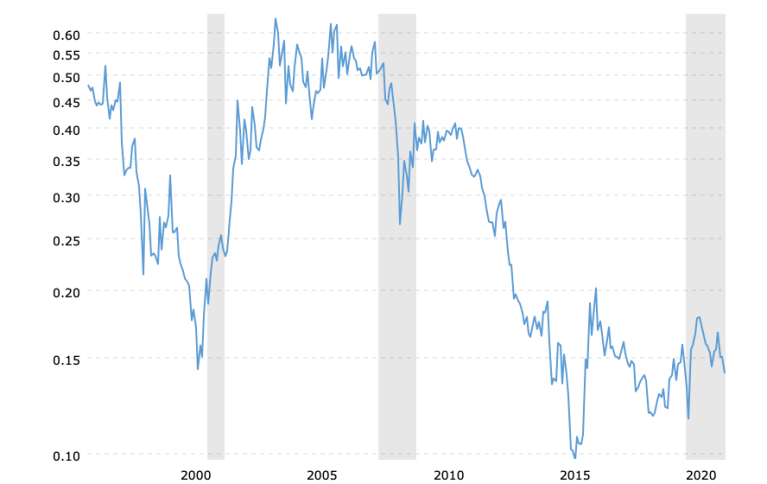
When gold peaked at a new high of $2060 oz. last August, the HUI peaked at 350 which was lower by forty-five percent from its 2011 peak.
The current HUI to Gold Ratio is .14 compared to a high of .64 in November 2003. The steep downtrend is intact and looks to have renewed itself.
Below is a chart of the XAU, another gold stock index which is narrower in scope; but it tracks similarly to the HUI…
Both the HUI and the XAU compare similarly to gold, but not favorably. Either index could be used to illustrate the poor absolute and relative performance of gold stocks.
SUMMARY
Gold stocks, generally speaking, underperform gold on the upside and drop more than gold on the downside.
The current trend of underperformance has been in place for the past two decades.
If you are speculating on new highs for gold and want to own it, then buy it. Don’t expect gold shares to outperform gold itself.
If you own gold stocks, consider switching to physical gold or a gold ETF.
If you are gambling on a reversal of the current trend, or you are just stubborn, you need to be prepared for the possibility (likelihood?) of a near-term drop in gold stock prices of 20-25 percent.
(also see Gold Stocks Continue To Disappoint and Gold Stocks Vs Gold – Not A Good Bet)
Kelsey Williams is the author of two books: INFLATION, WHAT IT IS, WHAT IT ISN’T, AND WHO’S RESPONSIBLE FOR IT and ALL HAIL THE FED!
********


