Silver, Gold And S&P500: Trend Change Due
 share
share
 share
share
 share
share
 share
share
 share
share
The year 2013 was a great year for the S&P and a terrible year for silver and gold investors. There are many indications that it is time for a reversal.
If a market moves too far (up or down), too fast, or for too long, expect a reversal. Examples:
- The S&P 500 index has moved MUCH higher during the past 57 months – a very long time. Expect a reversal soon.
- Silver prices rose from $8.53 in October of 2008 to almost $50 in April of 2011, and then crashed (with help from JP Morgan and others) to under $19 in June and December of 2013. More currently, silver was priced about $34 just 13 months ago and is now down over 40% in that short time. Expect a reversal soon.
- The NASDAQ 100 Index rose from under 1,100 in October of 1998 to nearly 5,000 in March of 2000 and then collapsed to under 800 in October of 2002. This was a mania and crash reversal.
- Crude Oil rose from $51 in January of 2007 to $147 in July of 2008, and then collapsed to $36 that same year. What happened here? It was NOT a change in fundamentals!
The fundamentals for these markets did not change from normal to fantastic to terrible in a short time. It is clear that High Frequency Trading (HFT) algorithms, speculators, momentum players, the Fed, and others pushed the markets higher or lower to unsustainable levels and then reversed those markets.
How do Silver Prices Compare to the S&P?
Examine the data back to 1975 and calculate the ratio of the price of silver to the S&P 500 index. We see that:
| 1. | SI / SP Ratio 38 year average: | 0.029 | |
| 2. | SI / SP Ratio 38 year low: | 0.003 | November 2001 |
| 3. | SI / SP Ratio 38 year high: | 0.365 | January 1980 |
| 4. | Last 8 years average: | 0.016 | |
| 5. | Last 8 years low: | 0.007 | |
| 6. | Last 8 years high: | 0.038 | About 1/10th of 1980 high |
| 7. | Current ratio: | 0.010 | December 2013 |
| 8. | The ratio declined from 1980 until 2001 during the silver bear market and the bull market in stocks. |
| 9. | Since 2001 the ratio has been rising along with the renewed bull market in silver. |
| 10. | Excel calculated a linear trend line for the ratio during the last eight years so that the deviation of the ratio, above or below, averages to zero. See the SI / SP Ratio and Linear Trend graph. |

| 11. | Plot that deviation, above or below the linear trend line, and it is easily seen that the ratio was very high in April of 2011 (silver too high) and is currently quite low – yes, silver is deeply oversold. See the Silver vs. Ratio Deviation From Linear Trend graph. |
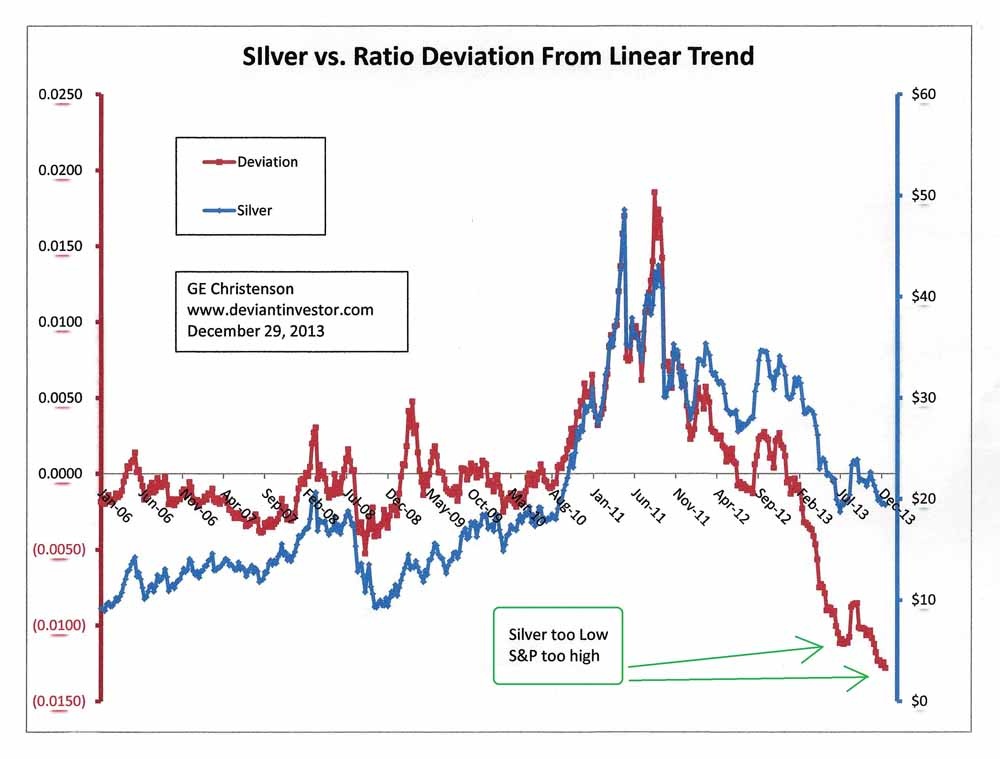
| 12. | When the silver to S&P ratio increases to the average ratio since 2006 then the ratio of silver prices to the S&P should nearly triple – silver prices should rise substantially while the S&P is likely to fall. |
Silver Prices are Too Low Compared to the S&P500 Index
What else supports that analysis?
- Silver prices have been going down, on average, for 32 months while the S&P has been rallying, on average, for 57 months – a very long time for both trends. A reversal is due.
- In the shorter term, silver is oversold and the S&P is overbought, based on their 200 day moving averages. Silver is about 10% BELOW its 200 day moving average and the S&P is 10% ABOVE its 200 day moving average. Prices will regress to their means – higher for silver and lower for the S&P.
- MANY other oscillators confirm that silver is oversold and the S&P is overbought. Expect reversals.
- The U.S. national debt is huge – over $17 Trillion and doubling approximately every 7 years. Over the past three decades the smoothed prices of silver and gold have correlated with the national debt. We KNOW the national debt will continue increasing so we can be assured that, ON AVERAGE, the prices of silver and gold will continue to rise.
- The S&P has been levitated by QE money printing, continual hype about the “recovery” and High Frequency Trading. Margin debt is at an all-time high, similar to just before the 1987 and 2000 stock market crashes. A trend change is due. An S&P crash is certainly possible.
- Paper gold and silver prices have collapsed in the past year while demand for physical gold has risen to multi-year highs. Normal and honest markets do not operate this way for long. We can plan on continuing or increasing demand for gold in China, India and Russia as they trade dollars and T-bonds for hard assets. Expect gold prices to accelerate higher in 2014. Silver will follow.
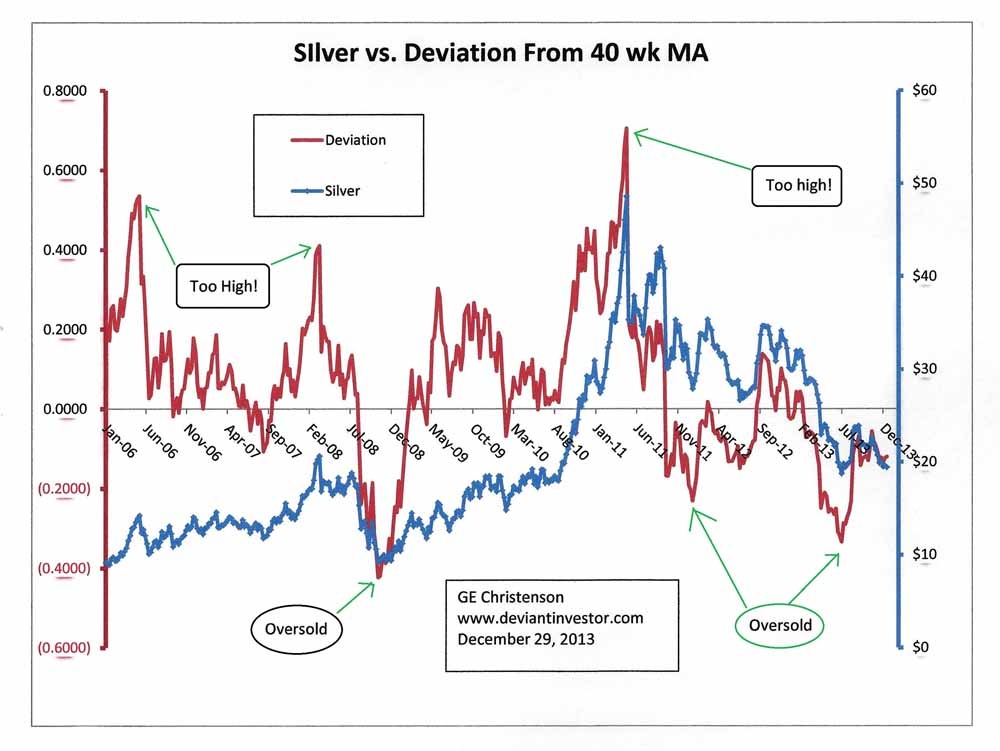
- Compare the price of silver to its 40 week moving average over the past eight years. See the Silver vs. Deviation From 40 wk MA graph. The deviation above/below the 40 week MA indicates that silver is oversold and due to rally.
- Confidence in the silver market is low and only “die-hard” silver investors in the U.S. seem interested. Market sentiment is terrible and that suggests a trend change is likely.
Silver cycles: I understand that in our current environment (HFT, currency wars, manipulation of paper prices by JP Morgan and others, and QE) the prices of gold and silver can be easily pushed higher and lower. Consequently I trust cycles only a little, but consider:

Conclusions
Silver and gold prices have been forced lower in the paper markets while the S&P has been levitated with zero-interest rates, HFT and QE. The financial powers-that-be, the political and financial elite, Wall Street, China, India, Russia, and the U.S. Treasury have all benefitted from the suppression of gold and silver prices. Most have also benefitted from QE and the S&P levitation. The surprise is not that gold and silver prices have been pushed lower after their 2011 blow-off rallies, but that the “smack down” has lasted so long in the face of such strong physical demand.
Regardless, regression to the mean is relevant, even in manipulated markets. Expect a trend change in 2014 and much higher gold and silver prices as they rally above their 200-day moving averages.
The ratio of silver prices to the S&P is back to 2008 levels and substantially below the linear trend since 2006. Expect the ratio to regress (rise) to its mean while silver prices rally substantially from here.
Both long and short term time cycles indicate that an important bottom occurred in June of 2013. It appears that a double-bottom occurred in December of 2013. If this double-bottom holds, time cycles suggest that silver will rally strongly in 2014.
********
Courtesy of http://www.deviantinvestor.com
share
share
share
share
share
 Gary Christenson is the owner and writer for the popular and contrarian investment site Deviant Investor and the author of the book, “Gold Value and Gold Prices 1971 – 2021.” He is a retired accountant and business manager with 30 years of experience studying markets, investing, and trading. He writes about investing, gold, silver, the economy and central banking.


