Slowly But Surely…


It often is best ‘to make haste slowly’…and this seems exactly what the markets are doing. Market news this past week has been most excited about the rallies in gold and silver. However, if one looks at the daily charts in the US Markets this week, it will be seen that despite all the excitement and optimism, they are ‘making haste slowly’! And so do Wall Street and the dollar; they too are now showing signs of aligning trends with the fundamentals, but are also not in a hurry to get anywhere specific. On the other hand, though, behaving as if they now are preparing for the long haul.
Just before the month of April started, the risk posed by options and open interest of the gold and silver futures was seen as critical enough to justify a major raid by the shorts to prevent options being exercised or deliveries taken. That also meant that the metal prices had to be kept under pressure to keep any bullish sentiment at bay. The selling effort to achieve this objective had the effect of pushing open interest on these metals to record heights; which, unfortunately for the shorts, was to no avail, as the last week of April saw the prices of gold and silver break free to end the month at new highs for the year, doing so right on FND for delivery against May contracts. The end effect of this remains to be seen.
There still seems to be 1794 open May contracts on gold and 2846 silver contracts – the latter about half of the number that were still open just before FND. If metal prices continue to increase now, deliveries against these contracts, all of which are now in profit, will put a dent into the available registered stock of the metals. Next month may be even worse, as speculators now have more confidence to hold their positions even through the typical waterfall attacks. The latter now have to be done with much greater deliberation, as the lesson being learnt is becoming increasingly expensive and could become fatal, at least for the Comex!
While the metals have become the topic du jour, both the DJIA and the euro-dollar exchange rate have signalled changes in trend – which still need to be confirmed, but which at the moment look to be quite bearish for Wall Street and the US dollar. Long-term charts showed tops in both these markets much earlier this year and are now being confirmed by the daily charts – unless there is another near miraculous revival for the DJIA and the dollar that has become a feature of this election year. If what has now happened near the end of April becomes the norm for May and June, the heat in the election campaign will rise by quite a few degrees. Trump should be the main beneficiary of such an event.
Dennis Gartman may have changed his views on gold manipulation just in time, but all the other commentators that had pointed fingers at the fools with the tin-foil hats are quiet. I have as yet not read one comment from them saying that Deutsche Bank was very stupid to admit guilt to something that everyone really knows never ever happened in the gold and silver markets :-))
Euro-Dollar
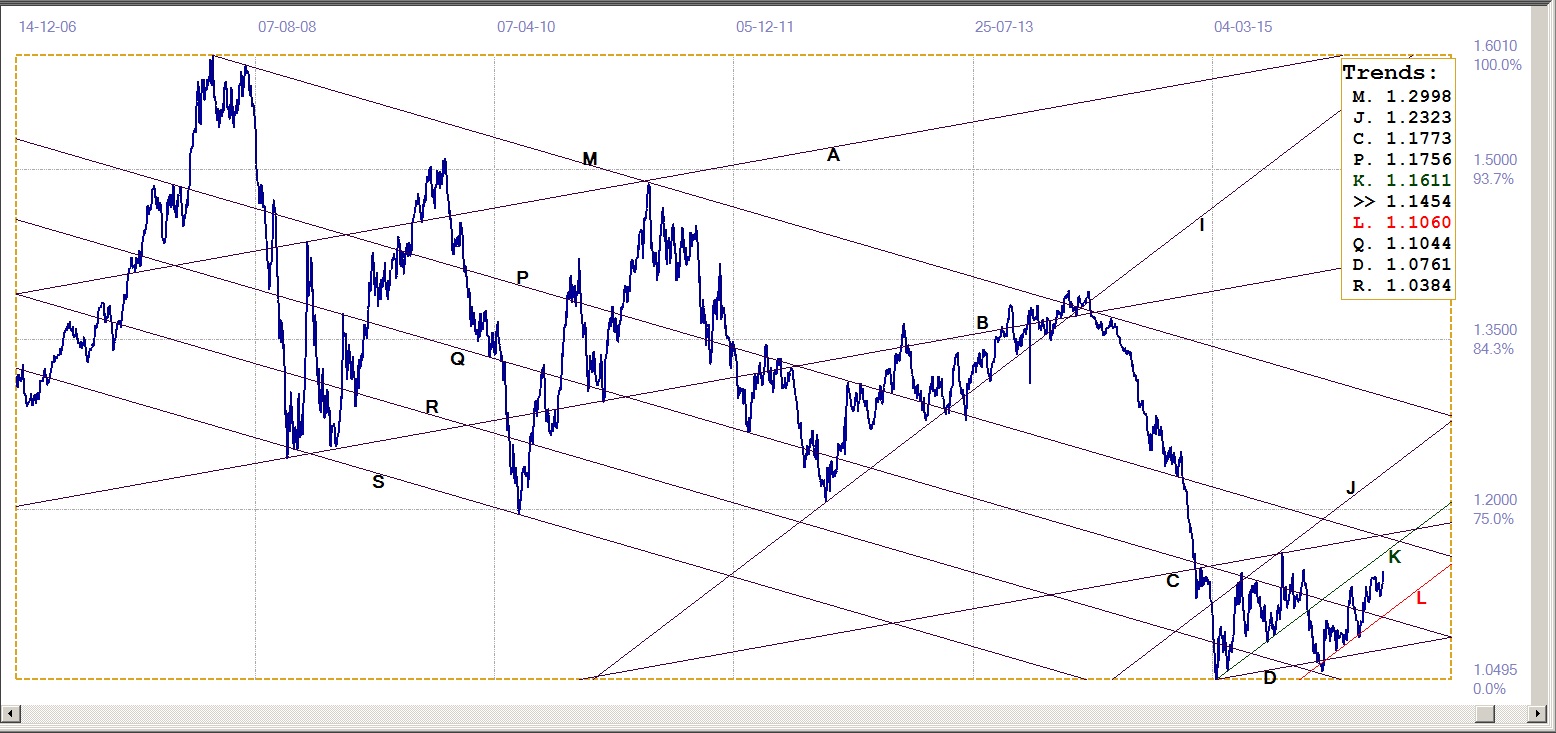
Euro-dollar, last = $1.1454 (www.investing.com)
It is not only silver, gold and the yen that have achieved new highs in dollar terms for 2016. The euro, after some brief weakness, has recovered to move beyond its recent high to move closer to resistance at the top of bull channel JK ($1.1611). A break higher above the channel still has to contend with fresh resistance at lines P ($1.1756) and C ($1.1773).
A break above line C will clear the way for a sustained bull trend market in channel JK and leave a large bifurcated bottom below that trend line – a chart pattern that here would be associated with a major reversal in trend. In terms of the comments in the introduction – and with awareness of the euro’s vulnerability to what could easily go wrong in Europe – the odds favour such a break into new territory.
Dow Jones Industrial Average (DJIA)
The steep and remarkable levitation on Wall Street, following a reversal off 15 660 to remain in steep bull channel KL, petered out with limited success at the 18 000 level. The sell–off towards the end of last week has broken below previously steady support at line B (17930) to turn bearish. This new trend has to be confirmed at the support at line P (17610) and the steeply rising bottom of bull channel KL, currently at 17374, and at 17500 by the end of the week. A break below the support should find the bear trend speeding up.
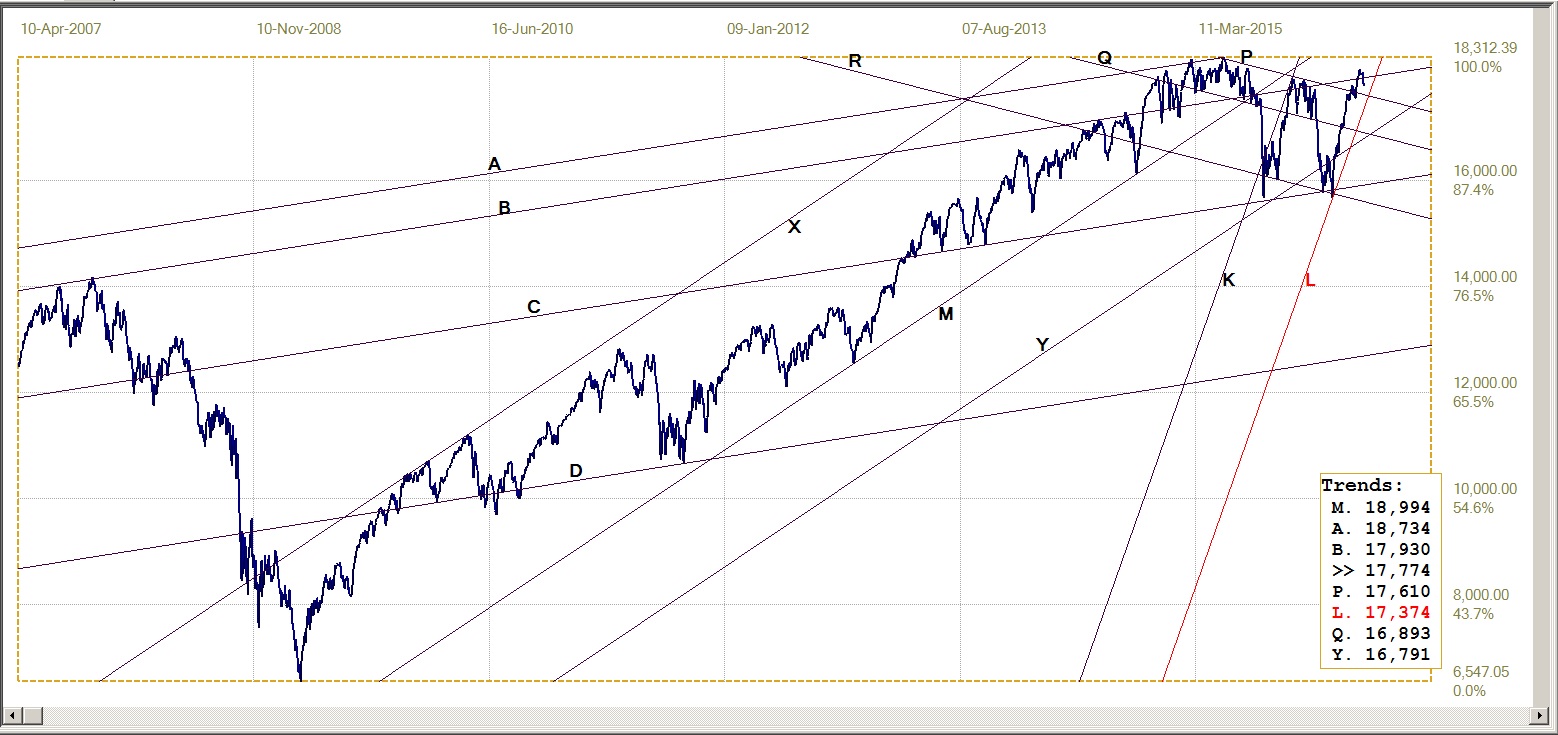
Dow Jones Industrial Index, last = 17774 (money.cnn.com)
Gold PM fix - Dollars
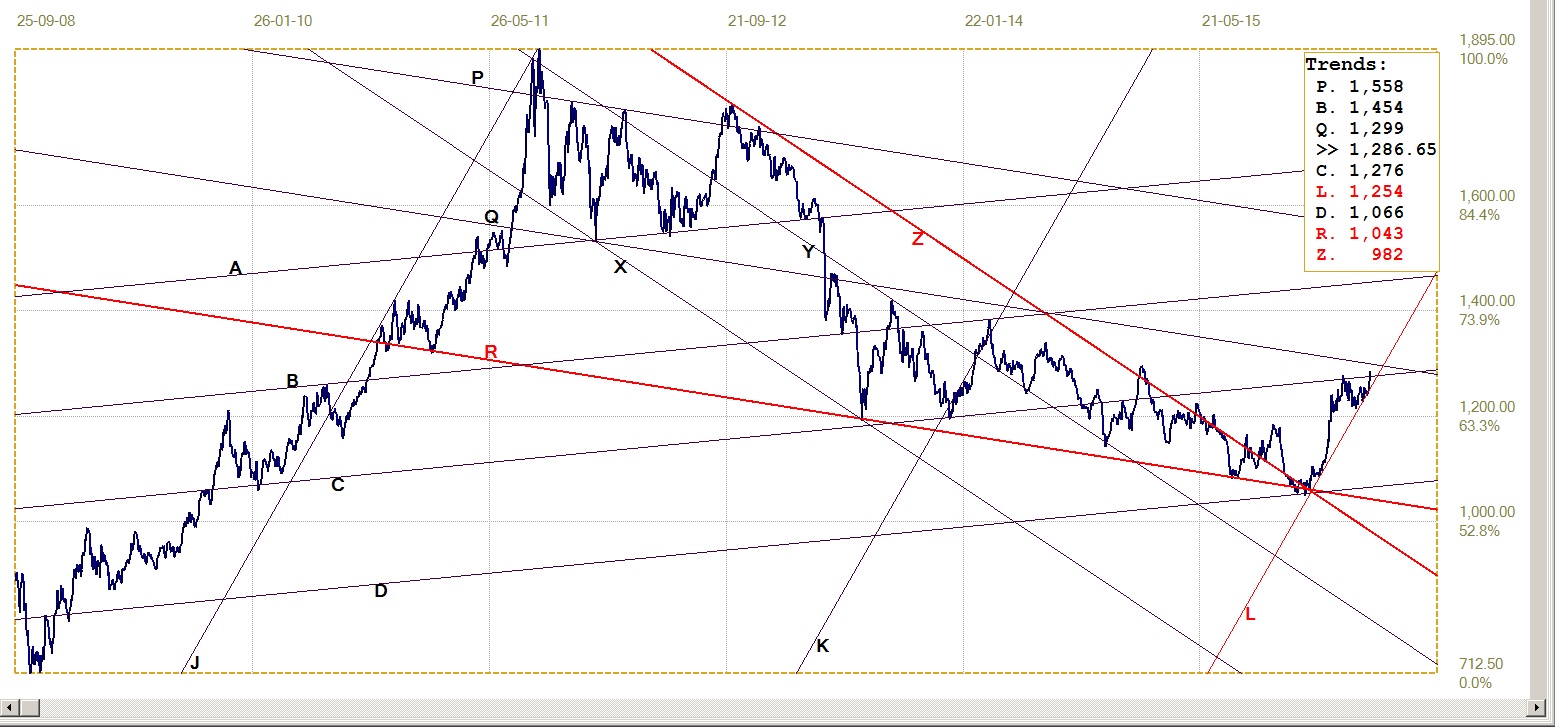
Gold price – London PM fix, last = $1286.65 (www.kitco.com)
Given the sustained pressure on the price of gold since about the middle of March, it is a wonder the gold price has managed to cling to the steeply rising support of bull channel KL. Breaks below that support were minimal in extent and quite brief. Now the gold price has accelerated a bit and managed to break above resistance at line C ($1276). The previous 2016 high, at $1277.50 on March 4, also broke above line C, but failed to hold the break when the pressure mounted.
The combination of the SGE exchange in Shanghai and the admission to manipulation by Deutsche Bank – and their willingness to reveal more about other transgressors – have now changed the field of play for the precious metals. This time the break higher should hold and extend to also break clear of resistance at line Q ($1299), for gold to earn a ‘13’ handle.
Gold PM Fix - Euro
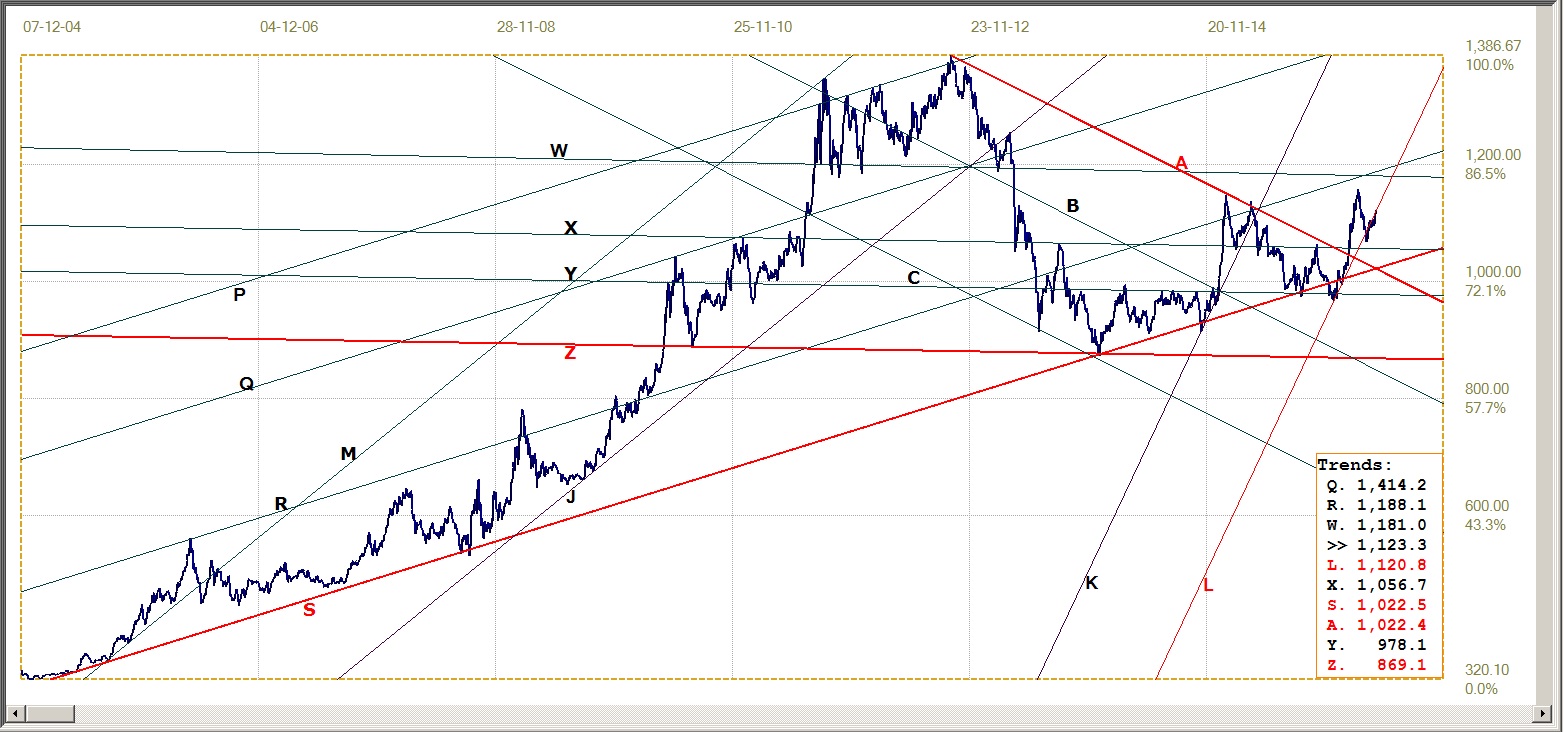
Euro gold price – PM fix in Euro, last = €1123.3 (www.kitco.com)
Despite the euro recently strengthening against the dollar while the gold price had to contend with suppression, the euro price of gold clung to the support of its own steep bull channel, KL (€1121), albeit not with as much success as the dollar gold price achieved in its own bull channel. Breaks lower were limited and the price held close to the steep trend. On Friday morning, the euro price was a fraction above the support of line L should have looked even better by Friday afternoon when gold ran close to the $1300 level. Perhaps this week may see a return to bull channel KL.
Silver Daily Fix Chart
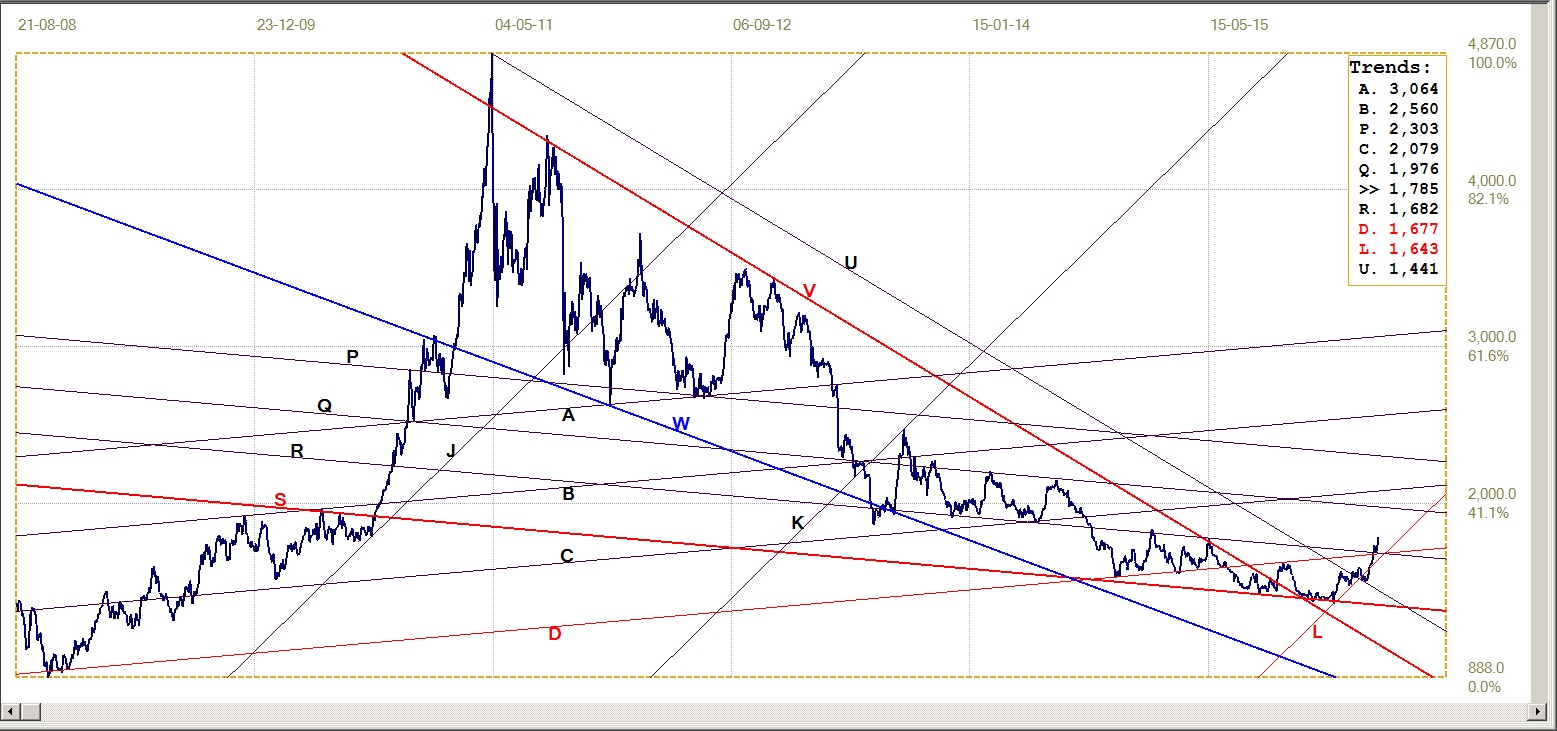
Silver daily fix, last = $17.85 (www.kitco.com)
In September 2014, 16 months ago, the price of silver failed to hold above support of line R, then at $18.50 and now at $16.82. Except for one brief peek above line C in early 2015, the price was confined to the channel RS until it started to rise along the support of line L ($16.43) and again break above line R and line D ($16.77). A reversal to test the support at line R has now become a goodbye kiss on that trend line, which confirms the break and that now should see the price moving higher.
U.S. 10-Year Treasury Note
It is early days yet, but the previous action along trend lines U and V were bearish for quite some time; line W, member of the set UVW, should have a similar effect. This raises the possibility that the yield will remain within bear channel VW until it breaks above market support at lines L (1.983% and C (2.051%) in order to test important market support at line R (2.135%).
New weakness in Treasuries is expected should the US dollar remain bearish, as is expected. Foreign holders of Treasuries have been held in suspense for months by strength in the bond market or the dollar whenever the other was weak. If both of these become bearish, they will become tempted to sell and bank their profit.
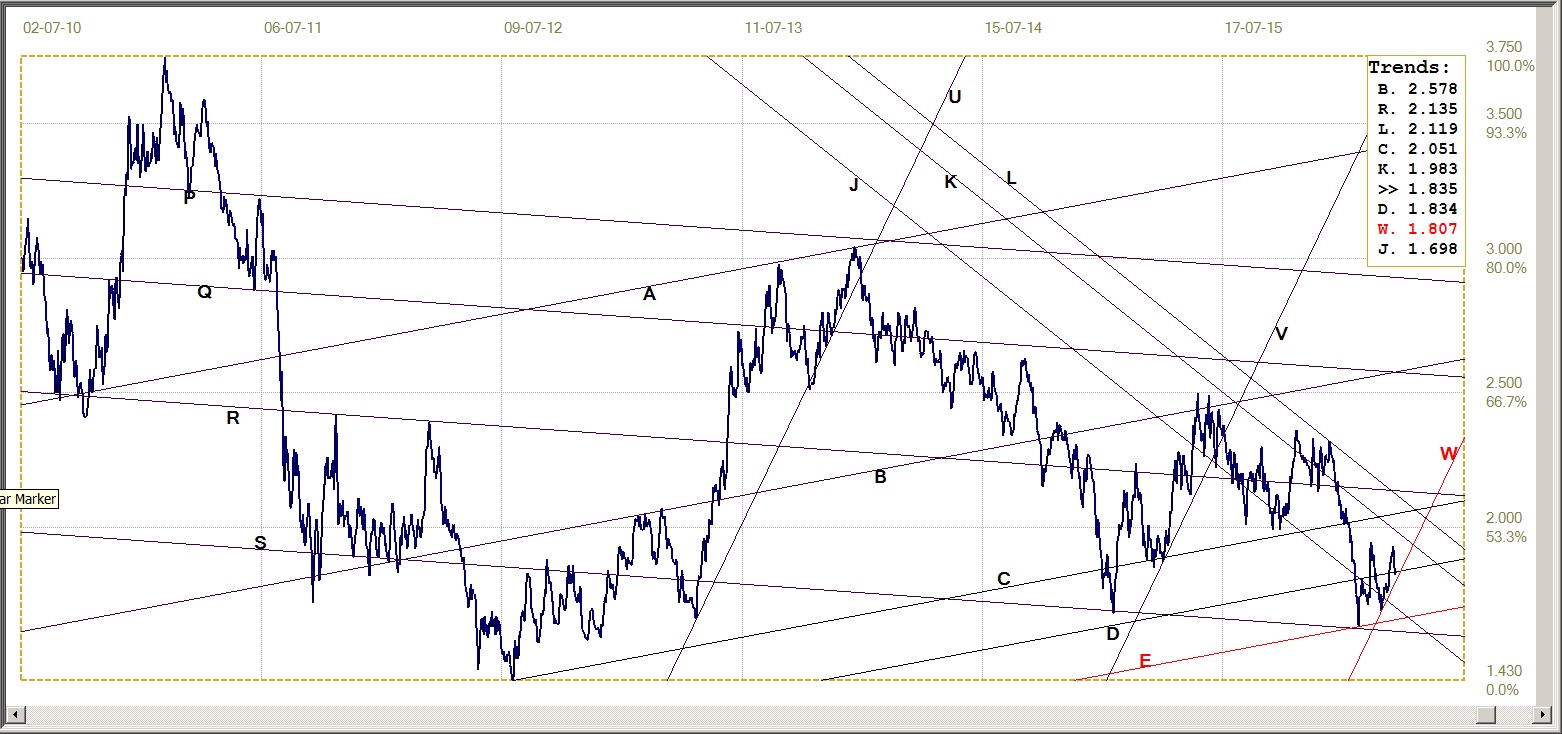
U.S. 10-year Treasury note, last = 1.835% (www.investing.com)
West Texas Intermediate Crude. Daily close
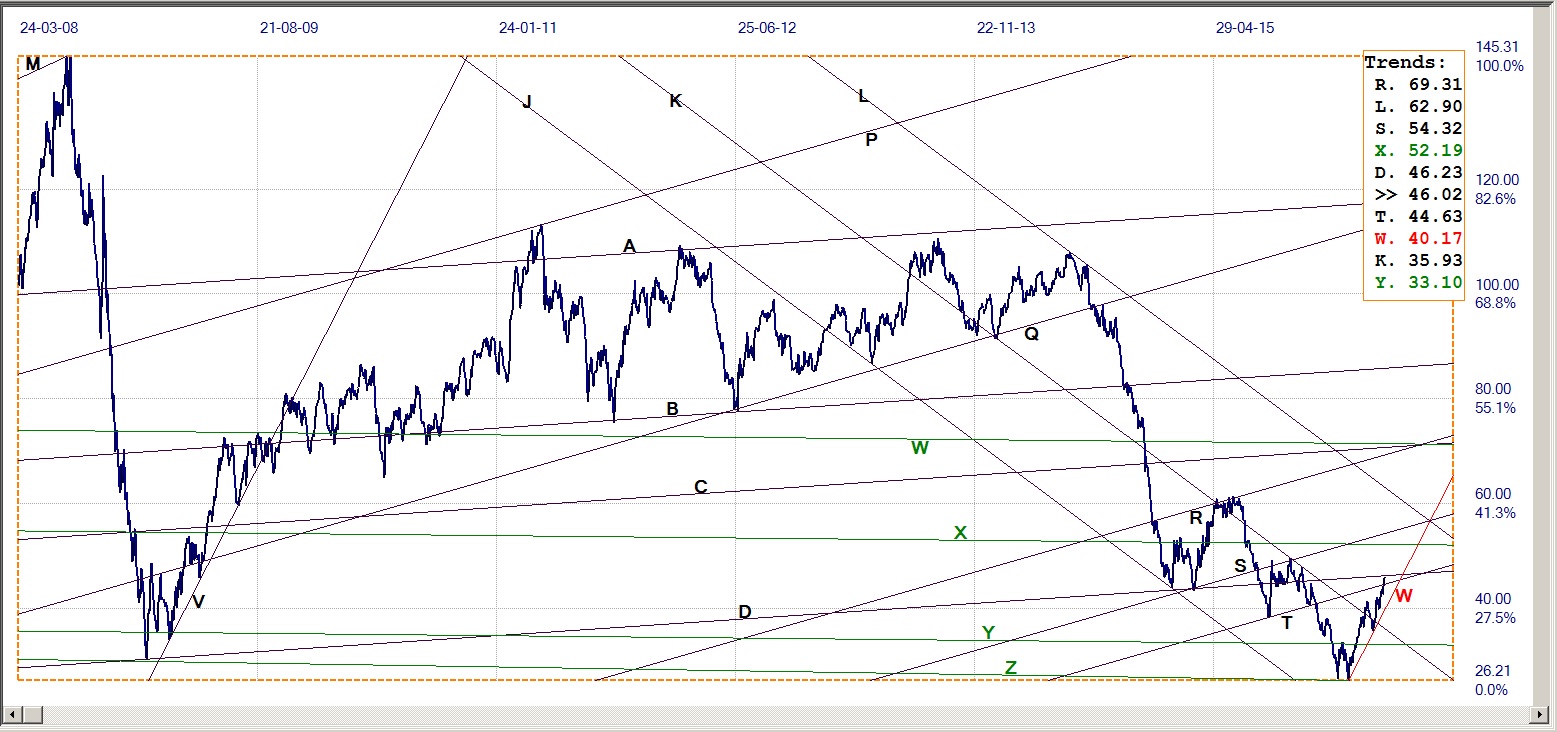
WTI crude – Daily close, last = $44.02 (Investing.com)
here was a time when it looked as if the WTI crude oil price was being supported in artificial fashion. This in response to evidence that Wall Street was subject to major concern for banks suffering from the bad debts of fracking producers and that the DJIA improved or fell in step with the price of crude. This may now end as equities could be bearish from now on irrespective of what crude does, in which case crude could again respond only to supply and demand fundamentals.
The price nevertheless easily held to the steep support along line W ($40.17) and has broken above resistance at line T ($44.63), to end on Friday at resistance at line D ($46.23). A break higher here would add some confidence to the strength of crude in its own right.
©2016 daan joubert, Rights Reserved
chartsym (at) gmail(dot)com
More from Gold-Eagle


