SPX Index And Gold Price; Pivotal Points At Hand


Leaving aside our usual inclusion of macro fundamentals and market ratios, today let’s take a simple technical look at the S&P 500 and gold.
As the US stock market was becoming deeply oversold (and over-hated, sentiment-wise) in December we planned for a holiday seasonal bounce, which finally arrived with the immediate reversal after the Christmas Eve massacre when the machines (and a few human casino patrons) drove it to its downside climax. The bounce was almost a certainty, given the sentiment backdrop of the moment.
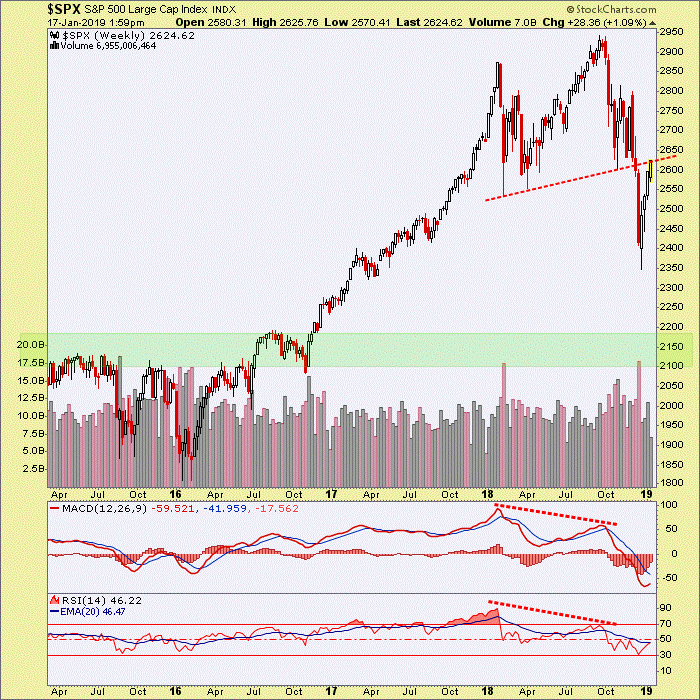
Our (NFTRH) view however, has been for an eventual decline from a significant momentum divergence (MACD & RSI) to the obvious support of 2100-2200 (which is also the rough measurement from the bearish pattern) on SPX per this weekly chart. The current market bounce was expected and necessary to rebuild the conditions for enough downside to meet our target.
But with a bounce, especially a powerful one coming off unsustainably poor sentiment, comes the question of whether it is just a bounce or is it something more? In markets nothing is certain and anyone claiming to have an answer to this question is simply selling confidence or a cemented viewpoint.
We had a probabilities and technical based projection of a strong but ultimately doomed bounce, and it has played out well. But we should also have a complete willingness to admit if/when wrong (about the doomed part). As of this writing the projection is not wrong; it is 100% on track to our intervening SPX bounce target of 2600-2650. The down-sloping SMA 50 has kissed this pig, right on the lips.
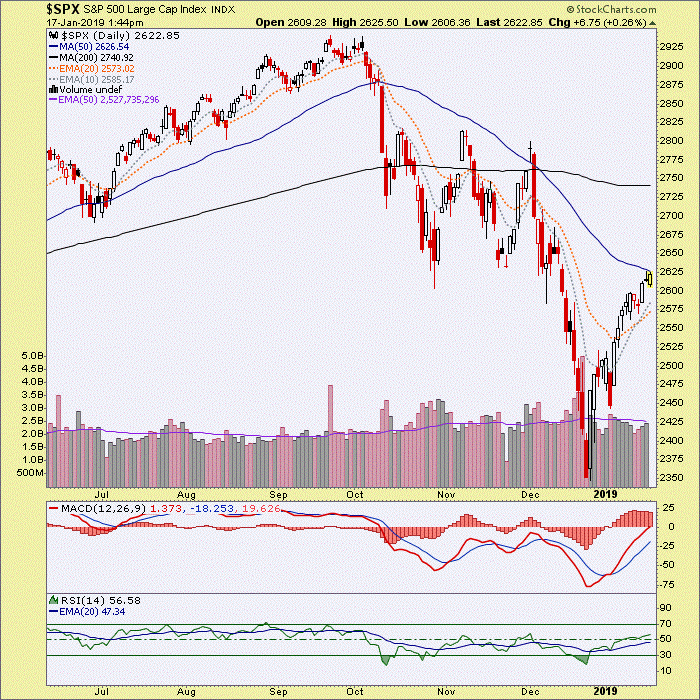
But a break through the SMA 50 would start to get market bears a little hot under the collar.
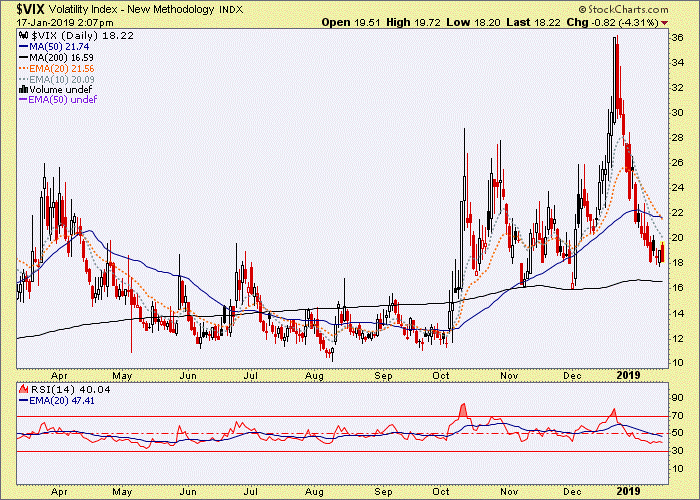
One thing that market bears have going for them is the VIX, which along with several other sentiment indicators that we track each week in NFTRH, indicates that the risk to a bearish view is much reduced now compared to December.
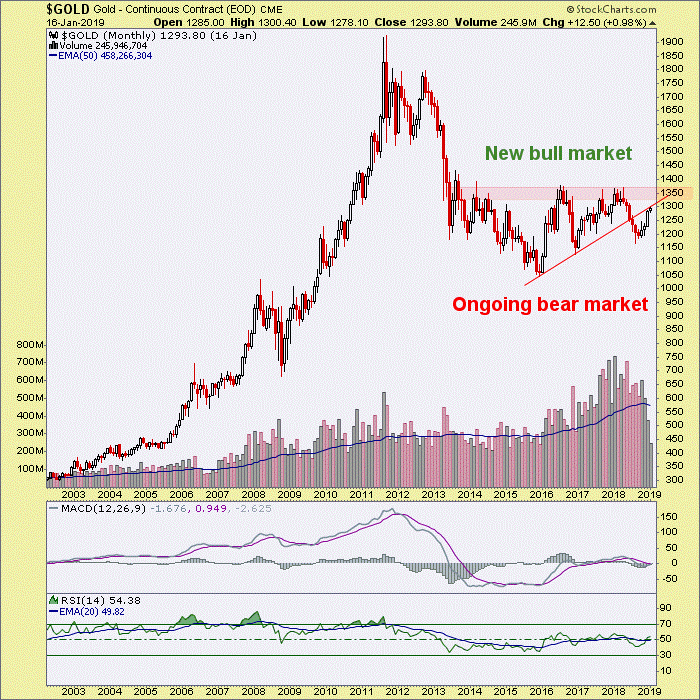
So if the cyclical, risk ‘on’ world is thought to be just bouncing what of the counter-cyclical asset, gold? The decision point for gold is that of ‘new bull market?’ or ‘no new bull market?’. Let’s use daily and monthly charts to answer these questions.
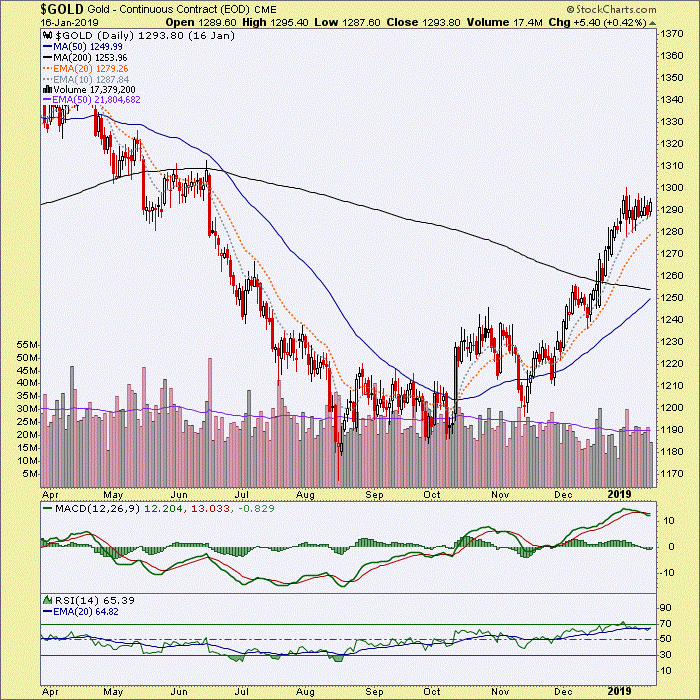
Gold’s daily chart is consolidating well above the 50 and 200 day moving averages, which are about to be hyped by the media as a “GOLDEN CROSS!!“. The warning on such hype is to eventually expect an opposite reaction. This could however, come after new short-term upside. Technically speaking, gold’s daily chart is looking pretty good, in a flag that is partially working off an overbought situation.
The key daily chart resistance (not shown here) we have been tracking in NFTRH is at 1309. The consolidation is lurking just below that area. If the flag breaks upward gold will probably ding the target. If it breaks down, this leg of the rally is over.
The monthly chart however, shows a situation that has not changed in years. The (technical) gateway to a new bull market in gold is the resistance between 1350 and 1400.
Some chartists are imagining a bullish Inverted Head & Shoulders and others an extended bowl-like bottom. But until a rise above 1300 and then a clean takeout of 1378 there is no new bull, technically speaking (although as you may know, NFTRH routinely gauges the sector by far more than nominal technicals).
The bull case does have a notable ally, however. The more times a key resistance area is tested the weaker it tends to become. It’s been tested twice already (3 times if you count early 2014). It is a monthly chart however, so the bull view would require time and patience.
Bottom Line
Above we view a premier cyclical market (SPX) and a premier counter-cyclical market (gold). A big part of our heretofore bullish fundamental view of gold has been the big crack in the stock market. SPX has made it all the way to our bounce target and now the decision is at hand; obediently fail from here and make Gary look smart (he’s not, he just works hard)? Or bust on through and bust our current analysis?
The implication for gold will likely be one of proceeding into an eventual bull market or another failure. To make matters more confusing (but that’s the market, isn’t it?) I can envision a scenario where the stock market fails, drops to 2100 and from there goes very bullish for a big rally at least. If gold has not clearly taken out 1400 by then I’d be cautious on the relic until stocks play out that rally.
But this article also presents a question about whether SPX has already bottomed (on Christmas Eve). If that is what proves to be true, gold will continue to fall out of favor as long as bulls thunder back into stocks.
We are getting a little too wordy now for a public article. That is why the detailed work needs a weekly report in order to continually hone the view. This article simply tries to show the pivotal situations in two opposing markets as they stand now.
********


