Statistical Subterfuge


Happy Independence Day to all readers! Mark Twain is often quoted to have said quite famously, “You get lies, damned lies and statistics”, or words to that effect. Now Mark was not an economist or a statistician, so the veracity of his statement is questionable – but if a lie is seen as a statement that does not fully reflect reality, then certainly he had experience of lies. That statistics are malleable and can be ‘tuned’ by selecting the right initial conditions and assumptions, the results can be made to reflect even the opposite of what is really true; a lie can be cloaked to resemble scientific objectivity. This has happened often and still happens; to confirm the truth of Twain’s statement.
Consider the two measures of inflation. The first is the CPI, which, as often stated here and elsewhere, does not reflect consumer real price increases in a meaningful manner. Traditionally the CPI was used as a Cost of Living (CoL) index to guide the employer towards wage and salary increases that enable good employees to sustain their standard of living. Now that the new CPI takes account of the substitution of purchases by the consumer to allow for price increases of some goods, the concept of “standard of living” no longer has its old meaning .
To use an analogy; if in the early 1990s, before the new CPI, you started work as a clerk in a grain and feed store, you might have been able to save and then buy a new Ford F150 – red, of course. Ten years later, when it is getting too old, you cannot buy a new F150, even with a trade-in of the old. You have to look for a decent used F150 and, with the trade-in, still have to pay off the balance over 3 years.
Ten years later when this one has to be replaced and, since you have to live far from work where rentals are cheap, you have to settle for a used small import. Then, when the import is trashed in an accident, you have to shop around for a used moped to get to work. Since you still have motorised transport, it means your standard of living has been sustained, because you were able to make use of substitution to do so.
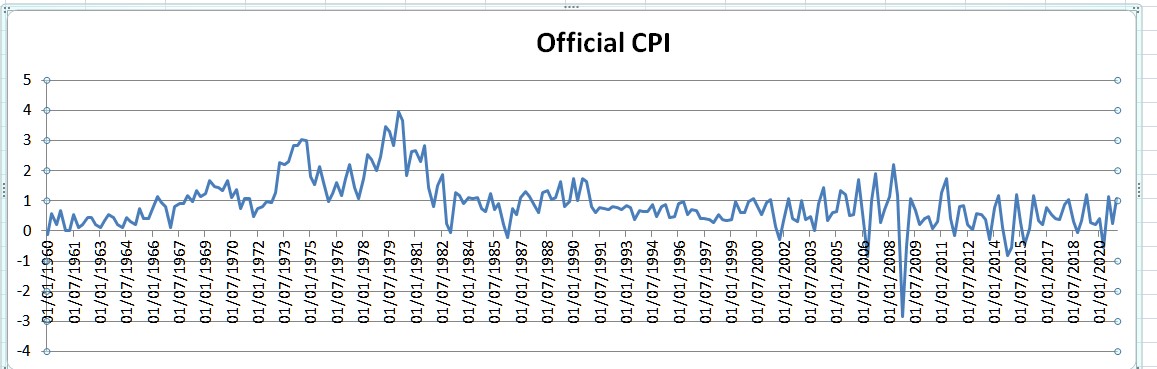
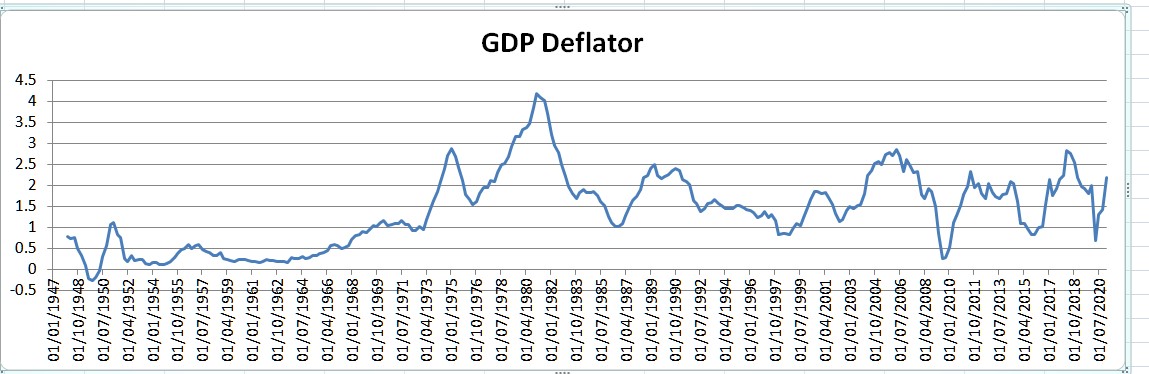
The above two charts from FRED, the St Louis Federal Data base, show the CPI and the GDP Deflator, of which the latter is used to determine the ‘real’ value of the GDP. Below CPI is compared to the well-known unaltered CPI, from Shadowstats.com.
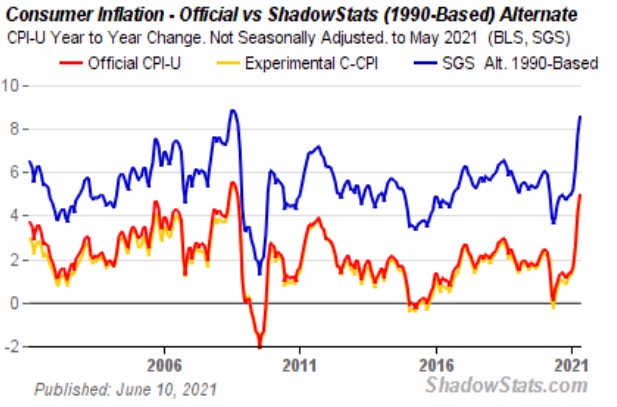
This chart only spans the last two decades of the previous two charts, but this is sufficient to show that both the official CPI and the deflator reflect smaller price increases than the original CPI. This means that the GDP has cumulatively been overstated for longer than 20 years. Some supporting evidence of the decline in US economic activity is found in the number of passenger cars produced in the US, shown in the chart below, covering a period during which the population increased by 50%.
From 1970 to 1980, the period when the US worker is said to have been best paid and enjoyed a high standard of living, car sales fluctuated at a high number, as shown in the chart below. The high interest rates in the late 1970s kept new car production low for a few years before it managed to recover towards previous highs. Production then declined again from 1985, leveling off briefly after 1990. From the mid 1990s – when the CPI was changed – production suffered a near permanent decline.
The US motorcar industry spent the past 20 years in steady decline, probably for quite a number of reasons. Among these were foreign imports, export of US manufacturing capacity and continued higher quality which meant that vehicles could be used longer. Undoubtedly, the declining purchasing power of the wages of households as incomes failed to maintain pace with price increases, is another contributing factor. No wonder there was great concern about inequality of income not too long ago, which soon died down again; perhaps since the reason is an embarrassment that must be kept quiet.
(Can https://www.amac.us/animated-chart-of-the-day-worlds-top-ten-countries-for-motor-vehicle-production-1950-to-2019/ be a correct reflection or is it fake news?)
Some time ago, the Federal Reserve announced they would cease to publish the widely followed M3 money supply index. While the M2 was continued, the M3 accounts for the ready cash of the M2 as well as time deposits, money market funds and so on; cash that is not viewed as immediately available. M3 reflects liquid wealth, by then mostly in the hands of the upper tiers of society, and its rapid increase was becoming an embarrassment. So not only are statistics employed to conceal information that the authorities believe should not be made public; when deemed necessary, it is removed from public circulation.
Just as well that the Fed did so some time ago. The OECD still compiles an M3 for the US and it is available from the St Louis Federal Reserve database.
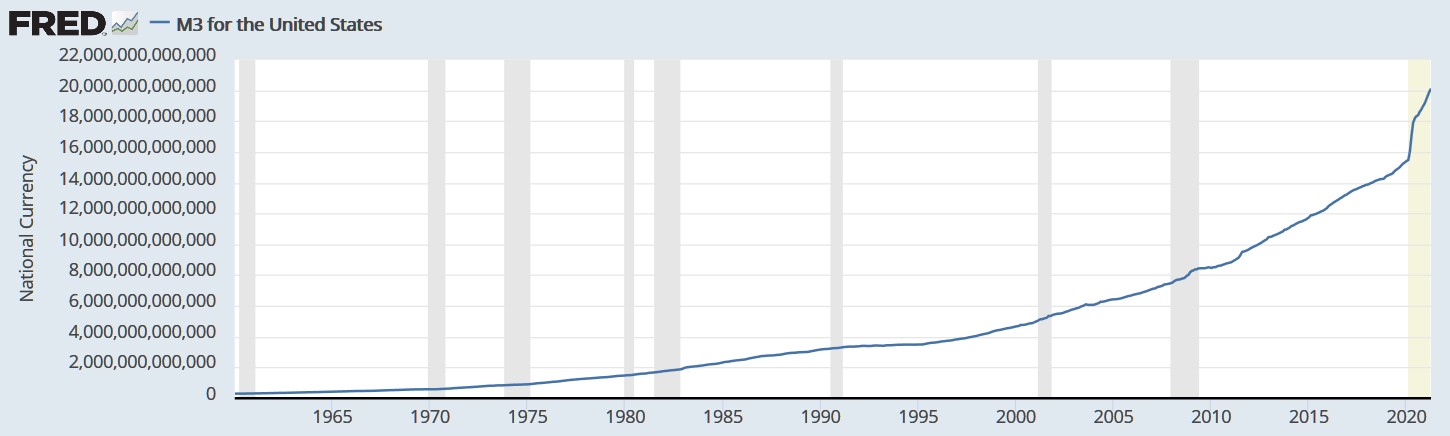
The table below present data that was extracted from the above chart. In the second column the M3 supply at different dates since 1960 is shown. The time lapse between the dates is used to determine the average annual increase in the M3 in $millions.

The chart of the M3 shows that, except for a slight flattening in the M3 at the time of the Great Financial Crisis, there has never been a correction in the growth. This is to be expected from a growing and expanding economy. While a gradually increasing gradient is expected as the economy grows larger, the recent spike higher is new; but does not come as a surprise, of course. If the relationship between the money supply and inflation hold true and while the trend can be expected to hold and not reverse, one has to wonder if the jump in inflation will be of a transitory nature?
We are now into the new Basel lll prescription for big international banks and nothing of note has happened to the prices of gold and silver or to the suppression of their prices. A switch was flicked to define a change in how holdings of gold are accounted for in the books of the Banks. However, it seems too optimistic to think that the effect will be like a light switch – an immediate response. If the banks are willing to bear the financial costs implied for carrying unallocated gold under the new rules, they can wait quite a long time before modifying their positions to reduce the costs.
All indications are that the price suppression scheme has a high priority and therefore is likely to be sustained for a time to try and obtain an orderly compliance with the new rules, balancing the cost of waiting with the urgency at which the suppression of the gold price is rated. Time will tell.
Euro–Dollar
The third reversal at line R, seen last week, has failed to hold. A resurgent dollar last week pulled the euro below the support of line R to settle a little below earlier support. Should it happen this week that the dollar strengthens further, it will further confound the predictions of a dollar bear market that will reflect the high level of inflation as this is perceived and expected by local and foreign economists.
The possibility exists that the strong dollar last week was only an ‘end of half year’ phenomenon and that the dollar will resume and extend its multi-month bear trend as the second half of 2021 begins.
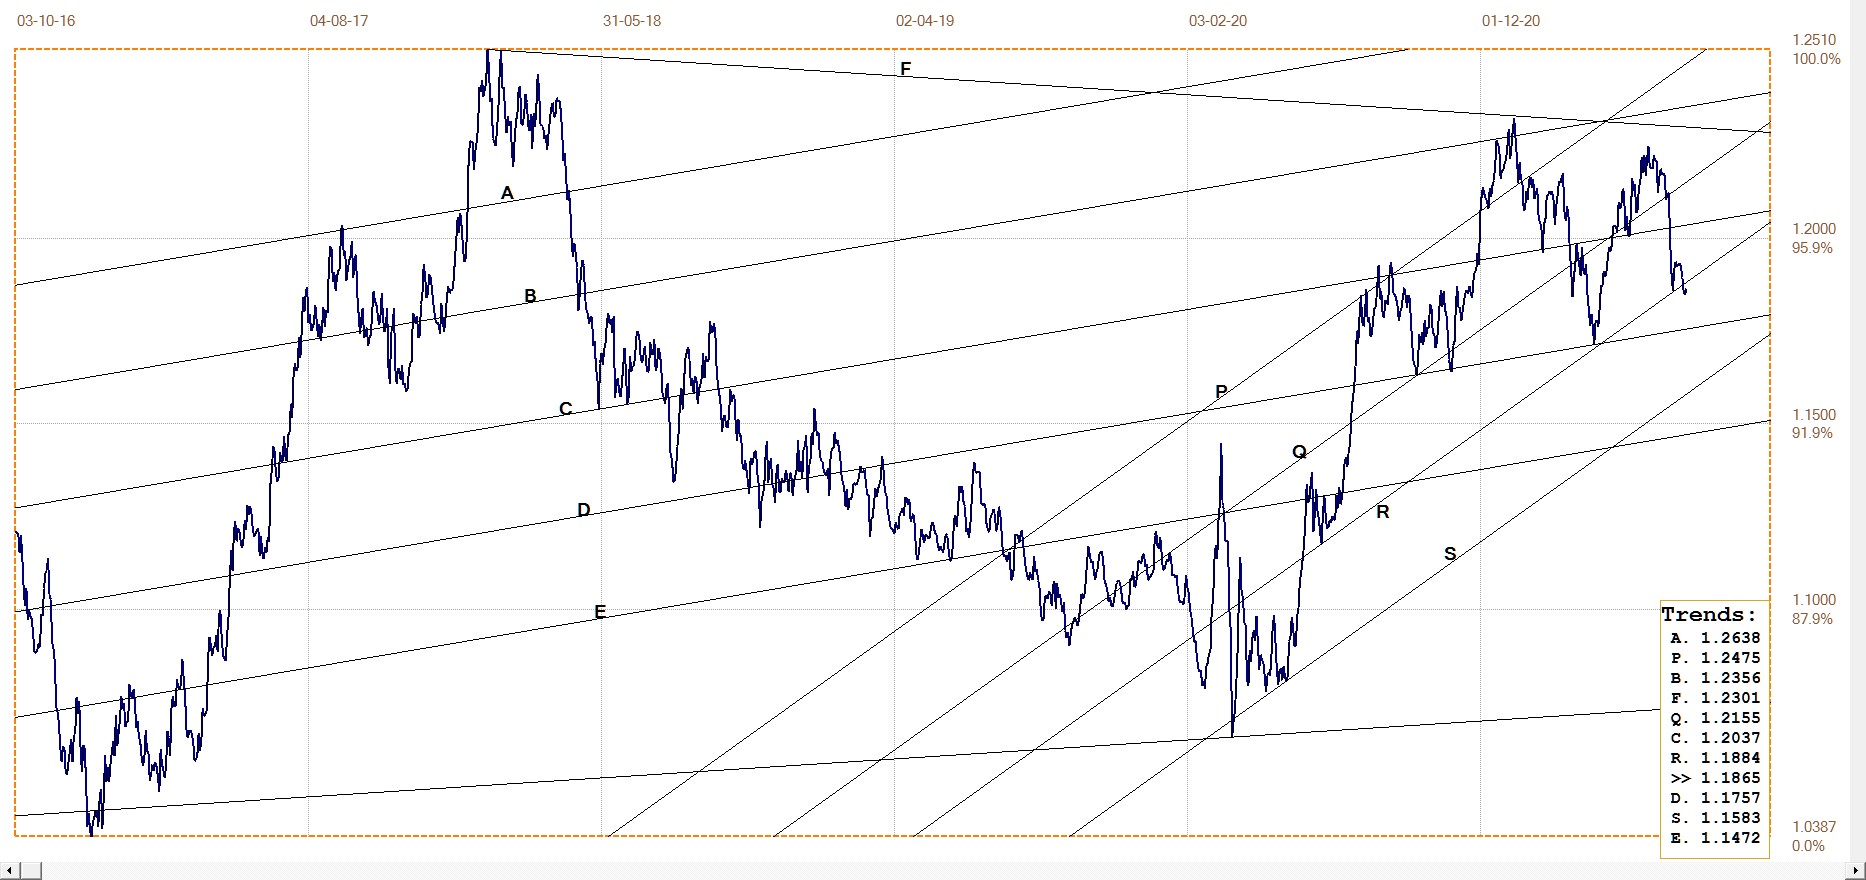
Euro–dollar, last = $1.1865 (www.investing.com)
DJIA daily close
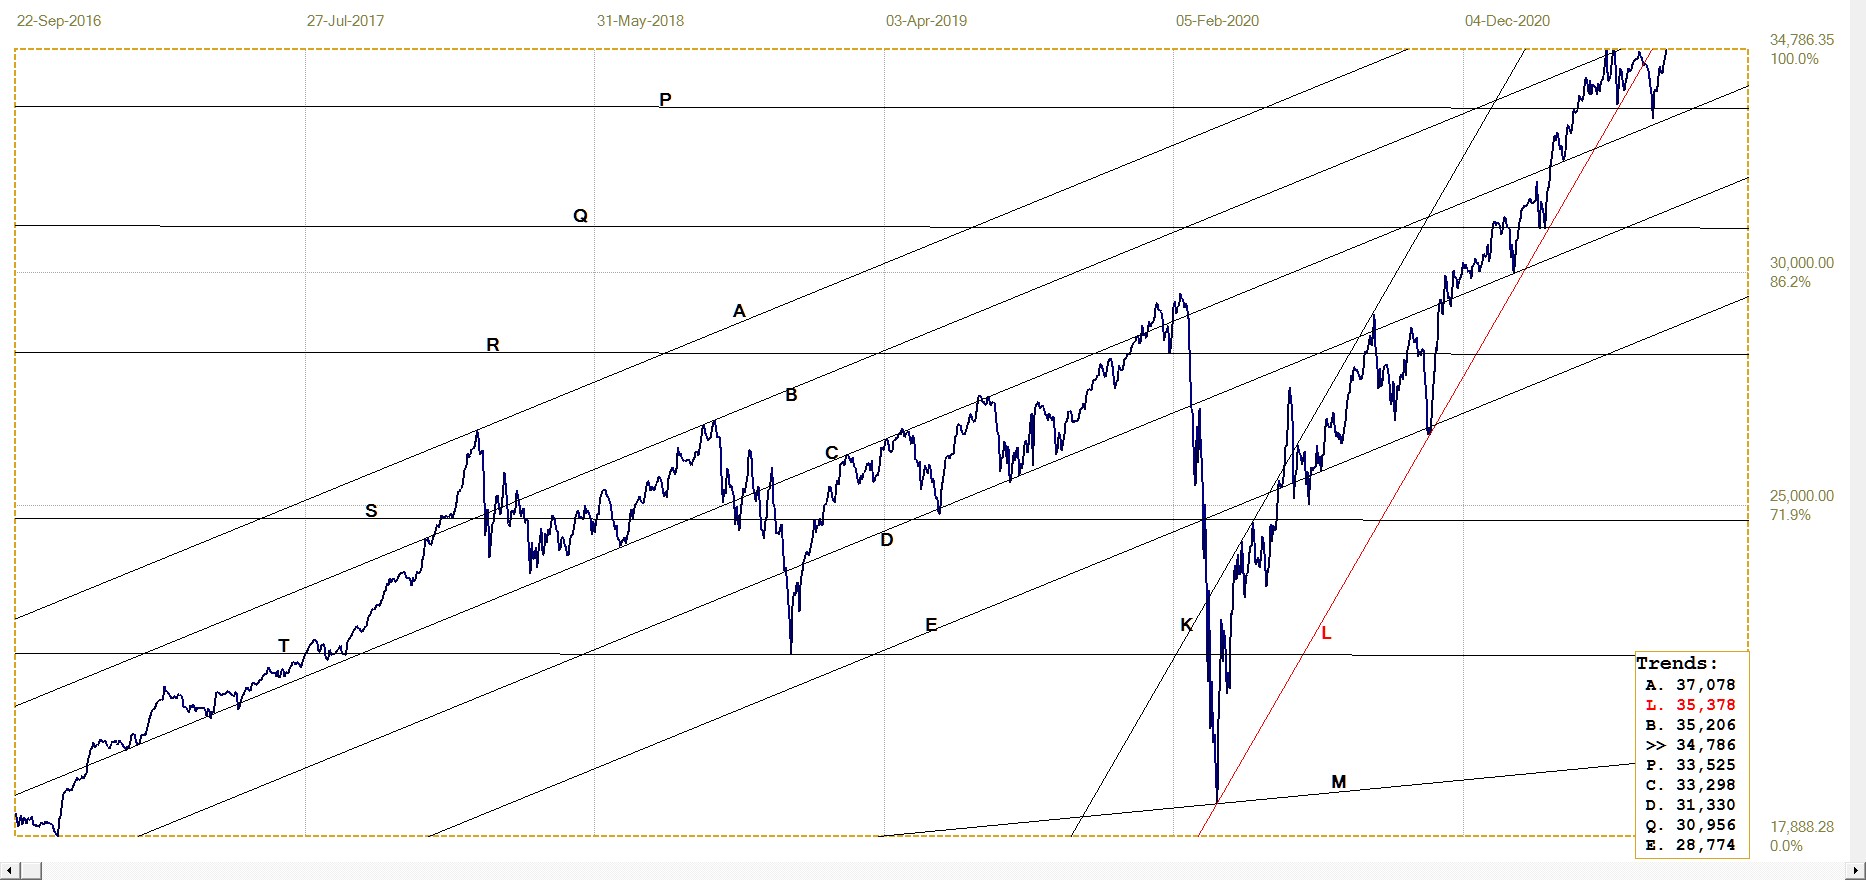
DJIA. last = 34786.35 (money.cnn.com)
At last, after several failed attempts, the DJIA joined the S&P500 and the Nasdaq at setting a new all time high. As it happened, both the other indices also reached new all-time highs last week in a triple celebration of the loose money policy. As for the dollar, the steep rally last week might well be an over-shoot of the end of the half year rush to favour stock with heavy weights in the various funds.
If the rally should be maintained and extend further, will warnings of an impending Wall Street crash be proven wrong or just premature? The Dot.com bull market of the late 1990s also drew many warnings of a ridiculous pursuit of ‘presumed value’ that were laughed off, until the crash soon after the turn of the century. Time will tell whether we will see an inflationary bull market or whether the recent multiple tops will be the end of a bull market that is lasting longer than anyone could expect.
Gold London PM fix – Dollars
The London PM fix dropped by $25 dollars from Monday to Tuesday last week, with a fix of $1755.95 on Tuesday. This was seen as a harbinger of another victory for the Cabal on Wednesday when some OTC contracts could be expiring on June 30. The surprise was that on Wednesday the PM fix at $1763.15 was a rebound from Tuesday.
It is not known whether the attack on the gold price was relaxed when clear victory was in sight or whether demand increased in expectation that the price of gold had reached a significant low in its anticipated bull market. Perhaps a combination of both, as the Cabal did not want to go too much short at these prices given good demand.
The PM fixes on Thursday and Friday continued the recovery of Wednesday, with fixes at $1781.50 and $1786.15. But nothing counts until $1900 is breached and held.
Gold price – London PM fix, last = $1786.65 (www.kitco.com)
Euro–gold PM fix
A weaker euro did nothing to help the euro price of gold hold at or above the support of line F when the dollar price came under attack. The break lower below the support - as for dollar gold – was fleeting, with a decent recovery happening before the end of the week.
What happens next will depend, as always, on a mix of how the dollar, gold and the euro behave relative to each other. The dollar is the lynchpin in the relationship, but gold can be the maverick should it begin to regain its intrinsic strength of a year ago.
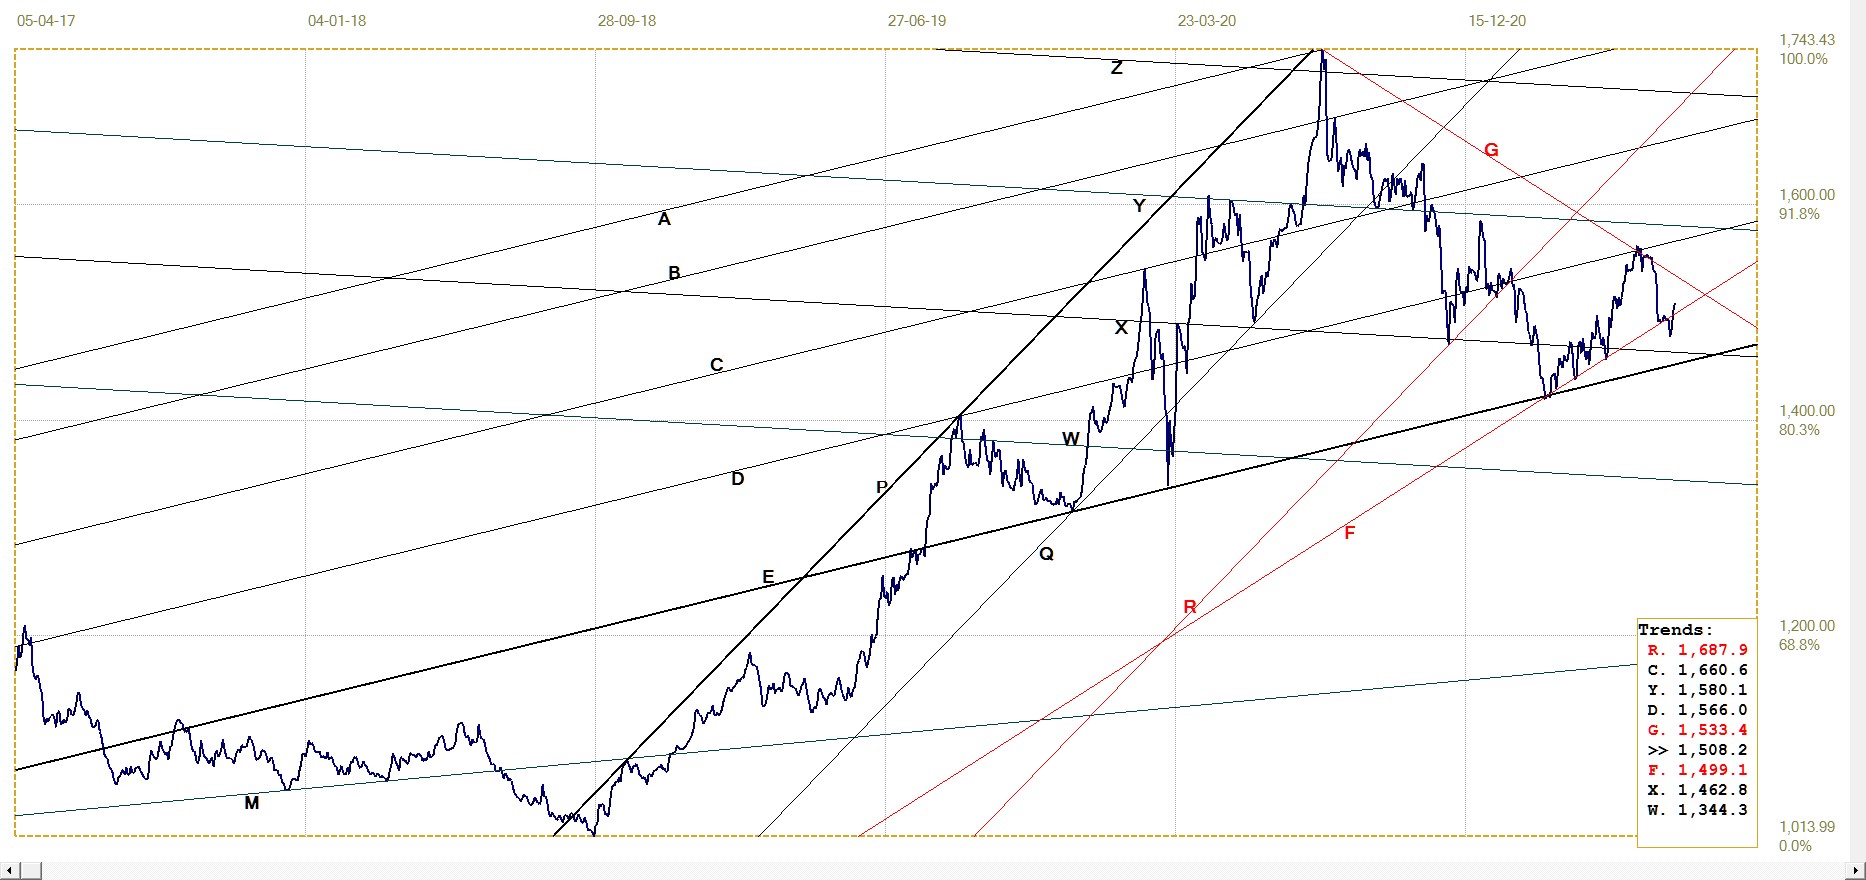
Euro gold price – PM fix in Euro. Last = €1508.23 (www.kitco.com)
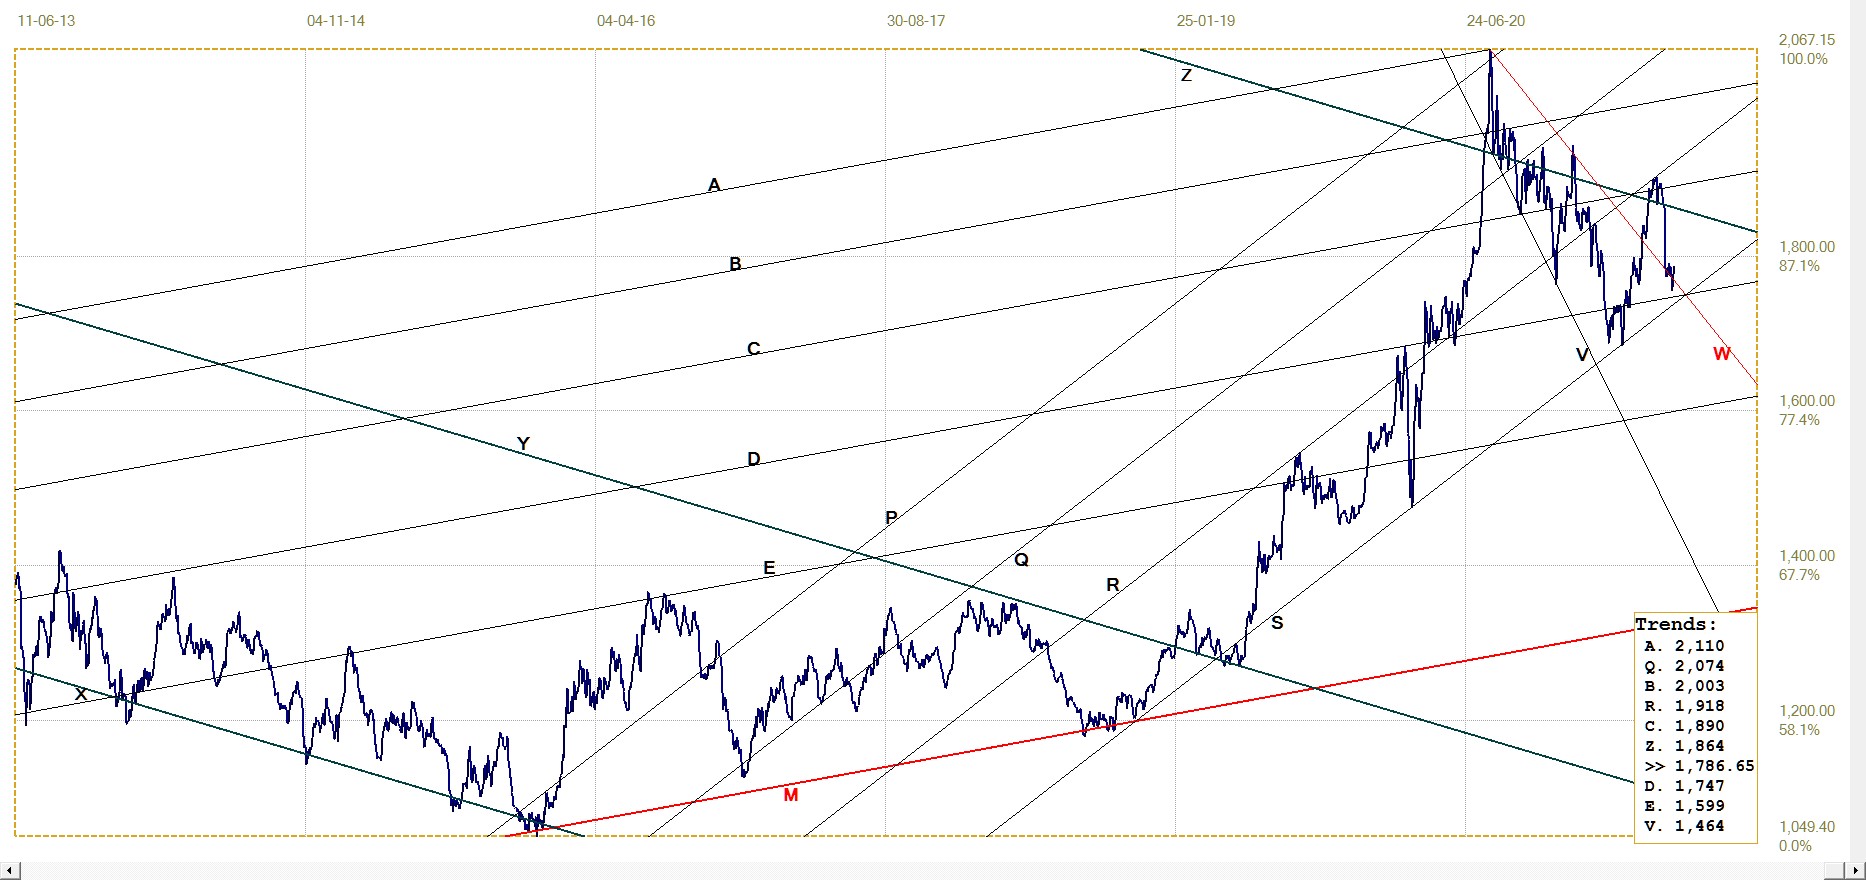
Silver Daily London Fix
Like the price of gold in dollars and euro, the price of silver also broke below technical support as the half year closed out. Yet here the spike lower did not hang in potential free fall, but held at the bottom of its current bull channel, before rebounding higher, back above the support that had just failed to hold.
Silver, by recovering above $26 immediately after the low London fix at $25.86 at the end of the half year on Wednesday, could be intimating that it stands ready to resume the leadership in the bull market, regaining the position it held early in May last year.
Silver daily London fix, last = $26.17 (www.kitco.com)
U.S. 10–year Treasury Note
U.S. 10–year Treasury note, last = 1.431% (www.investing.com )
There is no threat of sustained inflation. The spike to 5.2% in the (official) CPI will be transitory. That is the implied message from the bond market as the yield of the 10-year Treasury bond sets a new recent low on Friday. Keeping in mind how rapidly the US M3 money supply is increasing and the steep acceleration during 2020 until April this year, this could imply that the people promoting MMT are correct.
Modern Monetary Theory holds that the state can print as much money as necessary without incurring any significant inflation. MMT is innovative and opens the gates to the fabled Shangri-La, a land of milk and honey in which there is no poverty. Yet, for that to happen, the statisticians have their work cut out to calculate the next release of the (official) CPI and bring it in substantially lower than 5.2%.
West Texas Intermediate crude. Daily close
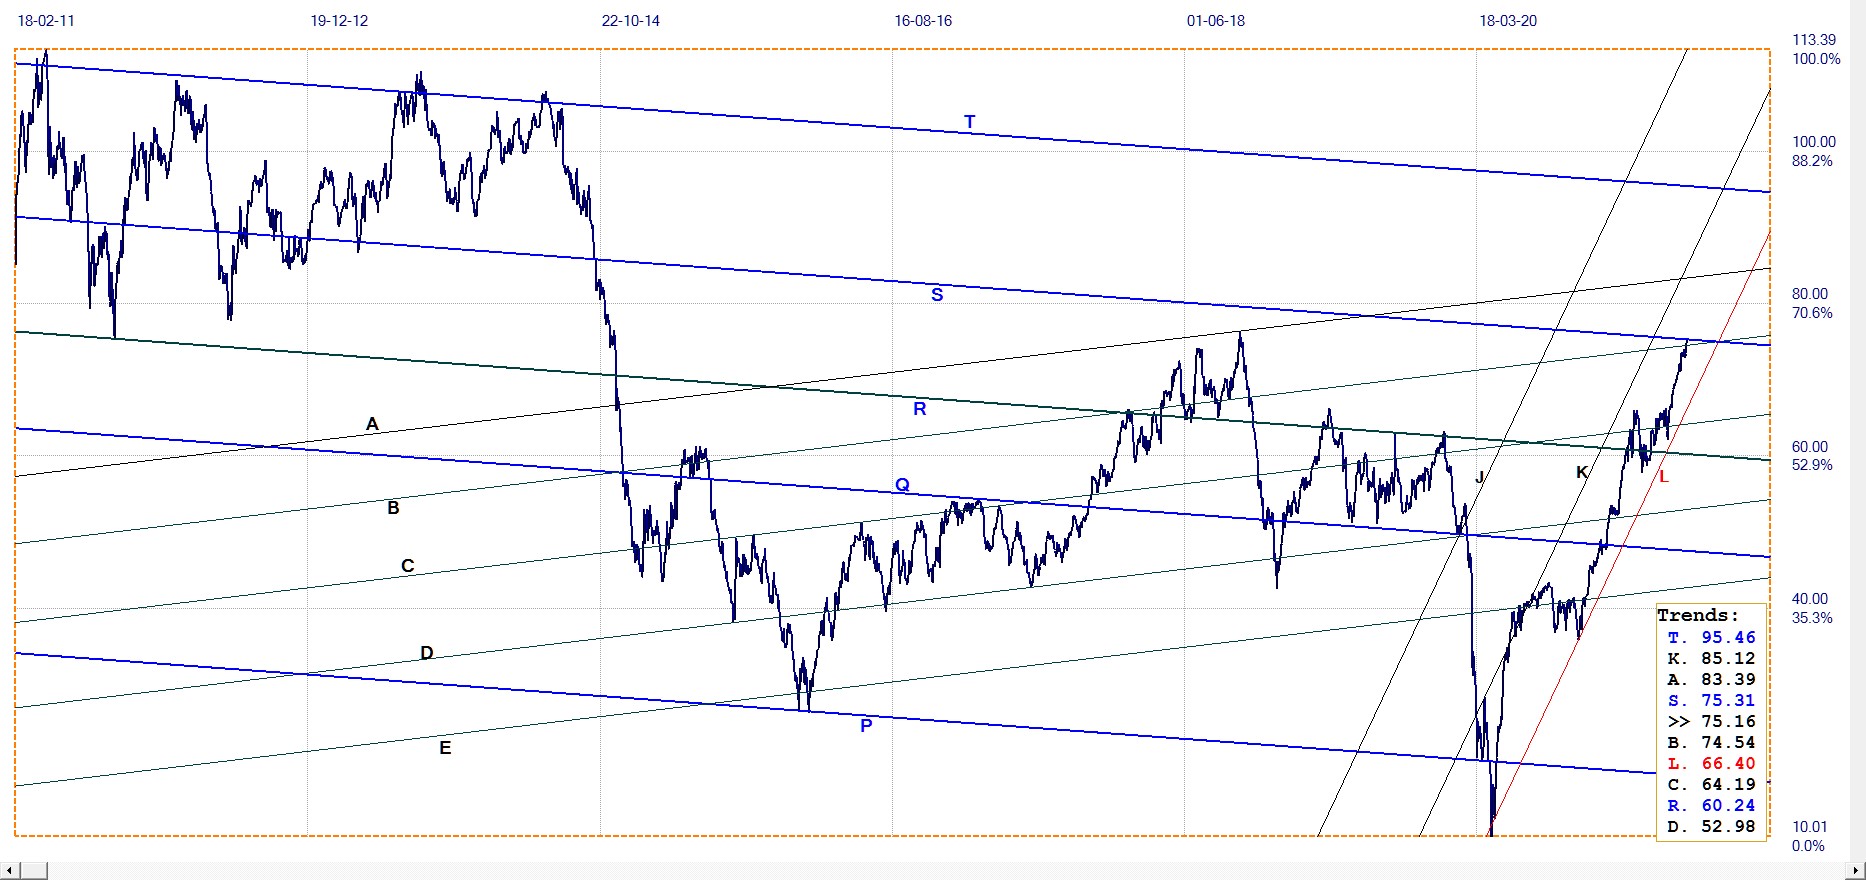
WTI crude – Daily close, last = $75.16 (www.investing.com )
It is always a pleasant surprise when a price reaches a support or resistance trend line that had existed for a long time in the analysis and either halts there or, better still, completes a reversal. Recognition by the price that an existing trend line on a chart identifies some level of significant support or resistance, offers evidence for the hypothesis that there is structure in market prices.
After a break through a trend line, it is no longer evident whether the price hesitated right at the line before continuing. Here we have the price of crude ending on Friday only 15c (0.2%) short of line S – well within the 0.5% limit that is used to determine whether there is a fit between the price and a trend line. The break through line B extends for 62c or 0.08%, to indicate a definite break. This week we should know if the bull trend is to continue or whether the inflationary effect of energy will diminish.
********
More from Gold-Eagle


