Stocks Drop 1,000 Points On Black Friday! Why And Now What?


The stock market had its worst day of the 2021 year, on Black Friday, November 26th, in half-day trading. It was the high momentum decline we have been watching for as evidence that "the" top is in for the stock market. The Industrials fell 1,000 points intraday, closing down 905. The S&P 500 closed down 106. The NASDAQ 100 lost 342, and the Russell 2000 gave up 85. Trannies got hit for 610.
U.S. Bonds responded with a nearly 3-point rise, Oil plunged 13 percent, and the VIX exploded higher by 50 percent - all in one day.
Last week we wrote in several of our subscriber newsletters, "If we are correct in our wave mapping, then the Industrials are on the precipice of dropping 2,000 to 3,000 points into year end, with far more downside potential in 2022." So far, the Industrials have dropped 1,800 points.
The stock market has declined sharply between November and March in nine of the past thirteen years (70 percent of the years). This is likely to occur again into early 2022.
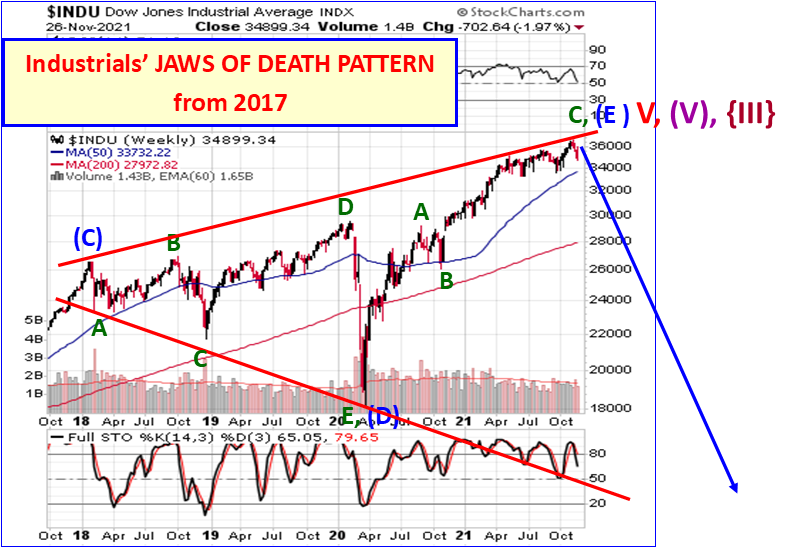
In the above chart we see a close-up of the final Megaphone topping pattern for the Dow Industrials, to conclude Grand Supercycle degree wave {III} up. Its completion is likely in, topping on November 8th, 2021 at its intraday high, 36,565, very near to our upside price target per the pattern, which we have been suggesting in our newsletters would occur around 36,500ish, the upper boundary. The closing high was also on November 8th, 2021, at 36,432, so our upside topping target was the precise half-way point between intraday and closing highs. Pretty good hit. The top also arrived the very first trading day after the November 6th (a Saturday, with markets closed) Major Bradley model turn date.
The Industrials have since declined sharply from this upside price target, and from the upper boundary line, through Friday, November 26th's intraday low.
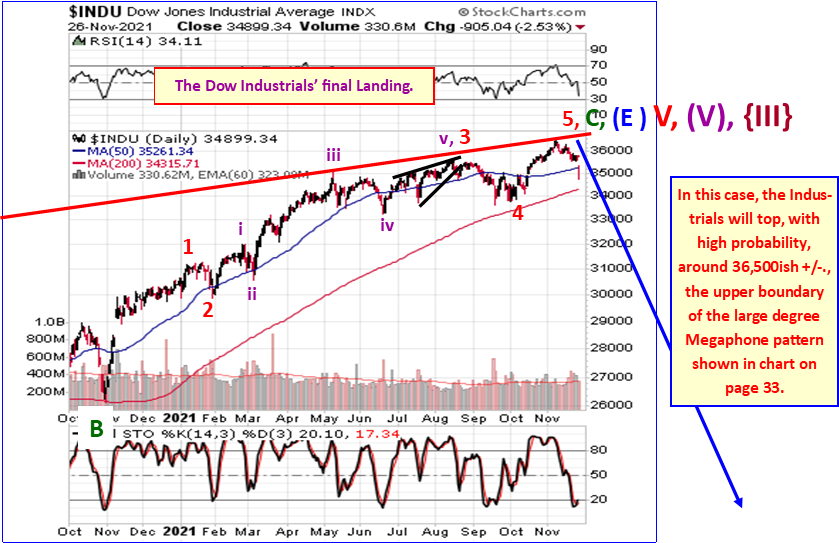
The upper, rising, boundary of Megaphone tops is almost always formidable resistance. That has once again proved to be the case.
This drop has occurred with three Hindenburg Omen potential stock market crash signals on the clock simultaneously. It is a rare and dangerous situation when there are three official H.O.s on the clock at the same time. Usually there is only one, maybe two at the same time. We have identified four prior occurrences over the past 35 years where there were three: First, there were three official H.O.'s on the clock from October 2019 through January 2020, all at the same time. A 37% stock market crash started about a month after the third H.O. occurred on January 30th, 2020. There was also an instance in 2018 when there were three “official” H.O.'s on the clock contemporaneously. That situation led to an 18.81% plunge in the stock market. There was another instance of three simultaneous H.O.'s on the clock in 2015, which led to a 14.79% stock market decline. In each instance, the declines started shortly after the third H.O. occurred. There was one other time in late 2014 when there were three on the clock together, the third occurring in January 2015, however the plunge that followed was five months after the third H.O., but was almost 15 percent. There were no other instances of three being simultaneously on the clock going back to 1986 from 2014.
We remain mindful that the stock market is entering a cycle period of time known as the Mars-Uranus Crash portion (last quarter) of the Mars-Uranus cycle. This is similar to the Hindenburg Omen in that not every stock market Mars-Uranus cycle includes a crash, but every crash has occurred during the receding portion of this cycle period, the most recent of which begins here in November 2021. This cycle potential crash period lasts several months, and extends into March 2022.
This stock market is set up for a Bear market that will include multiple plunges and crashes along the way. This set-up of finished Bearish patterns, completed Elliott Wave mappings, overbought conditions, overextended rallies, extreme positive sentiment, negative cycle occurrences, advance/decline line Bearish divergences, and Hindenburg Omens is one of the most ominous that I can recall in the 30 years I have been doing Technical Analysis stock market forecasting. This gets back to what Technical Analysis of Markets is all about. The stock market has a language of its own, and is telling us where it is headed next. Markets are the accumulation of all knowledge known on planet earth, which is built into pricing. That pricing forms patterns, and creates indicators that we can study to understand what the market is telling us about its future.
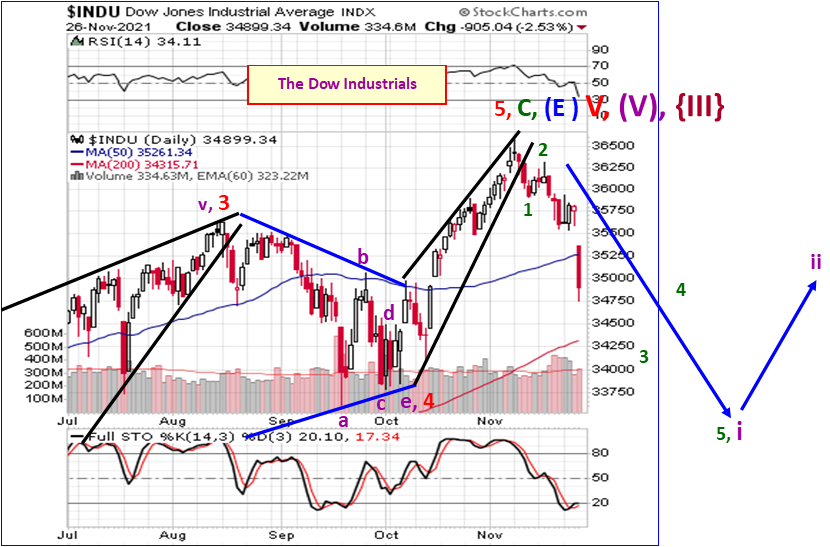
The stock market is headed lower. The short-term path for the Industrials is shown above, where they decline in stairstep fashion. The eventual wave ii bounce, perhaps coming in December, will provide the last opportunity for Bulls to get out whole, and for Bears to load up. Then it gets ugly for a long time. Wave threes down are the worst, most dramatic, loss periods for stocks, and should be here in early 2022.
At Dr. McHugh’s www.technicalindicatorindex.com we track the patterns and waves that make up large and short-term degree trends, and chart them in our forecast newsletters. We have developed several proprietary Buy/Sell indicators that help us identify when the next significant move is starting for the major Stock Indices, as well as for Gold, Silver and Mining stocks, in which direction the move will develop, with likely price targets. We publish these indicators in every Newsletter to subscribers. We offer education and real time trading to identify opportunities, and demonstrate how to trade markets up or down, based upon these indicators, patterns, and overbought / oversold conditions.
********
*********
More from Gold-Eagle


