A Strange Week It Really Was


A frequent comment here in US Markets over the past year and longer, I think, was that the the yield on the US 10-year Treasury note en die value of the dollar sought opposite trends. It quite seemed as if foreign holders of the US Treasury was being ‘protected’ from too low a price for the bonds in their own currencies. If the dollar weakened, the yields dipped lower, increasing the value of the bonds and when the dollar firmed, adding value to foreign dollar investments, the yield moved higher, to prevent a foreign investor from considering a sale of bonds to take profit. This has now changed, with the dollar in decline and the yield rising at the same time.
Should foreign investors perceive these changes over the past week or so as being new and perhaps sustained trends, the pressure will be on them to take profit while they still enjoy the good gains due to a strong dollar and low yields. By doing so, it means their actions are providing positive feedback to these trends; the dollar and the Treasury note to weaken further. Accelerated selling of Treasuries by foreigners and then repatriating the proceeds back home, will make the investors happy while they can make good profit, but it will be bad news for US markets.
As a kind of just deserts, should a strong performance of Wall Street these past few weeks be a contributing factor for weakness in the bond market – a sort of reverse flight away from safety – then the incentive to sell by foreign holders of Treasuries can be placed at the door of whoever is feeding funds into equities. As this probably is the known source of liquid funds in the US, namely the Federal Reserve, much of the benefit they gain from a strong Wall Street could be lost in the bond market.
The precious metals closed the week near their lows for the period, after some very volatile intra-day and also daily swings. Gold could not hold onto its marginal break above resistance of the week before and silver hardly moved at all. However, even with multiple waterfall attacks during every trading day, these metals are not losing ground to any significant extent. Whoever is fighting the rising trends is achieving a slowing down of the 2016 trend in their prices, but not the trend reversal that is the objective, or not yet! Given signs of strong buyers with deep pockets accumulating more long positions on every dip, it is beginning to look as if the new rising trends can be sustained and any more waterfall attacks will only make the situation for the short sellers so much worse.
WTI crude was bullish again of last week, to extend the rally that had started below $30 oil. The recent gain was though an ‘empty space’ on the chart, with no need to overcome known technical resistance on the way to the next resistance around $39. This coming week will reveal whether the new bullish trend in crude is fundamentally soundly based, or whether the price has been levitated to persuade equity bulls to return to Wall Street. The overhang of supply and agreement to cut production do not appear to have been resolved as yet – still more of a bearish climate for crude.
Last week things were quite strange in some markets; perhaps this week we can look out for some more excitement, rather than more conundrums! Silver and gold can surely do with more of the same since early 2016!
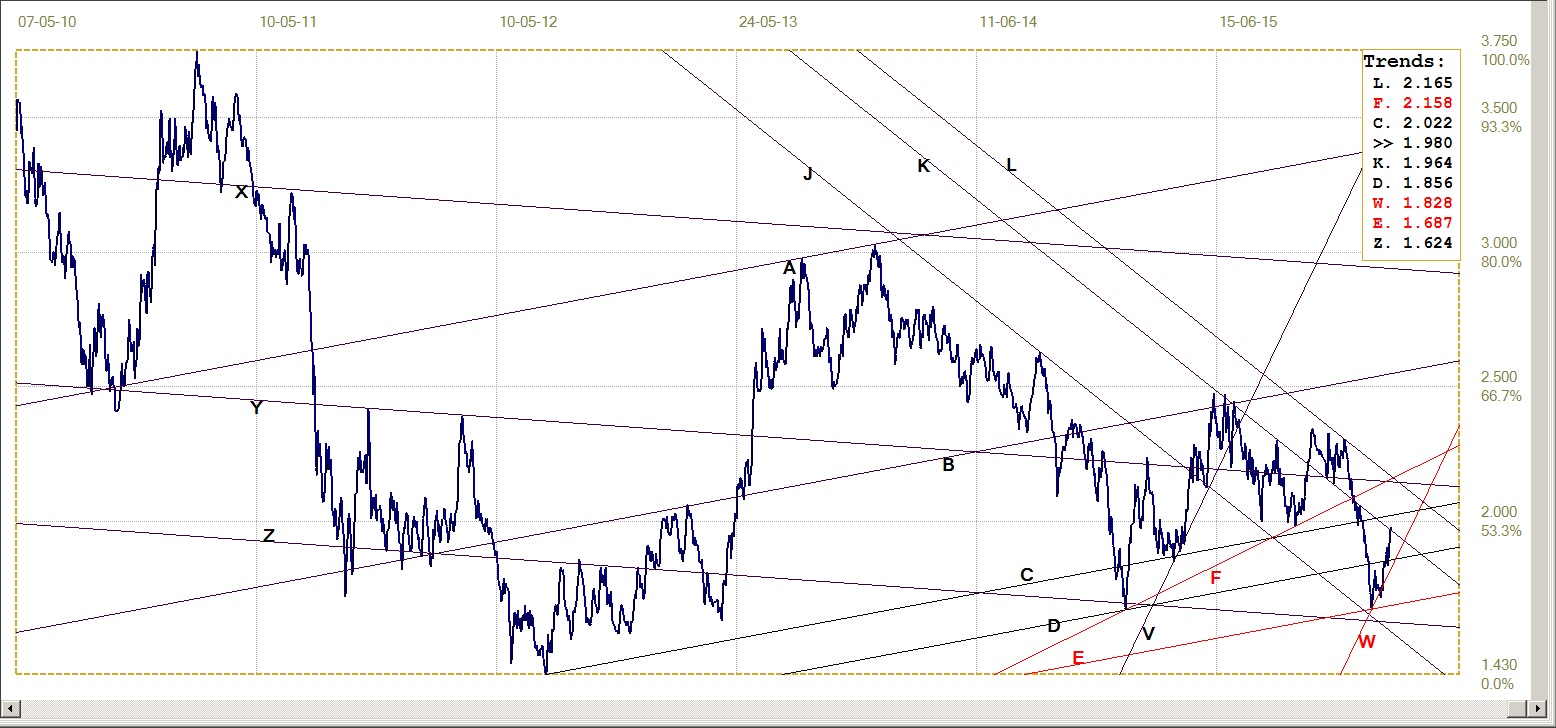
Euro-Dollar Chart
The last gasp dollar rally (?) of some weeks ago had the euro struggling to remain hold key support at the bottom of channel KL now at $1.0902. The support id hold, and the euro started its own rally in response, again breaking cleanly through the resistance at line Q ($1.1094), to present a more positive picture. Given the degree of volatility and turbulence that came with 2016, anything can still happen.
There are more than enough potential flash points around the globe to trigger really major changes in the markets and it is either the optimist or the fool who will lay a large bet that a given trend will hold without a sharp correction.
In Europe they are still facing a major crisis with the inflow of migrants. There is an immediate problem in caring for these people, but the bigger threat in some countries is similar political turnovers that Greece had experienced when the population turned to a radical new party as a revolution against austerity. Now the threat is new widespread support for a party with a clear policy of that they actually intend to reverse all immigration that has occurred.
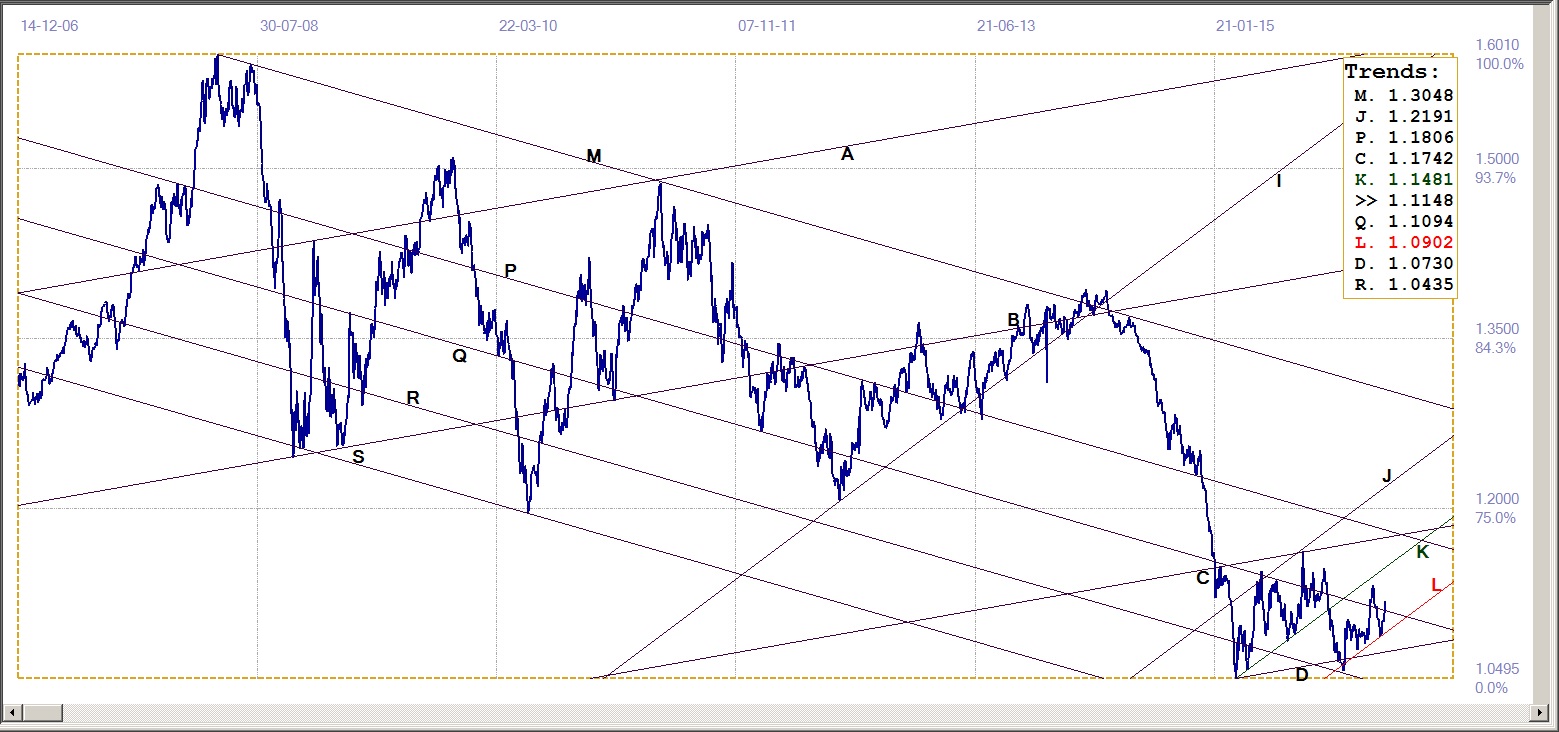
Euro-dollar, last = $1.1148 (www.investing.com)
Dow Jones Industrial Average (DJIA)
Apologies; somehow last week discussion of the DJIA chart deserted the document after writing it was done and before being sent off to its destination! It was not an error in converting it for HTML publication.
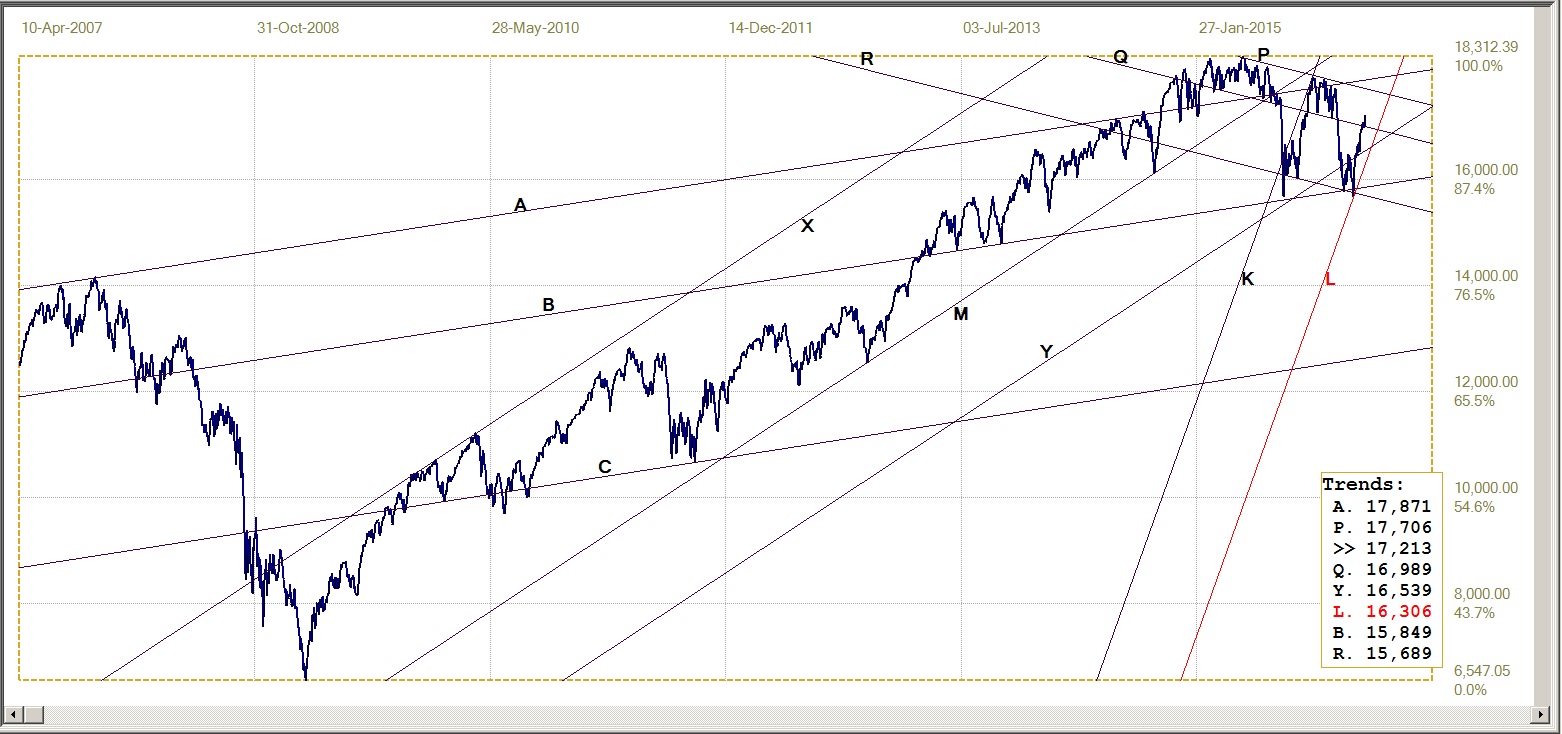
Dow Jones Industrial Index, last = 17213 (money.cnn.com)
Here, too, is an example of mystical levitation in a market. The DJIA looked bearish – having broken marginally below key support – then took off with only the minor correction to give the goodbye kiss on breaking back into main bull channel MY, at line Y (16539). It did the same at line Q (16689) and streaked higher above the 17 000 target that was an objective earlier the week.
The question really is between acceptance of three points of view: do large players in the market that can affect the trend believe official expressions of a healthy and sound economy still in its growing phase, or are they playing ‘last man standing’ to see who can eke out the last and final profit before the market follows the economy down the drain? Thirdly, has an army of small investor on Main Street suddenly had a revelation that a 20+ GAAP compliant PE represent a major buying opportunity?
It is doubtful that large players without a death wish will try for ‘last man standing’ given the high recent volatility and the other two options really are too ridiculous to even consider. Which implies the force behind the strong DJIA can only be the one that also kept the dollar relatively strong despite the massive QE programs and that could be behind the resurgence in the price of crude, despite horrid fundamentals.
A next question is whether a unique achievement in history is to be achieved, that a market can be protected indefinitely when fundamentals support an opposite trend. Of course, the fact that the media contributes daily to sustain a facade of growth in the economy is a key factor in the success that has been achieved in this respect – so far. Will it again be, as happened after 2007/8, that the chorus will be, “Nobody could see it coming?”
Gold PM Fix - Dollars
Nothing much to say, really. That is, if one has been watching gold over the recent past; first it was one day up and two or three days down; now in 2016 it changed to 1 day up very nicely, and two days sideways with volatility as the new bulls hang on to the gains in price – and their new long positions – while the reactionary forces try to induce their so familiar price plunges that last a week or longer. This time not with any great success, except a delaying rear guard action.
The gold open interest on Comex is at new highs. And the way the market is acting, this number seems set to increase further – with a prospect of severe financial pain for the shorts if the trend should continue higher. They have been accumulating the shot position consistently over the past $200+ rising trend, with new resistance in play to provide a bit of relief. However, while buying some time, the sideways trend is no resolution of the fact that a resumption of the bull trend will not only cause a lot of pain, but in time will unmask their behaviour to the world at large. This week the resistance at line C($1271) and then at line Q ($1306) will be levels to watch closely, should the rising trend continue this soon.
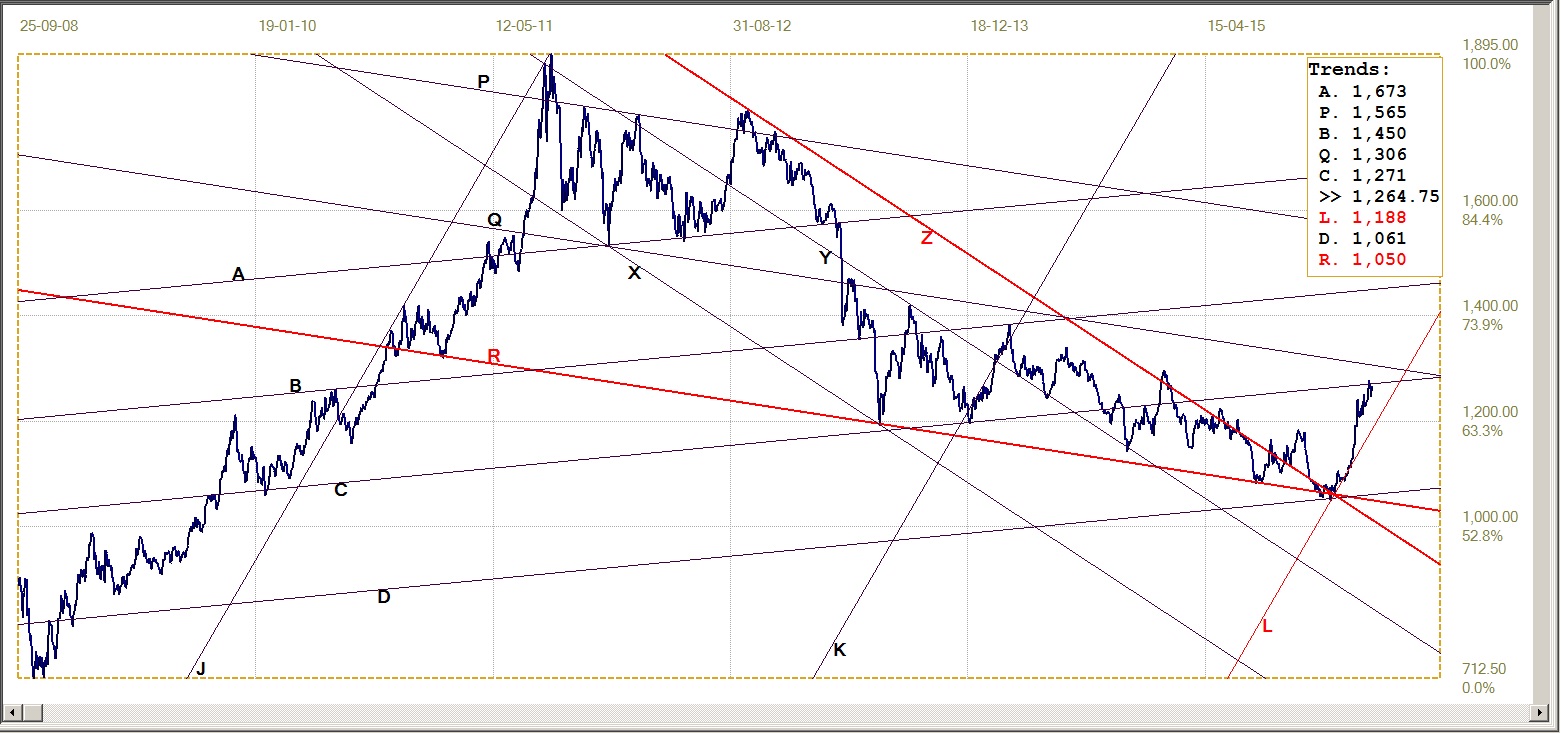
Gold price – London PM fix, last = $1264.75 (www.kitco.com)
Gold PM Fix - Euro
The euro has been quite volatile recently as the dollar tried to reassert dominance, however not with lasting success. The stronger euro last week took its toll on the euro price of gold to end the nearly straight rally that had started below triangle AS – the fact that the gold price was limited in its gains contributed to this correction. A move higher, to break above the resistance at lines R (€1180) and W (€1182), is dependent on the improvement in the price of gold to outstrip the rate at which the euro outperforms the dollar, should that trend continue as anticipated.
Given that Draghi seems intent on having the euro be a winner among currencies in their race to the bottom, euro gold may well have an ally at the ECB. The migrants, too, could offer indirect and unintended assistance to the euro price of gold.
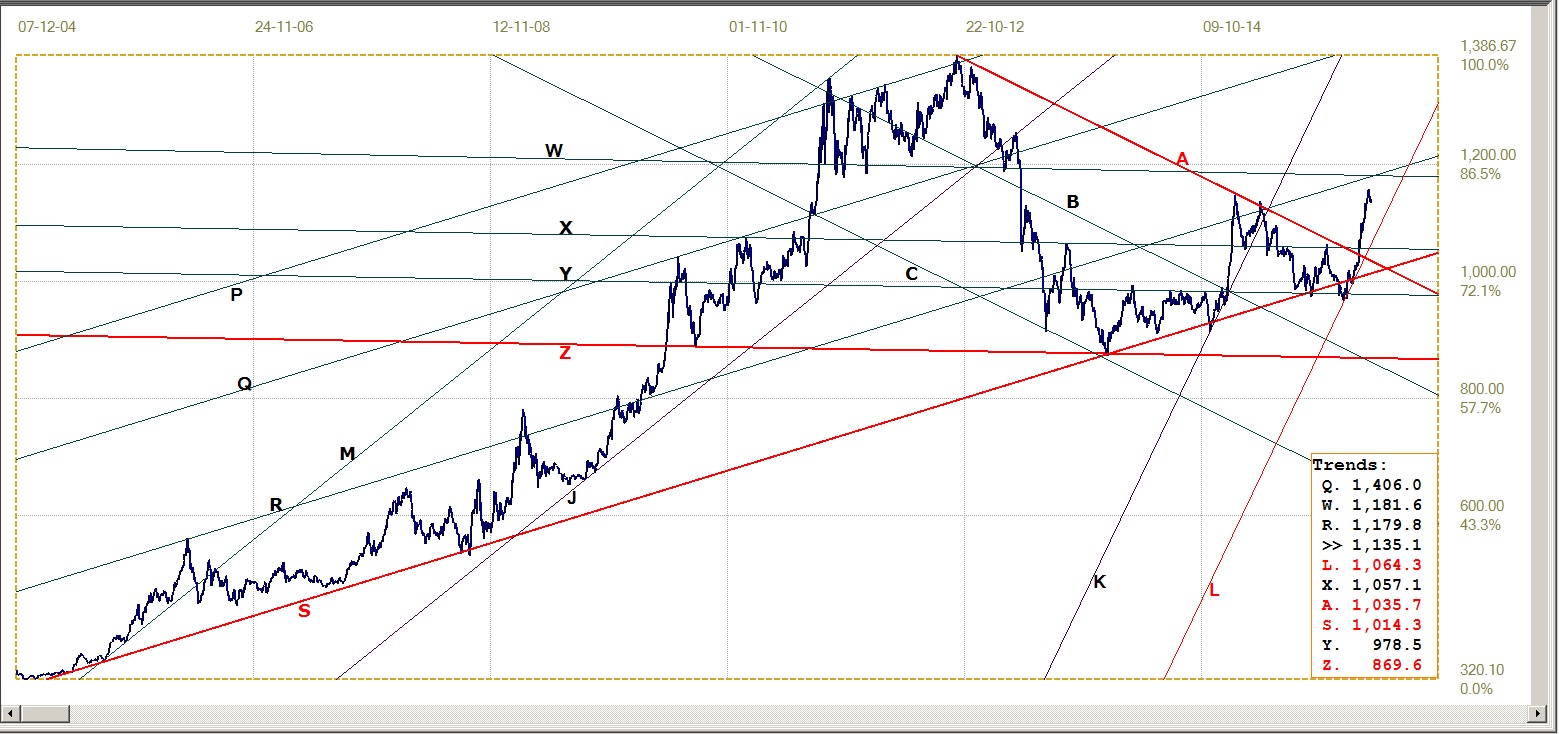
Euro gold price – PM fix in Euro, last = €1135.1 (www.kitco.com)
Silver Daily Fix Chart
It might be a strange way of putting it about the shiny metal, but silver happens to be the dark horse among the markets that are discussed here. As often mentioned in these pages, evidence suggests that silver experiences strong repressive forces, more so than gold. There has to be reasons for this disregard of its fundamentals in terms of supply and demand, factors that are further distorted by the very low price to which silver has been subjected with sustained paper pressure through Comex.
The over-worked comparison to a large ball being pushed under water nevertheless applies; the pressure surely cannot be applied indefinitely when, as seems the case, someone, using some means, keeps on inflating the submerged ball to make it a lot larger and more difficult to control!
Recently, but not without exceptions, silver has shown greater resilience than gold. It held onto its gains much better and when a really bad hammering pushes the price below its levels of comfort, the recovery is quick and sustained.
For some time quite recently, the usual intraday volatility in silver steadied and the price often spent time in a near sideways drift. This past week saw signs showing that silver is waking up again. This may well be a warning that the market climate is changing again and this could be bad news for the shorts.
A re-evaluation of the bull channel JKL ($15.46) now has line L acting as support for the new rally, including the brief correction. The channel ratio is 502:498, very close to the ideal 500:500 of an evenly divided channel.
The recent delicate hold of the price to this support is a motive for the re-alignment of the channel lines. It remains to be seen if this new analysis can stand the test of time, but so far silver is maintaining it rising trend, just above the new support.
Silver daily fix, last = $15.50 (www.kitco.com)
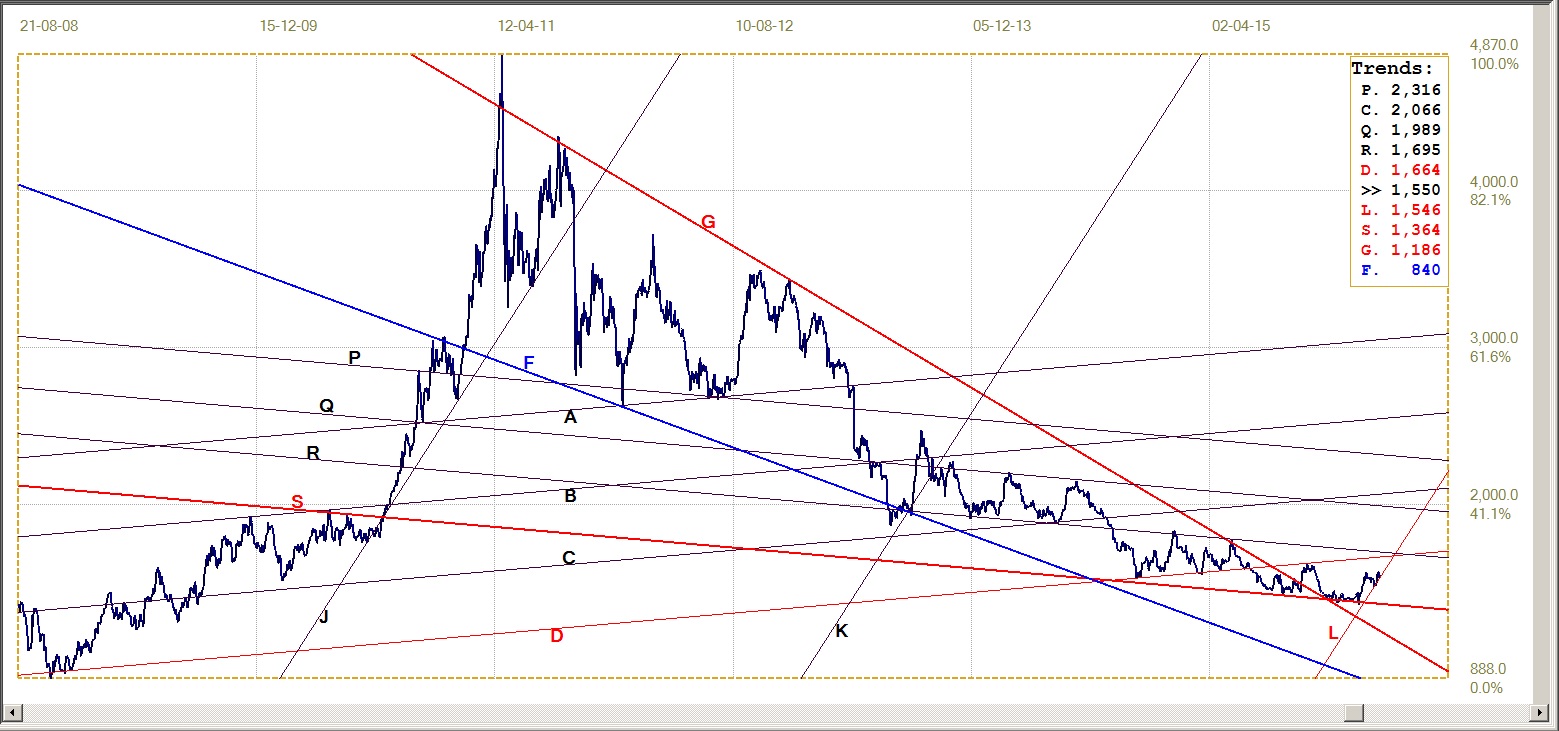
US 10-year Treasury Note
It was mentioned in the introduction that recent behaviour by the US dollar and the bond market broke with what has been the observed relationship between the two markets. With the dollar turning weaker, both against the euro and in terms of the US dollar index, expectations would have been that the yield on the widely traded 10-year Treasury note would retreat lower to compensate foreign holders for a loss in the value of their investment in local currency.
These past few weeks this did not happen. As the chart shows, the yield on the 10-year moved right up after breaking clear above market support at line D (1.856%) to extend the bear trend higher in steep bear channel VW (1.828%). As noted, this is a new and rare situation, where the foreign view of the us 10-year Treasury has turned bearish. It is not known whether this is weakness is the result of increased selling by foreign holders, or whether there is increased domestic selling of longer term Treasuries now that these are no longer needed as a safe haven to cover for exposure to equities and other markets.
On Friday, the close was marginally above the market support of the bull channel, JK (1.964%). If the break holds and extends higher, he market support at line C (2.022%) may come into play – higher than the psychological 2% level that quite often acted as key market resistance on the way down.
There will be the true test of the resilience or not of the bond market. A clean break above 2% will be a strong bear signal and attract much local profit taking while the profit is still good, and also affect foreign holders of Treasuries irrespective of their local currencies in relation to the dollar.
US 10-year Treasury note, last = 1.980% (www.investing.com)
West Texas Intermediate crude. Daily close
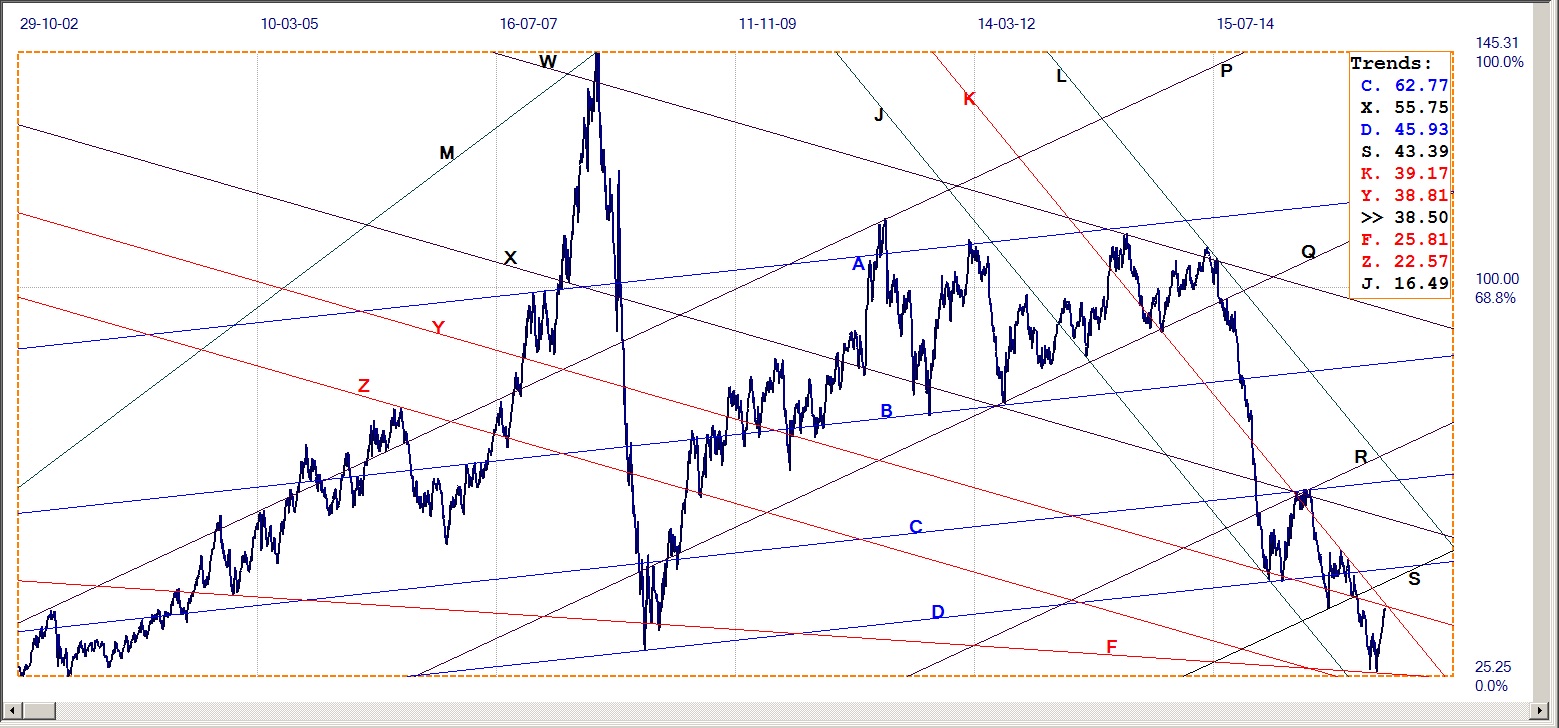
WTI crude – Daily close, last = $38.50 (Investing.com)
It is interesting to read comments about the reasons for the improving price of WTI crude: the IEA sees signs of the price bottoming out – but that is only after a 40+% increase since the recent low!! Wow! – reports of producer talks about limiting the extraction of oil, some reported outages in a few troubled producer countries, talk of Non-OPEC reductions in supply, expectations of increased demand and a weaker US dollar.
Rumours, reports of talks, hopes for growth in demand (this while China is reported to have reduced exports by 25% YoY!) and a weaker dollar – of which this perhaps is the only definite fact among the lot. Oh, yes, and Iran’s contribution to supply is to be off-set by reductions in US shale and other production! This all sounds so very similar to the media coverage of official prognostications of growth in the economy!
One must wonder whether there is any real substance behind all the hot air when it comes to the prospects for the price of crude; much hot air, designed to conceal the fact that at least part of the suddenly improved performance can be explained by a similar levitating force as we are accustomed to see at work on Wall Street!
©2016 daan joubert, Rights Reserved
chartsym (at) gmail(dot)com
More from Gold-Eagle


