Technical Analysis Of Major Markets
 share
share
 share
share
 share
share
 share
share
 share
share
GOLD
Markets are very quiet ahead of the FOMC decision.
Gold dipped to 1101.50 in the overnight session, before recovering.
We indicated in yesterday's End of Day that we were NOT sure that the correction from the 1108.80 high was complete at the 1102.60 low.
The 61.8% retracement of the bigger rally from 1097.80 to 1108.80 is 1102.00.
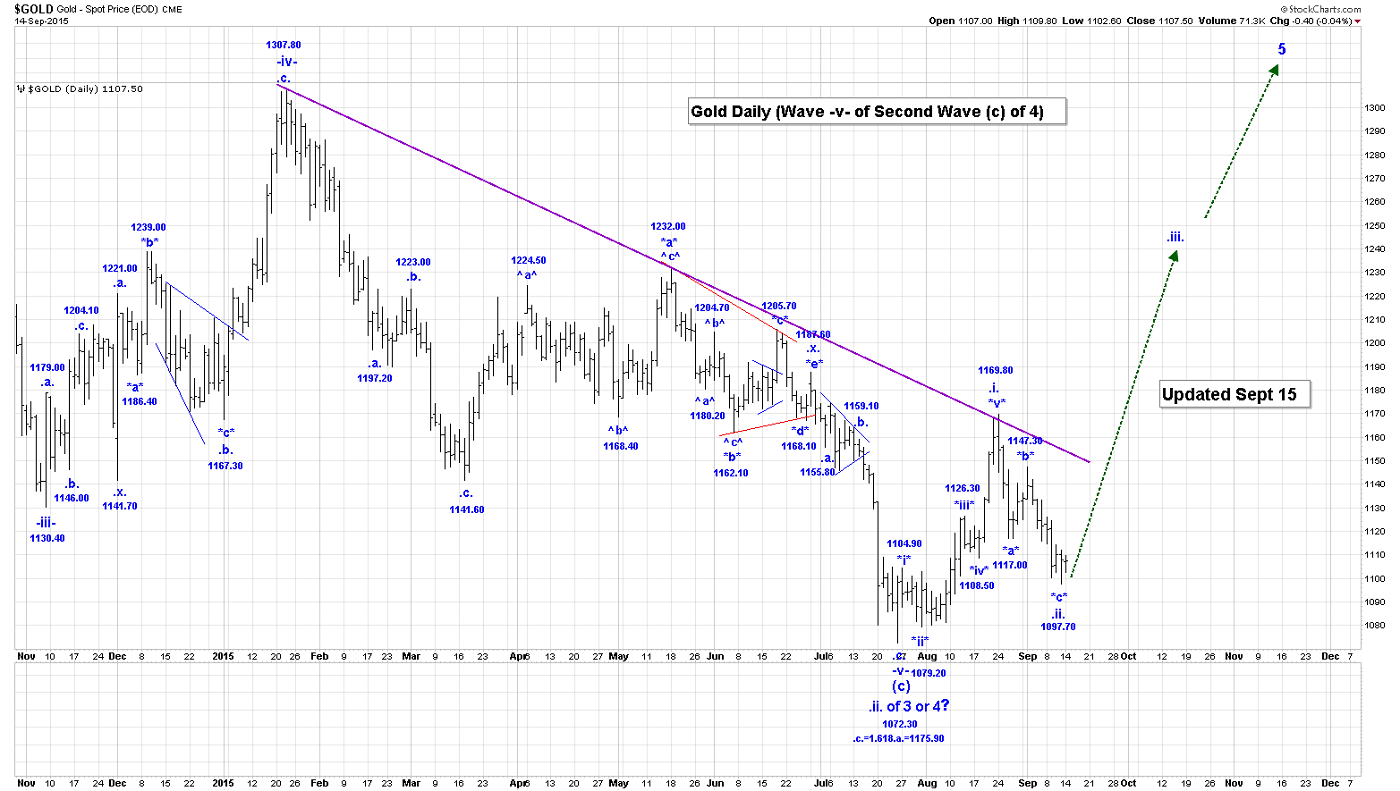
With all Ewave analysis considered, we believe gold should start to rally higher form here in wave .iii.
Once we confirm that all of wave .ii. is complete at the 1097.80 low, we will provide our key projections for the end of wave .iii.
Our current wave .ii. count looks like:
*a* = 1117.00;
*b* = 1147.30;
*c* = 1097.80, to complete all of wave .ii.
We are long 20 positions, risking to 1072!
CRUDE OIL
Crude was basically unchanged in the overnight session.
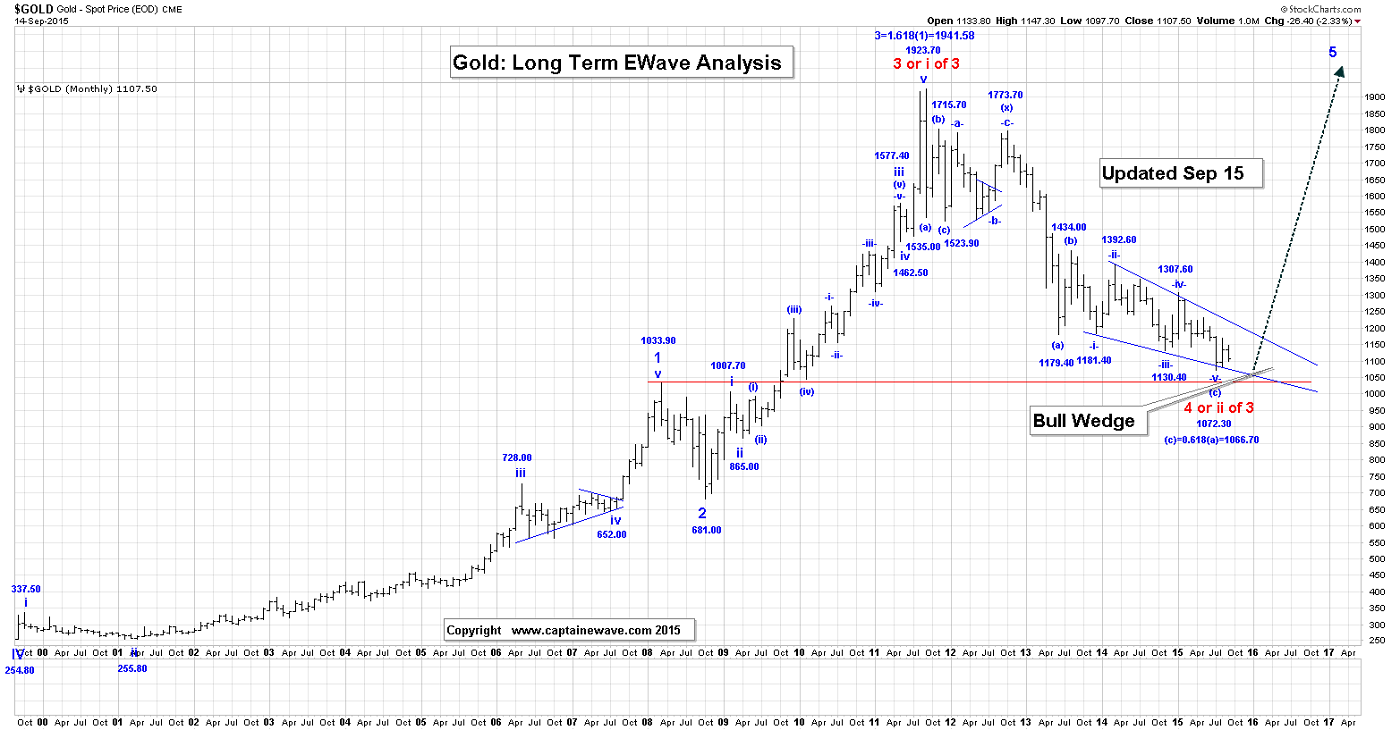
In our last End of Day Post we talked about a potential triangle in the wave ^b^ of *ii* position.
If that analysis is correct, then the current rally in crude would be wave !e! of that triangle formation.
Our current analysis of wave *ii* looks like:
^a^ = 43.21;
^b^ triangle:
!a! = 48.42;
!b! = 43.39;
!c! = 46.04;
!d! = 43.60, if complete;
!e! rally to complete all of the wave ^b^ triangle.
Wave !e! cannot rally above the wave !c! high of 46.04, for this triangle option to remain valid.
^c^ drop to go, to at least the wave ^a^ low of 43.21.
Our wave *ii* retracement levels are:
50% = 43.53;
61.8% = 42.17.
We plan to go long 8 positions at 42.50, and buy 42.00 puts, as stops!
S&P500
The S&P Futures are up about 1.5 points at the time that this Post was being written.
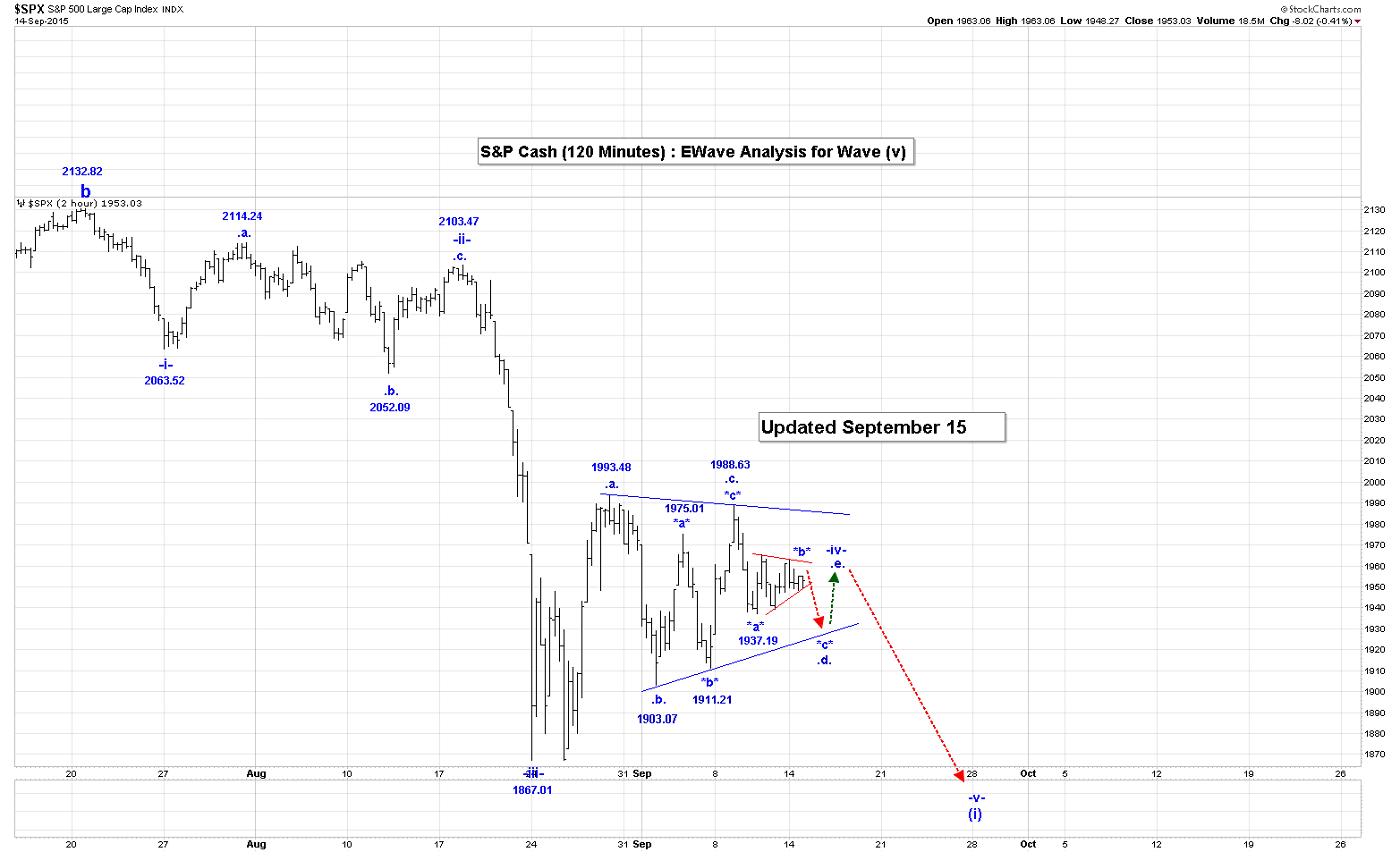
We still appear to be working on the internal corrective wave structure of wave .d..
As the attached 120 Min Chart indicates, we could be working on the following internal wave structure for wave .d.:
*a* = 1937.19;
*b* triangle rally is now;
*c* drop to complete all of wave .d.
Wave .d. cannot drop below the wave .b. low of 1911.21, for this triangle formation to remain valid.
Upon completion of the wave -iv- triangle, we should expect a very sharp thrust lower in the S&P.
That has a minimum target of the wave -iii- low 1867.01.
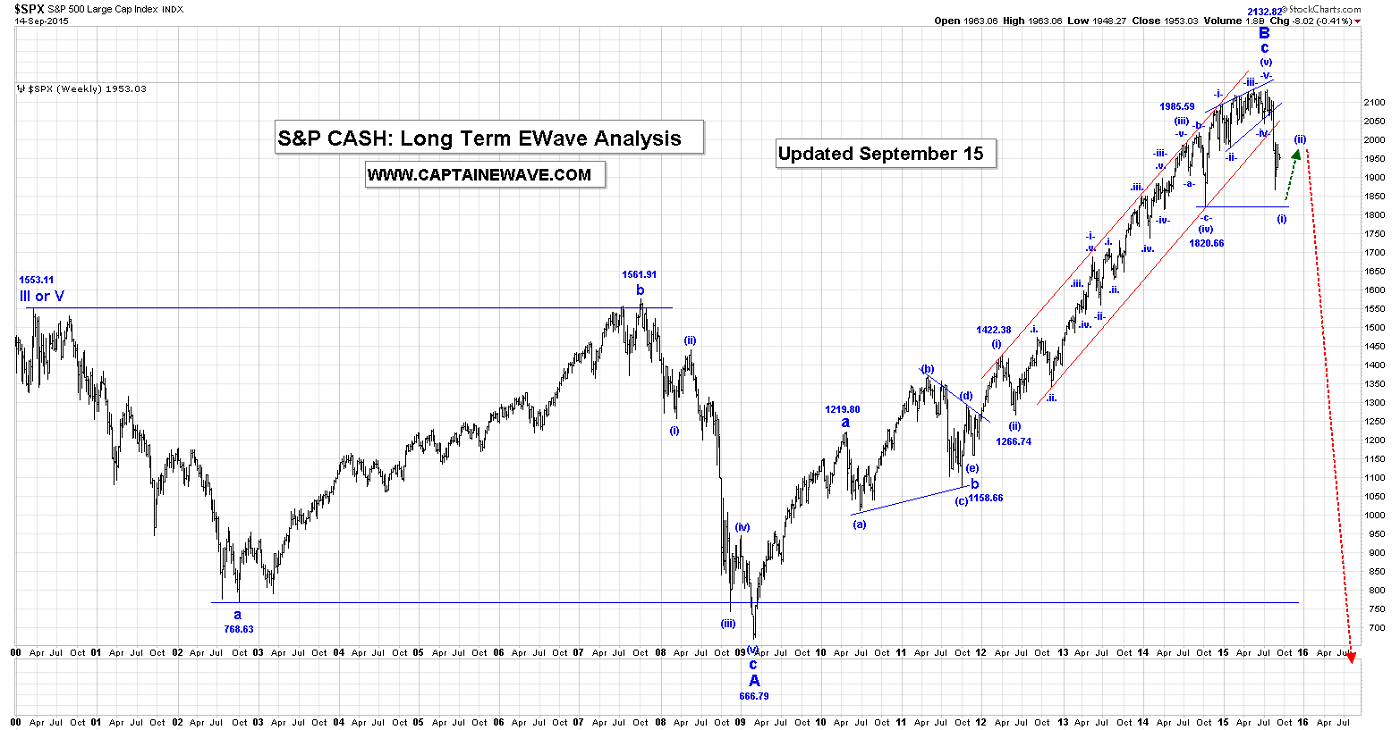
We plan the take profits at the end of wave -v-, as this final drop should complete an initial impulsive sequence that started at the major top of 2132.82.
We are short 10 positions, with 1975 calls!
USDX
Like the S&P, the USDX was also pretty much unchanged in the overnight session.
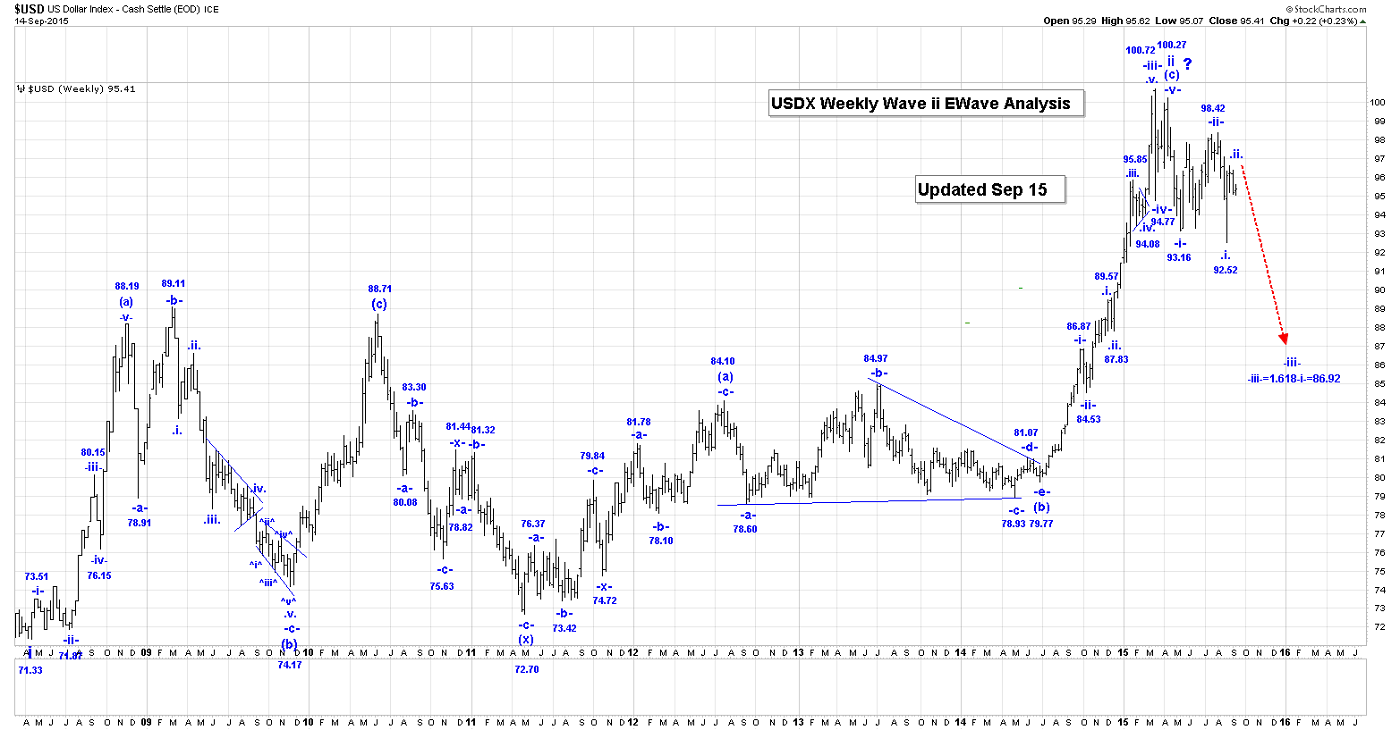
Our updated count is:
.i. = 93.17;
.ii. = 98.41;
.iii.:
*i* = 92.54;
*ii* = 96.59, if complete. The 78.6% retracement of wave *ii* is 97.15.
*iii*:
^i^ = 95.73;
^ii^ = 96.42;
^iii^ = 95.11;
^iv^ = 95.62, if complete; Wave ^iv^ could also be becoming a bearish triangle.
^v^ drop to go.
We still expect the USDX to continue to move lower.
We are short 5 positions, risking to 98.42!
NATGAS
NG moved higher in the overnight session reaching 2.791, at the time that this Post was being written.
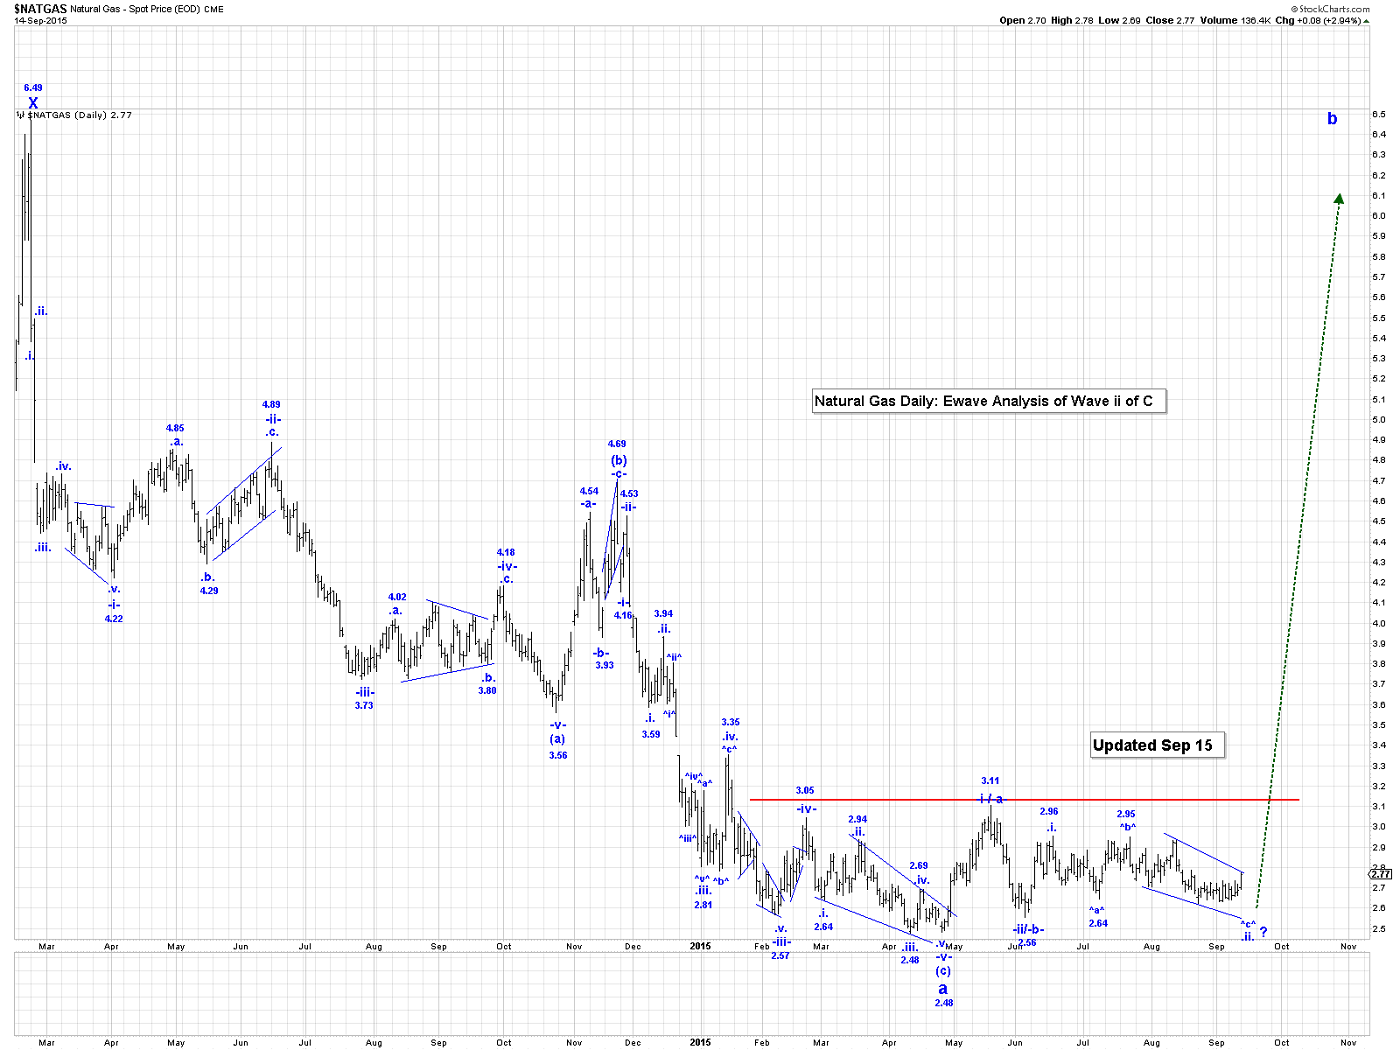
We are thinking that this current rally is part of a wave ^c^ diagonal triangle.
For this analysis to remain valid, we would not want NG to rally very much higher, as the shape of the diagonal triangle would start make us question whether it is the correct interpretation of what this market is doing.
For the time being we will maintain our current analysis position, but NG needs to turn down very soon. It needs to turn down also, so we can buy our long positions. We are expecting a dramatic move to the upside once the triangle is resolved. This should help the CRB index move higher, and that’s good news for gold!
Our current count for the beginning of our second wave b is:
-i- or -a- = 3.11;
-ii- or -b- = 2.56;
-iii- or -c-:
.i = 2.96;
.ii. is still underway, and we need to see one more drop to the 2.62 low to complete all of wave .ii.
Buy 5 positions at 2.61, risking to 2.47!
EURO
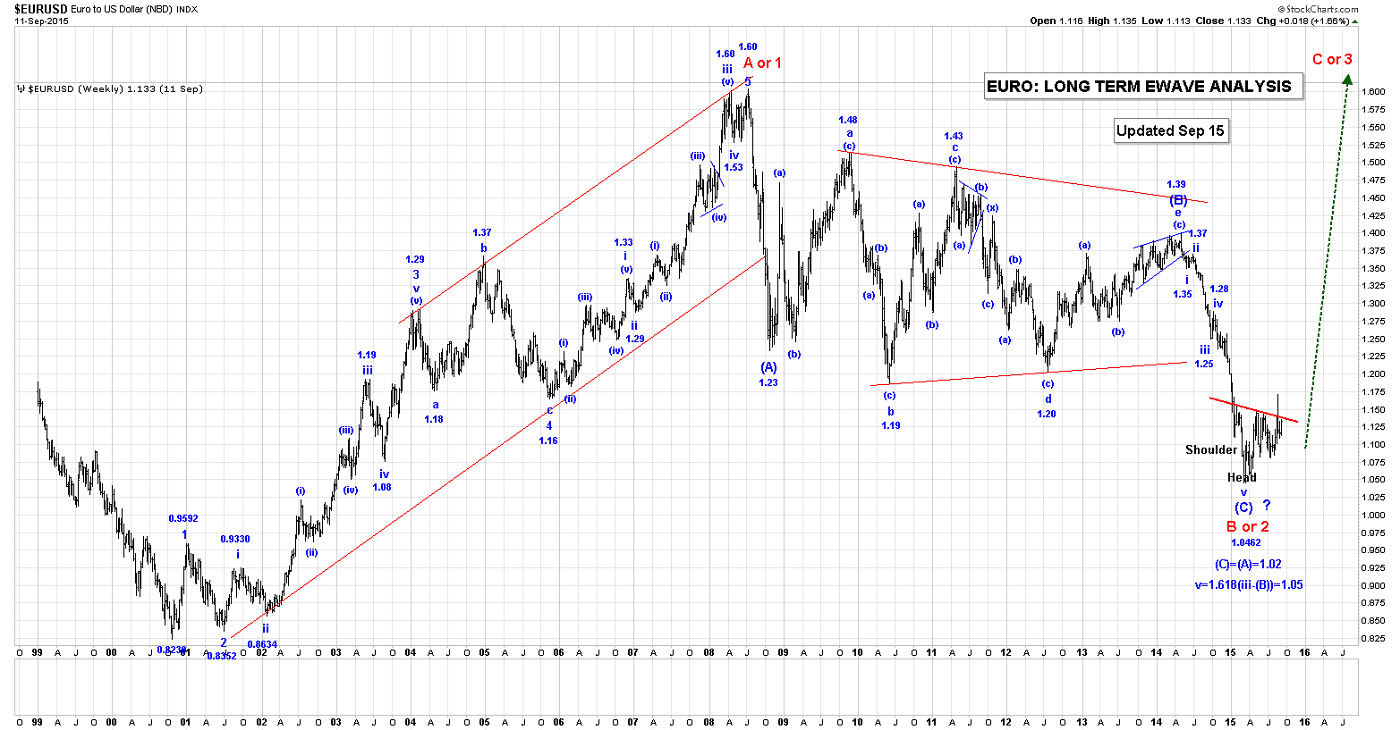
The euro continues to carve out the inverse H&S bottom pattern that we believe will launch the massive C wave to the upside. That’s more good news for gold!
FXI

We believe the Chinese stock market has considerable downside. This should also move money into gold as the rally in the stock market fails.
HUI/GDX
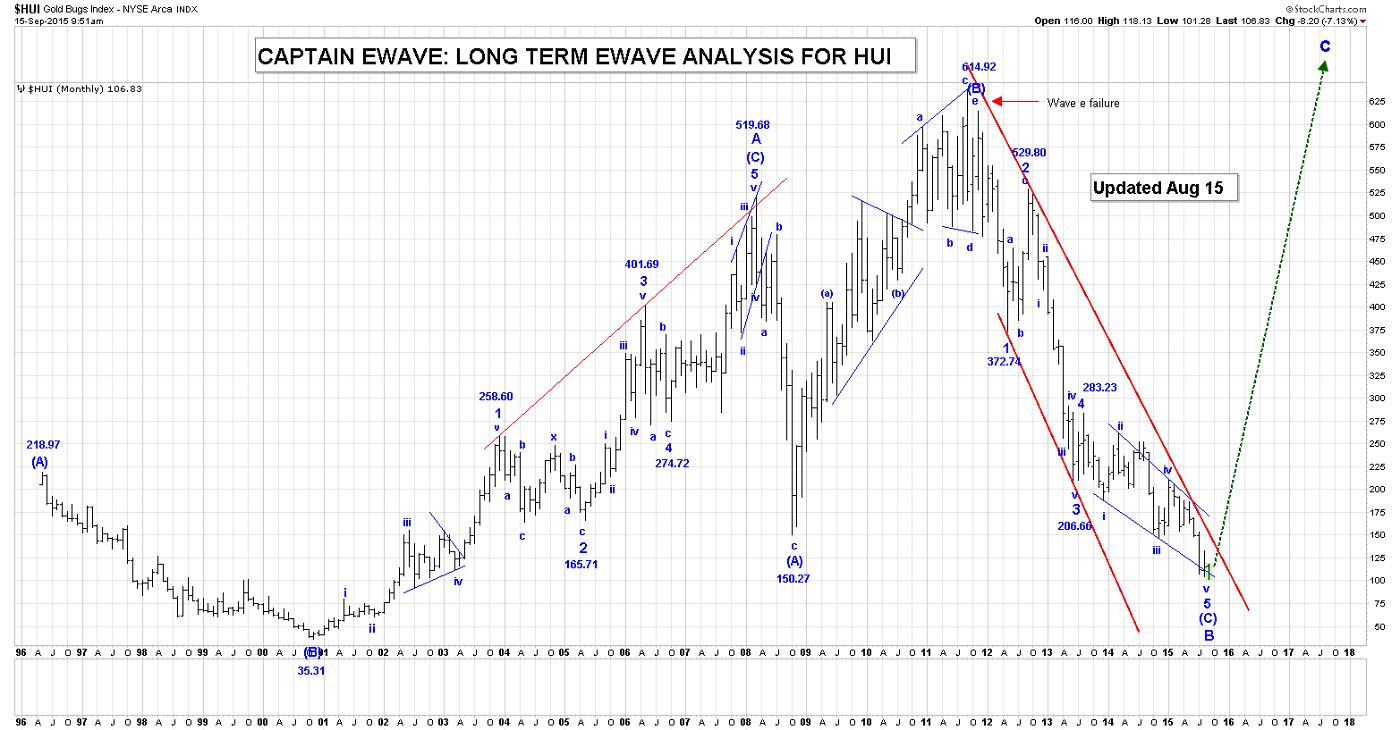
The HUI index has yet to break out of its downtrend channel and begin its dramatic C wave to the upside. We believe that event is coming very soon, and so:
We are long the GDX, ABX, KGC, NEM, CRJ, and TSX:XGD with no stops!
CLAUDE RESOURCES
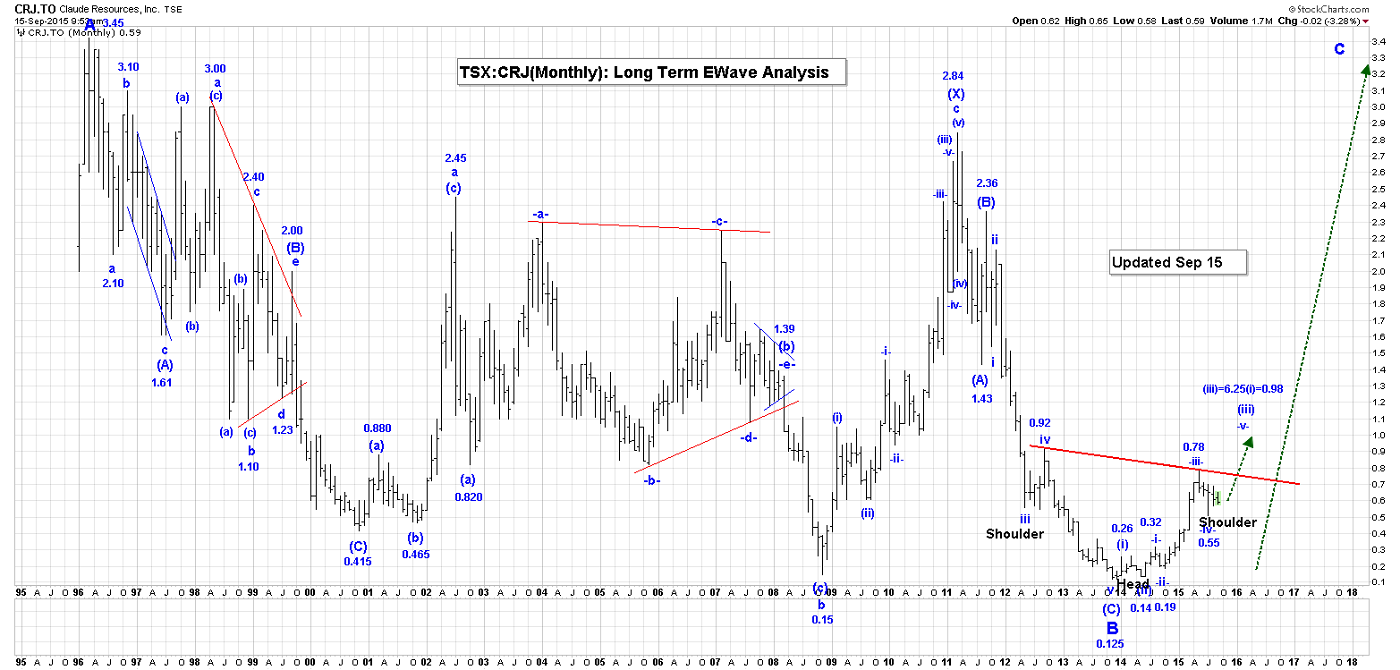
Claude is our bell weather gold stock. With superb management, the inverse H&S bottom pattern that we highlighted a week ago is fully intact, and ready for an upside breakout that should launch a dramatic C wave advance, ultimately to new highs. Patience is required, and it will be rewarded!
********
Email: [email protected]
Website: www.captainewave.com
Risk: CAPTAINEWAVE.COM IS AN IMPERSONAL ADVISORY SERVICE. AND THEREFORE, NO CONSIDERATION CAN OR IS MADE TOWARD YOUR FINANCIAL CIRCUMSTANCES. ALL MATERIAL PRESENTED WITHIN CAPTAINEWAVE.COM IS NOT TO BE REGARDED AS INVESTMENT ADVICE, BUT FOR GENERAL INFORMATIONAL PURPOSES ONLY. TRADING STOCKS DOES INVOLVE RISK, SO CAUTION MUST ALWAYS BE UTILIZED. WE CANNOT GUARANTEE PROFITS OR FREEDOM FROM LOSS. YOU ASSUME THE ENTIRE COST AND RISK OF ANY TRADING YOU CHOOSE TO UNDERTAKE. YOU ALSO AGREE TO BEAR COMPLETE RESPONSIBILITY FOR YOUR INVESTMENT RESEARCH AND DECISIONS AND ACKNOWLEDGE THAT CAPTAINEWAVE.COM HAS NOT AND WILL NOT MAKE ANY SPECIFIC RECOMMENDATIONS OR GIVE ADVICE TO YOU OR ANY OF ITS CLIENTS UPON WHICH THEY SHOULD RELY. CAPTAINEWAVE.COM SUGGESTS THAT THE CLIENT/MEMBER TEST ALL INFORMATION AND TRADING METHODOLOGIES PROVIDED AT OUR SITE THROUGH PAPER TRADING OR SOME OTHER FORM OF TESTING. CAPTAINEWAVE.COM, ITS OWNERS, OR ITS REPRESENTATIVES ARE NOT REGISTERED AS SECURITIES BROKER-DEALERS OR INVESTMENT ADVISORS EITHER WITH THE U.S. SECURITIES AND EXCHANGE COMMISSION OR WITH ANY STATE SECURITIES REGULATORY AUTHORITY. WE RECOMMEND CONSULTING WITH A REGISTERED INVESTMENT ADVISOR, BROKER-DEALER, AND/OR FINANCIAL ADVISOR. IF YOU CHOOSE TO INVEST WITH OR WITHOUT SEEKING ADVICE FROM SUCH AN ADVISOR OR ENTITY, THEN ANY CONSEQUENCES RESULTING FROM YOUR INVESTMENTS ARE YOUR SOLE RESPONSIBILITY.
ALL INFORMATION POSTED IS BELIEVED TO COME FROM RELIABLE SOURCES. CAPTAINEWAVE.COM DOES NOT WARRANT THE ACCURACY, CORRECTNESS, OR COMPLETENESS OF INFORMATION AVAILABLE FROM ITS SERVICE AND THEREFORE WILL NOT BE LIABLE FOR ANY LOSS INCURRED. DUE TO THE ELECTRONIC NATURE OF THE INTERNET, THE CAPTAINEWAVE.COM WEBSITE, ITS E-MAIL & DISTRIBUTION SERVICES AND ANY OTHER SUCH "ALERTS" COULD FAIL AT ANY GIVEN TIME. CAPTAINEWAVE.COM WILL NOT BE RESPONSIBLE FOR UNAVAILABILITY OF USE OF ITS WEBSITE, NOR UNDELIVERED E-MAILS, OR "ALERTS" DUE TO INTERNET BANDWIDTH PROBLEMS, EQUIPMENT FAILURE, OR ACTS OF GOD. CAPTAINEWAVE.COM DOES NOT WARRANT THAT THE TRANSMISSION OF E-MAILS, OR ANY "ALERT" WILL BE UNINTERRUPTED OR ERROR-FREE. CAPTAINEWAVE.COM WILL NOT BE LIABLE FOR THE ACTS OR OMISSIONS OF ANY THIRD PARTY WITH REGARDS TO CAPTAINEWAVE.COM DELAY OR NON-DELIVERY OF THE CAPTAINEWAVE.COM NIGHTLY EMAILS OR "ALERTS". FURTHER, WE DO NOT RECEIVE ANY FORM OF PAYMENT OR OTHER COMPENSATION FOR PUBLISHING INFORMATION, NEWS, RESEARCH OR ANY OTHER MATERIAL CONCERNING ANY SECURITIES ON OUR SITE OR PUBLISH ANY INFORMATION ON OUR SITE THAT IS INTENDED TO AFFECT OR INFLUENCE THE VALUE OF SECURITIES.
THERE IS NO GUARANTEE PAST PERFORMANCE WILL BE INDICATIVE OF FUTURE RESULTS. NO ASSURANCE CAN BE GIVEN THAT THE RECOMMENDATIONS OF CAPTAINEWAVE.COM WILL BE PROFITABLE OR WILL NOT BE SUBJECT TO LOSSES. ALL CLIENTS SHOULD UNDERSTAND THAT THE RESULTS OF A PARTICULAR PERIOD WILL NOT NECESSARILY BE INDICATIVE OF RESULTS IN FUTURE PERIODS. THE RESULTS LISTED AT THIS WEBSITE ARE BASED ON HYPOTHETICAL TRADES. PLAINLY SPEAKING, THESE TRADES WERE NOT ACTUALLY EXECUTED. HYPOTHETICAL OR SIMULATED PERFORMANCE RESULTS HAVE CERTAIN INHERENT LIMITATIONS. UNLIKE AN ACTUAL PERFORMANCE RECORD, SIMULATED TRADES DO NOT REPRESENT ACTUAL TRADING. ALSO, SINCE THE TRADES HAVE NOT ACTUALLY BEEN EXECUTED, THE RESULTS MAY HAVE OVER OR UNDER COMPENSATED FOR THE IMPACT, IF ANY, OF CERTAIN MARKET FACTORS SUCH AS LACK OF LIQUIDITY. YOU MAY HAVE DONE BETTER OR WORSE THAN THE RESULTS PORTRAYED. NO REPRESENTATION IS BEING MADE THAT ANY ACCOUNT WILL OR IS LIKELY TO ACHIEVE PROFITS OR LOSSES SIMILAR TO THOSE SHOWN. NO INDEPENDENT PARTY HAS AUDITED THE HYPOTHETICAL PERFORMANCE CONTAINED AT THIS WEBSITE, NOR HAS ANY INDEPENDENT PARTY UNDERTAKEN TO CONFIRM THAT THEY REFLECT THE TRADING METHOD UNDER THE ASSUMPTIONS OR CONDITIONS SPECIFIED HEREAFTER. WHILE THE RESULTS PRESENTED AT THIS WEBSITE ARE BASED UPON CERTAIN ASSUMPTIONS BELIEVED TO REFLECT ACTUAL TRADING CONDITIONS, THESE ASSUMPTIONS MAY NOT INCLUDE ALL VARIABLES THAT WILL AFFECT, OR HAVE IN THE PAST AFFECTED, THE EXECUTION OF TRADES INDICATED BY CAPTAINEWAVE.COM. THE HYPOTHETICAL RESULTS ON THIS WEBSITE ARE BASED ON THE ASSUMPTION THAT THE CLIENT BUY AND SELLS THE POSITIONS AT THE OPEN PRICE OF THE STOCK. THE SIMULATION ASSUMES PURCHASE AND SALE PRICES BELIEVED TO BE ATTAINABLE. IN ACTUAL TRADING, PRICES RECEIVED MAY OR MAY NOT BE THE SAME AS THE ASSUMED ORDER PRICES.
share
share
share
share
share
More from Gold-Eagle