Technical Analysis Of The Markets


Current Position of the Market
SPX Long-term trend: Uptrend continues with a serious loss of upside momentum in weekly indicators.
SPX Intermediate trend: An ending pattern appears to be in its last stages of completion. This should be followed by an intermediate term correction into October.
Analysis of the short-term trend is done on a daily-basis with the help of hourly charts. It is an important adjunct to the analysis of daily and weekly charts which discuss longer market trends.
Final Minor Correction?
Market Overview
While some saw last week’s rapid decline of 24 points in the SPX as the beginning of a larger correction, it is and it is not! It is part of a larger correction only in the sense that this move appears incomplete and needs to retrace to a slightly lower low before completion. In other words, it is only a minor correction which should end early week, and be followed by what will likely be the final rally into our (ca) 2500 projection. With this action, the index would satisfy structure and P&F projection, and it would also place the technical indicators into an ideal position to give a sell signal. It would, as well, satisfy the cyclic rhythm of the stock market, since it would prepare SPX for a plunge into the 20-wk cycle low which would come just a few days after the top.
I mentioned earlier that a decline into the 20-wk cycle – which is due about the middle of next month – would likely be the trigger for an intermediate correction that would last until October. On a larger time-frame, that too would suit the bottoming action of the (approximately) 30-mo cycle.
Analysis: (These Charts and subsequent ones courtesy of QCharts.com)
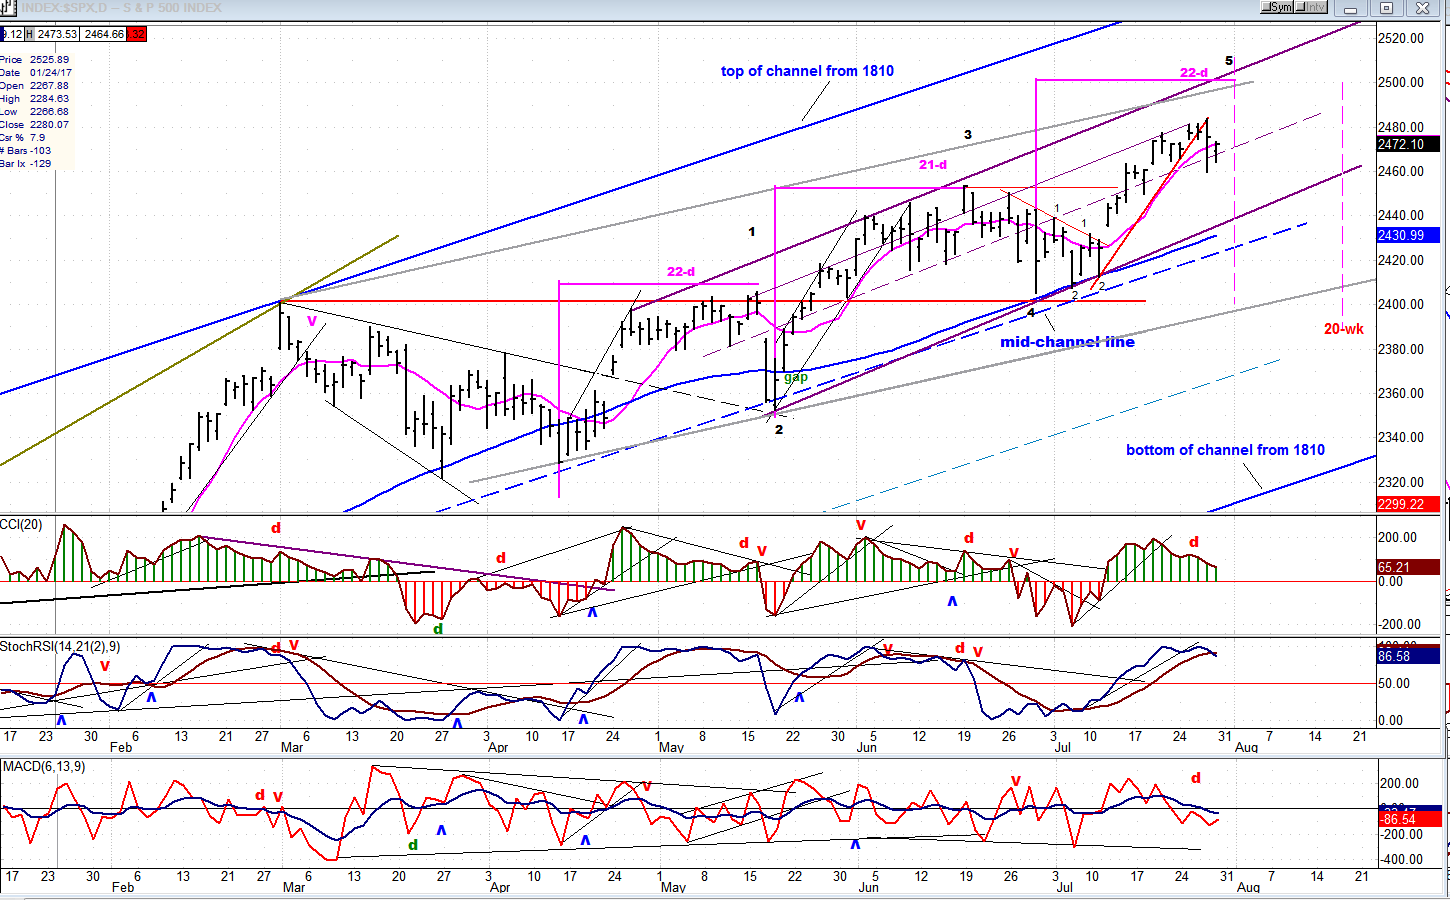
Daily Chart
To re-iterate, SPX is up-trending within a larger (blue) channel that has its start at 1810, with the latest structural phase of the uptrend creating a narrower (purple) channel which it essentially delineated by the second upper quartile of the large channel. On the chart, the dashed line represents the mid-point of the blue channel and, as you can see, it has served as support for every pull-back since the index made its 2400 high in late march. That was the high prior to the start of the ending pattern which is now, well…ending!
I had thought that the three waves of that pattern would match each other in length, but it looks like the final one -- which is where we presently are -- will be a few days longer. It cannot be that much longer, however, because the 20-wk cycle, which habitually brings a good correction, is not far away. If restrained until the last minute, then the correction can be very sharp.
Completing the current pull-back should take a couple of days and, if we allow about five days to get to the top, that woud put us at the beginning of the second week in August and it would make the total length of the final wave about 27 days.
The oscillators need a little more time to get into a proper position to give a sell signal, so another seven or eight days would be just about perfect.
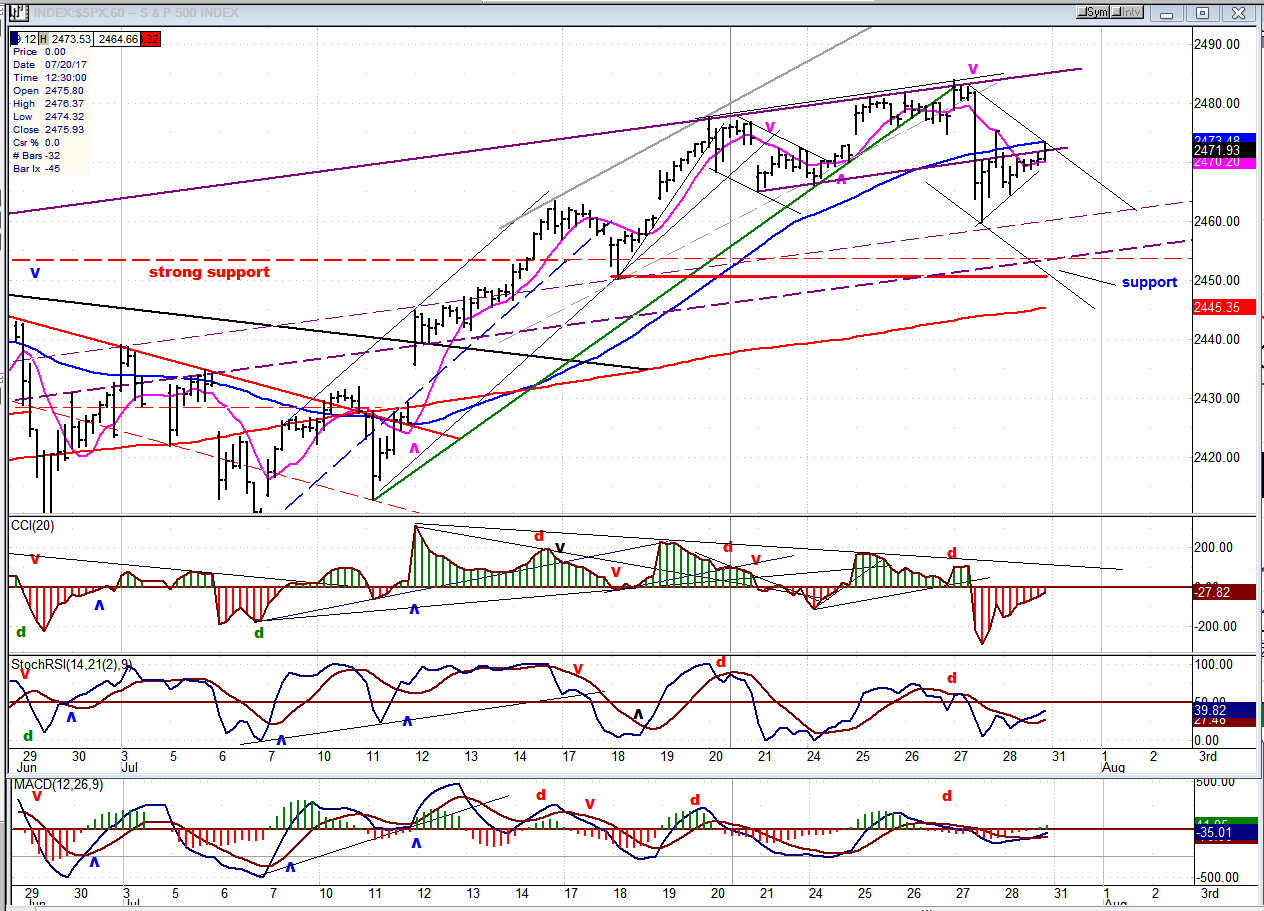
Hourly Chart
The hourly chart does not really show what happened on Thursday. If you went to a 1m chart, you could see that the index opened on a gap, ran up to within one point of its projection, and sold off immediately within the first minute of trading, retracing over half of the gap. After prices stabilized for a couple of hours, a stronger wave of selling took place over the next hour, which is what you see on chart. The decline was caused by the bottoming of the 6-wk cycle, after which the index rallied.
The reason I describe this is to show what happens when cycles wait until the last minute to make their lows. In this case, the 6-wk cycle waited until the final hours to bottom. If you look on the daily chart above, you will find a replica of what happened last week, but at the daily level, when the 34-wk cycle also waited until the last moment to make its low (mid-May). The longer we wait to make the top of this move, the higher the odds that the same action will take place within the 20-wk cycle.
Getting back to now, the hourly chart shows an incomplete correction pattern with the “a” wave finding support at 2460 on Thursday and rallying in what could be the top of the “b” wave on Friday, although it could extend to 2475 on Monday before retracing to 2455 by Tuesday/Wednesday. After that we should start our final push into the intermediate top.
Another less likely possibility is that we’ve already completed a smaller a-b-c pattern and are ready to move higher. The oscillators are ambivalent on this score.
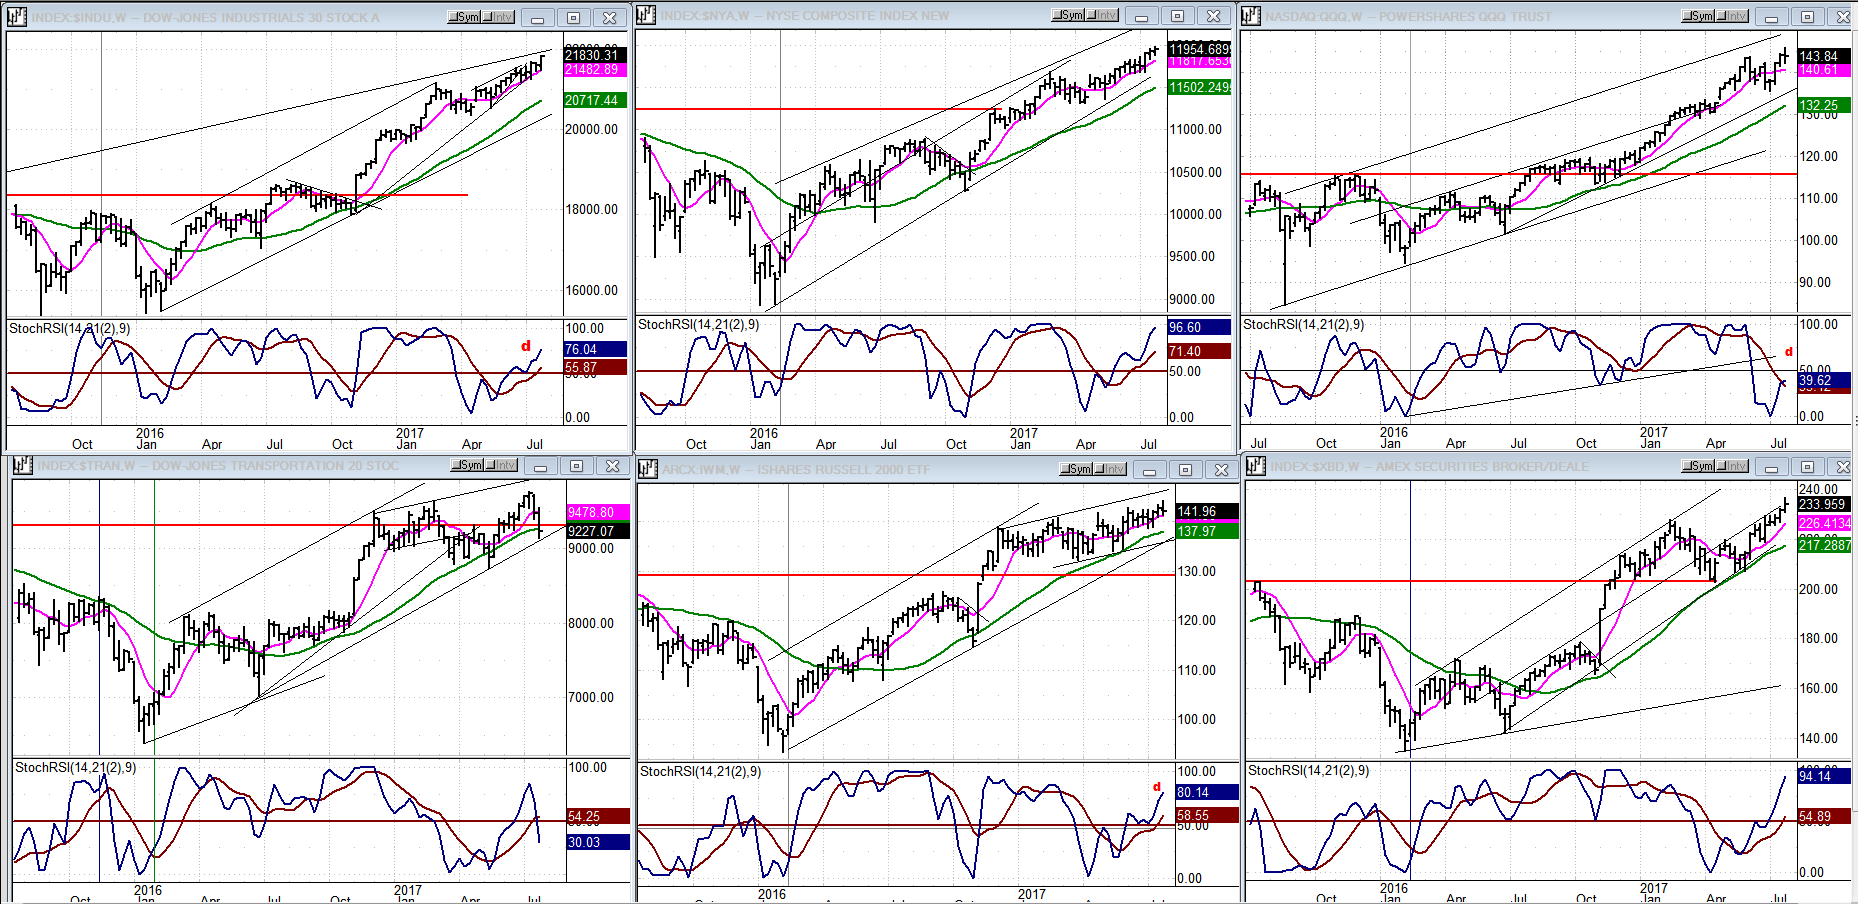
An Overview Of Some Important Indexes (Weekly Charts)
The only weakness showing in the indexes below is in TRAN (bottom left) which quickly reversed after making a new all-time high. Is it the early bird (again) for the coming correction?
UUP (Dollar ETF)
Instead of bottoming, UUP is accelerating its decline. This could be a temporary selling climax since both oscillators are showing positive divergence.

GDX (Gold Miners)
GDX reacted positively once again to the reversal of its 9-10wk cycle. However, it is reaching a significant resistance level which could prevent it from extending its current uptrend much farther. If there is little weakness into the 25/28-day cycle low (blue line), it will be in a good position to extend its move past the resistance into a significant uptrend.
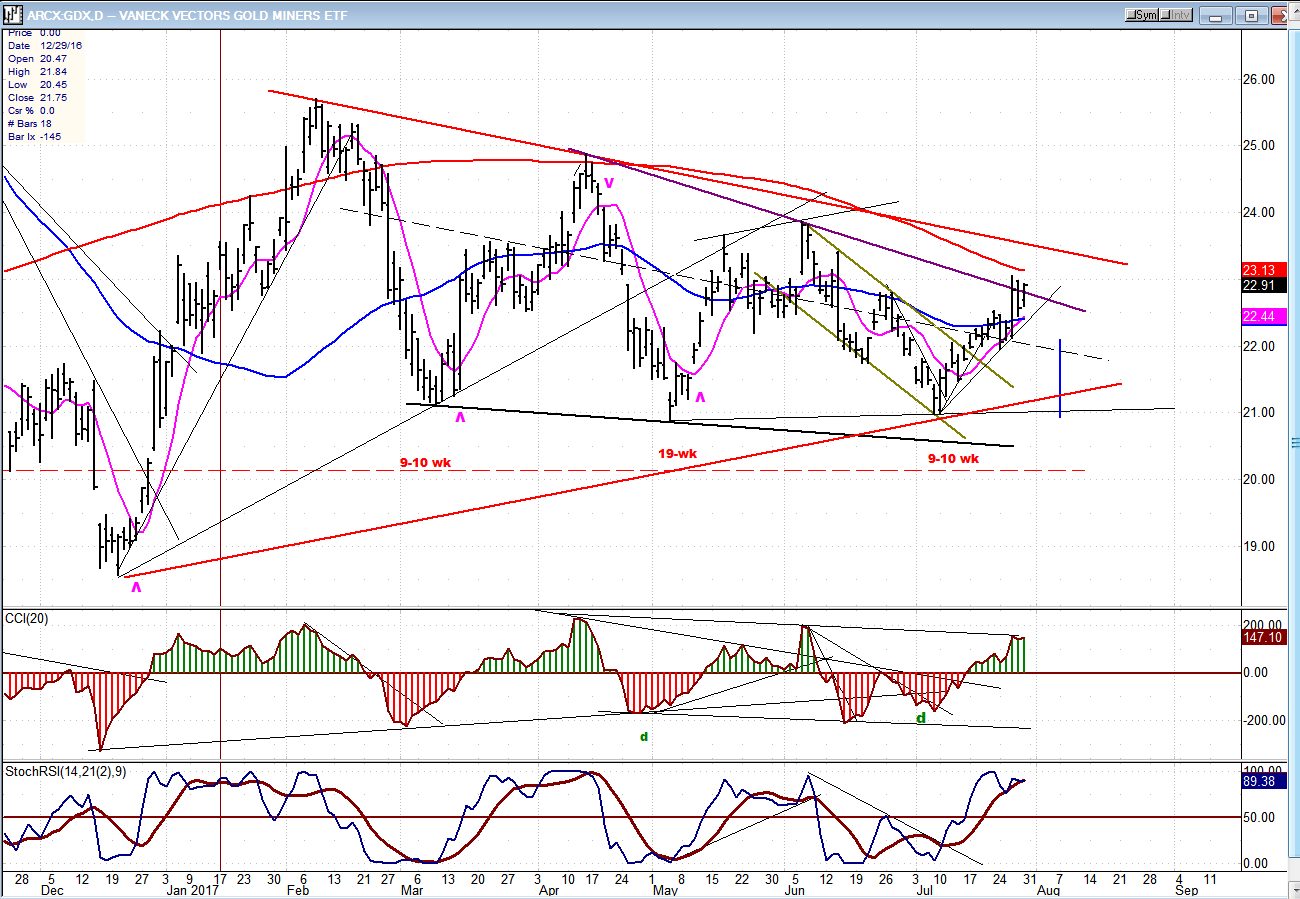
Note: GDX is now updated for subscribers throughout the day, along with SPX.
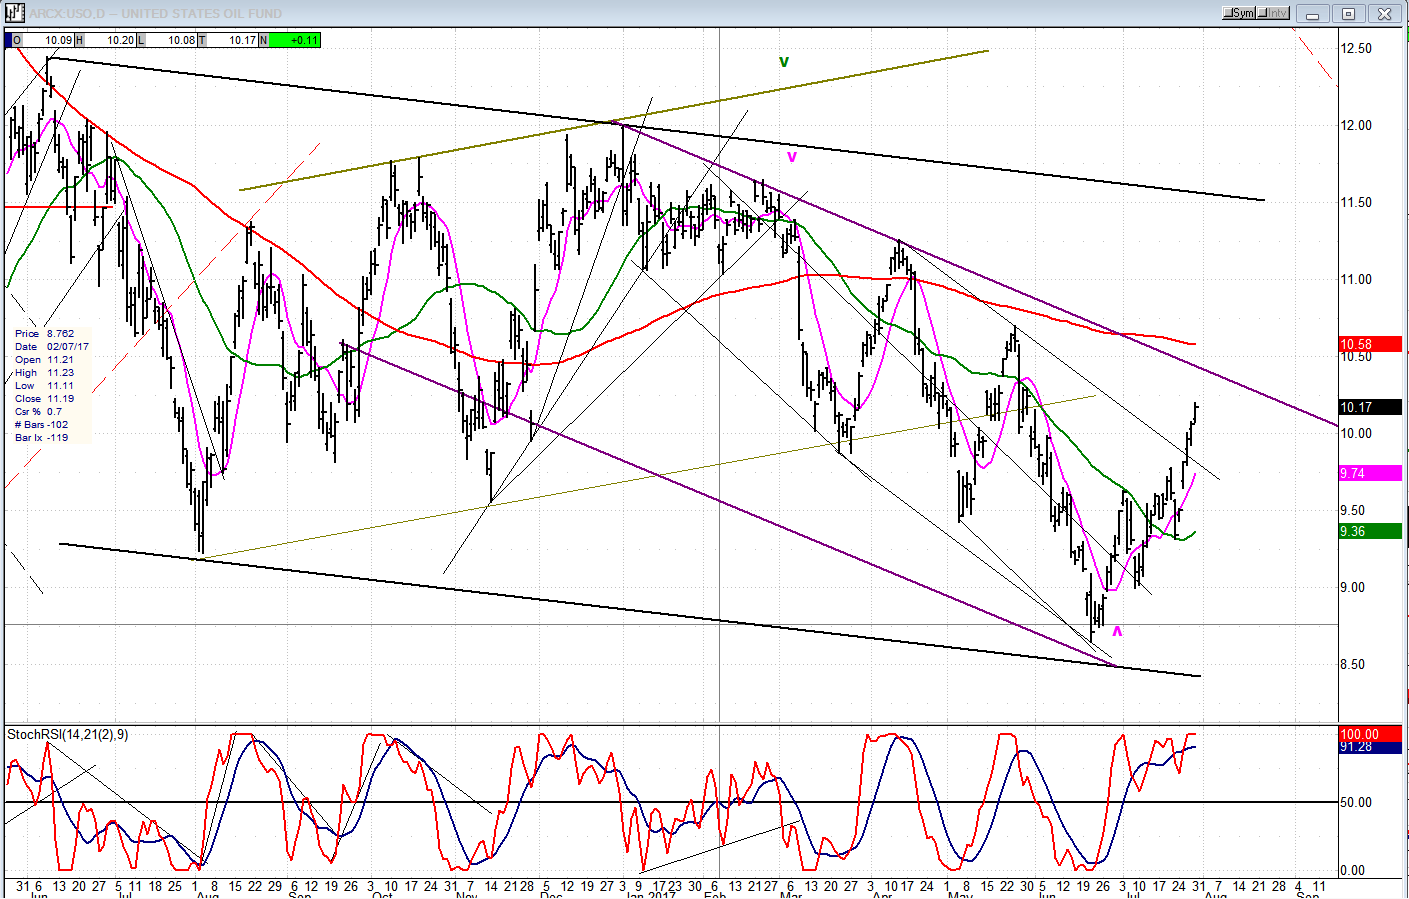
USO (United States Oil Fund)
USO should find resistance just a little higher, as it reaches its downtrend line. This should be followed by another correction which, depending on the amount of weakness, will determine whether it is ready to move out of its base; or if this is all part of a larger corrective pattern which will take it to a new low.
Summary
The above is a detailed analysis of what I consider the best scenario for the next couple of weeks. If correct, there should not be too much departure from what has been written.
********
For a FREE 4-week trial, send an email to [email protected], or go tand click on “subscribe”. There, you will also find subscription options, payment plans, weekly newsletters, and general information. By clicking on "Free Newsletter" you can get a preview of the latest newsletter which is normally posted on Sunday afternoon (unless it happens to be a 3-day weekend, in which case it could be posted on Monday).
The above comments and those made in the daily updates and the Market Summary about the financial markets are based purely on what I consider to be sound technical analysis principles. They represent my own opinion and are not meant to be construed as trading or investment advice, but are offered as an analytical point of view which might be of interest to those who follow stock market cycles and technical analysis.

When Andre Gratian was a stock broker years ago, a friend introduced him to technical analysis of the market. Consequently, it is not an exaggeration to say that Andre fell in love with this approach! Ever since then, it has become an increasingly important part of his professional life. Gratian has studied the works of Wyckoff, Edwards & Magee, Edward J. Dewey (cycles) and many others. However, one of my most profitable undertaking has probably been to study Point & Figure charting, which he finds invaluable in analyzing stocks and indices. If he were restricted to one methodology, this is the one that he would choose. This well-rounded background has given him what he feels to be a special insight into the stock market, facilitating the recognition of meaningful patterns and the ‘turning points’ in all trends, whether they be short or long term. Andre feels very comfortable discussing the stock market and passing on meaningful information to others. His subscribers include individuals and money managers throughout the world. Moreover, his Newsletters are currently published on several financial sites, here and abroad.


