Technical Analysis Of The Markets


Current Position of the Market
SPX Long-term trend: Uptrend continues with a serious loss of upside momentum in weekly indicators.
SPX Intermediate trend: An ending pattern appears to be in its last stages of completion. This should be followed by an intermediate term correction into October.
Analysis of the short-term trend is done on a daily-basis with the help of hourly charts. It is an important adjunct to the analysis of daily and weekly charts which discuss longer market trends.
Has Time Run Out?
Market Overview
With an important intermediate cycle bottoming in the near future, it is no wonder that the SPX is having trouble reaching its ideal final target of about 2500. We could argue that last week was its last chance to do so, and its refusal to go above 2480 -- which level repelled it on several occasions -- can be seen as validation for 2484 being the final high of this rally. But, since nothing is ever certain in the stock market, and with the DJIA going crazy and making daily new highs, let’s just wait for a hint of confirmation. A decline into the cycle low could arrive quickly and suddenly, similar to what took place a week ago.
Speaking of the DJIA, in the last few days the news media was replete with how well the “stock market” is doing. If there is ever a time when caution should be exercized by investors, it should be precisely in this type of environment!. So, next week: caveat emptor.
It has been my belief that the 20-wk cycle, which is ideally due to bottom in about ten days and has a good record of being on time -- although the degree of weakness it brings varies according to the total cycle mix in which it finds itself -- could very well be the trigger for a larger decline which, if the maket’s decennial pattern prevails, should last into October and bring about the largest correction since 1810. This would also work structurally since we would potentially be entering the highest correction degree since that low. That, however, would entail going below 2410 and, as of his moment, we do not seem to have enough of a disribution pattern on the SPX 10X chart. This means that additional distribution may be needed either before or after the low of the 20-wk cycle.
Analysis: (These Charts and subsequent ones courtesy of QCharts.com)
Daily Chart
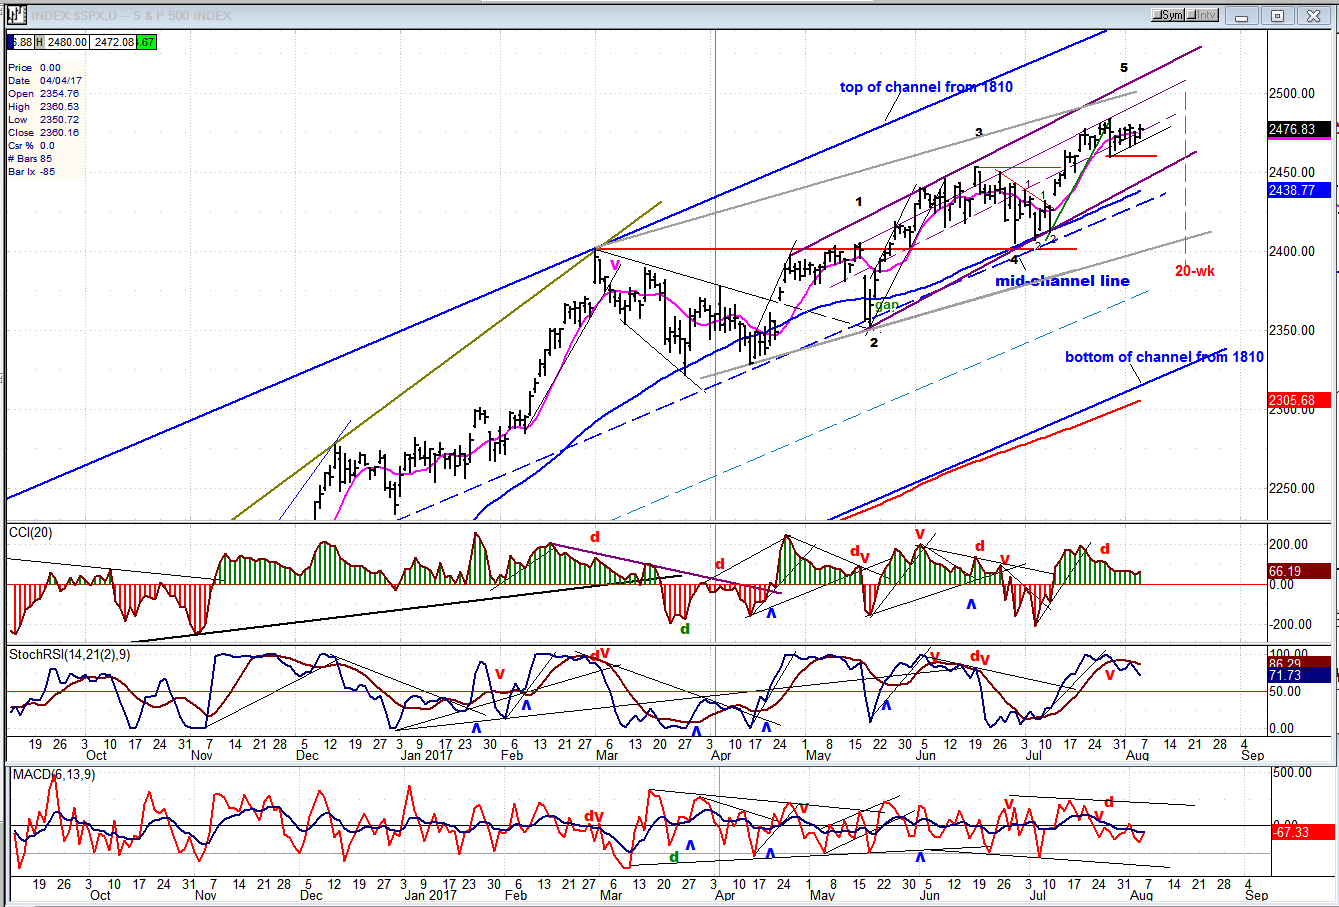
Since ending the correction which started from 2400 (red horizontal line), SPX resumed its uptrend by trading in a narrow (purple) channel which has essentially formed within the boundaries of the third quartile of a much larger (blue) channel which starts at 1810. As we can see, we are still a long way from coming out of that channel, so we can safely assume that the longer trend is alive and well, and not in a big hurry to reverse.
If we glance at the small purple channel, we can see that it consists of patterns that I have labeled 1 through 5. Focusing on the last pattern, we note that, unlike the previous ones, it has failed from going all the way to the top channel line. Furthermore, in the past week, it has remained in a tight range, unable to exceed the 2484 high achieved on 7/27. Obviously, the trend is decelerating rapidly, in a manner very similar to 1 and 3 just before they reversed. But since the deceleration is more serious in the last one and since the tendency is for the third pattern (5 waves) in any direction is to end the entire formation which, in this case, started at 2322, we can assume that the coming correction will be larger than that of the previous two (2 & 4) which were a little over 50 points each. In fact, the 10X P&F chart currently gives us a count of about 60-70 points. Assuming that 2484 remains the high of the move, the index will have traveled 162 points from its low of 2322, and a retracement of 60 points would measure .382, which is a normal price retracement
The reason for this correction becomes obvious if you look a little to the right on the chart, where you see a vertical dashed line drawn on 8/17 and the notation “20-wk cycle”. In other words, if the index did start its correction on Monday let’s say, over the next two weeks we would have SPX declining down to 2424, into the low of the 20-wk cycle which is presumed to be on 8/17.
Although there is some sound technical logic behind this analysis, SPX will ultimately do what it wants to do, but what say the daily indicators about our readiness to start a correction? They look ready, providing we do not rise beyond 2484 over the next few days. The three patterns in the momentum oscillators are remarkably similar in length and profile, including the appearance of negative divergence. The SRSI has already turned down and made a new low, but the one at the bottom, the A/D indicator, is the one which really shows weakness. It turned negative two weeks ago and has remained so. If we are to start this decline from here, the upper two need to join it into the red and remain there for the next two weeks.
In the Market Overview, I mentioned that we could stretch this decline all the way into October, and this would only last two weeks. Should this scenario come to pass, we can assume that it would only be one phase of the entire correction and, after another period of distribution, we could then proceed to a lower level.
This is one possible scenario for the near future. We’ll discuss others when we analyze the hourly chart.
Hourly Chart
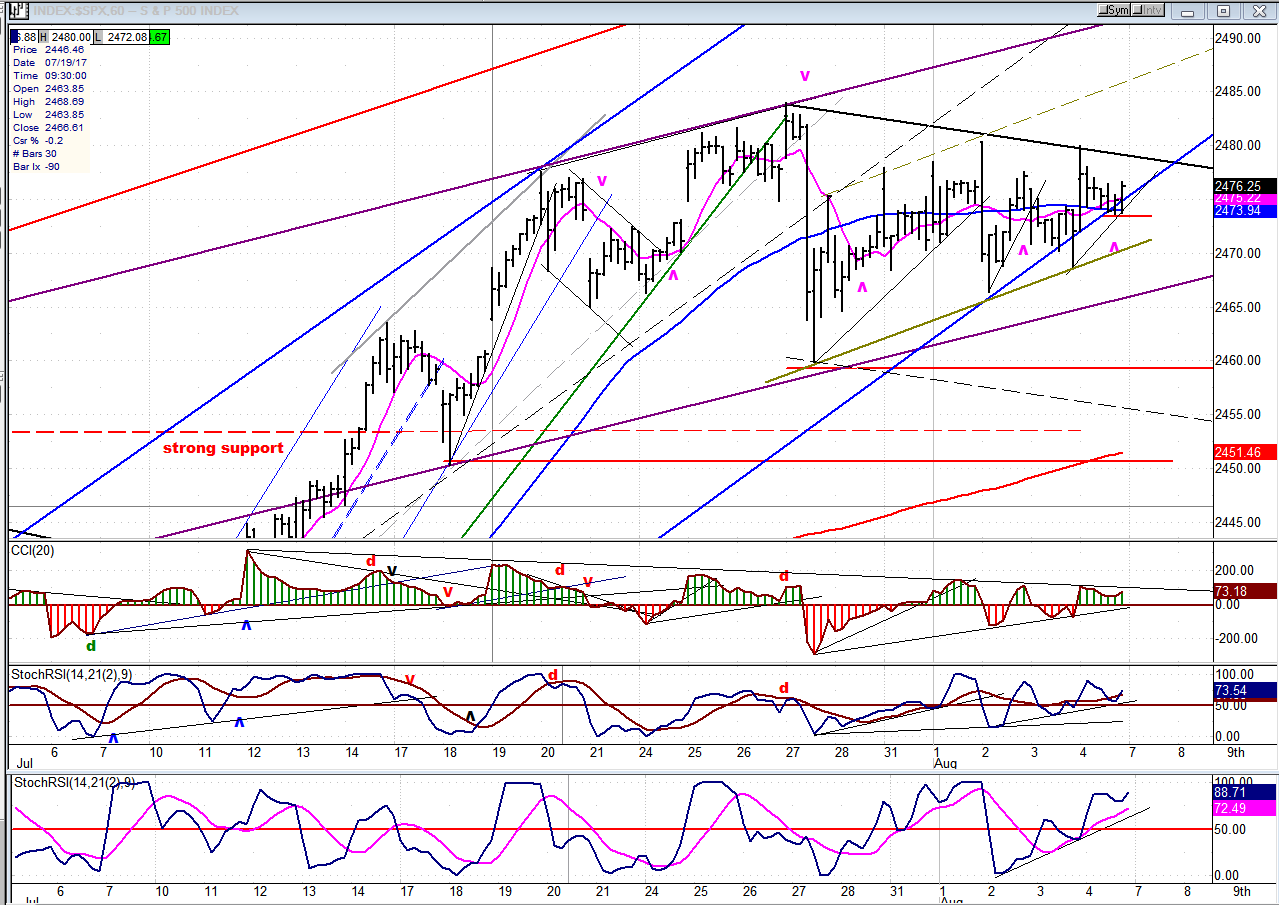
The hourly chart is a close-up of the recent index action. Its analysis gives us a possible alternative to the scenario presented above. Trading for the past week shows a series of higher bottoms and lower tops which could be forming a triangle (which is a continuation pattern), suggesting up instead of down for the near-term. With an upside break-out from here, we could still get up to our projection, or closer to it. Another possibility is that we could still have another decline to about 2455 to complete an a-b-c correction before starting on the last short-term uptrend to reach the ideal projection of 2500.
Using up a few more days to reach our final destination would mean that we would have less time to travel to the estimated date of the cycle low, which would remain constant, and this could create an even steeper decline. Also, all the relationships established in the first model would be altered including the P&F chart and the count derived from it.
The hourly oscillators are still in an uptrend and are not showing any clear divergence, so there is no warning yet that the index is about to turn down immediately. Globex did close about three points lower but that may not have any bearing on Monday’s opening.
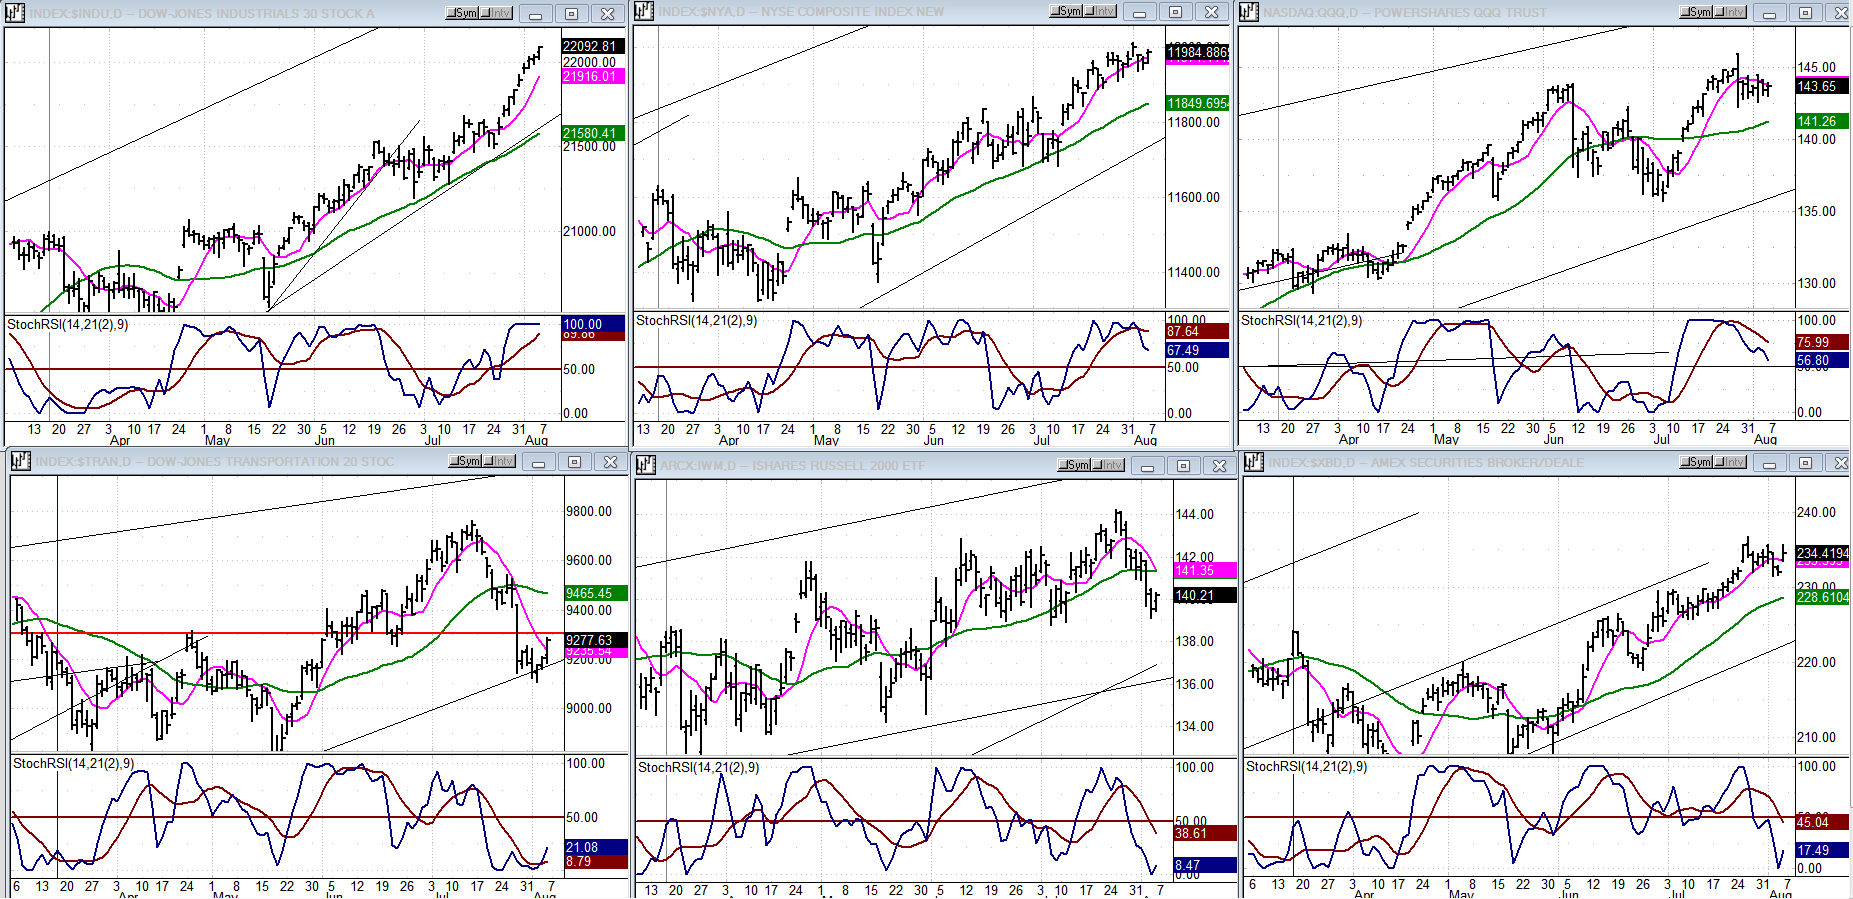
An Overview Of Some Important Indexes (Daily Charts)
This week, we’ll look at daily charts of our leading indexes. This will enable us to fully appreciate what the DJIA (top left) has done recently. It may be engaged in some short-term climactic buying which could suddenly reverse itself. It also provides a stark contrast with the TRAN, which is directly below it, and even IWM, just to the right of TRAN. QQQ, top right, made a recovery high after its recent correction but, like SPX, spent last week going sideways in a small range.
With such a lack of cohesion between them, it’s difficult to say who is leading and who is correctly predicting the next near-term trend, but I am guessing that it’s likely to be TRAN and IWM.
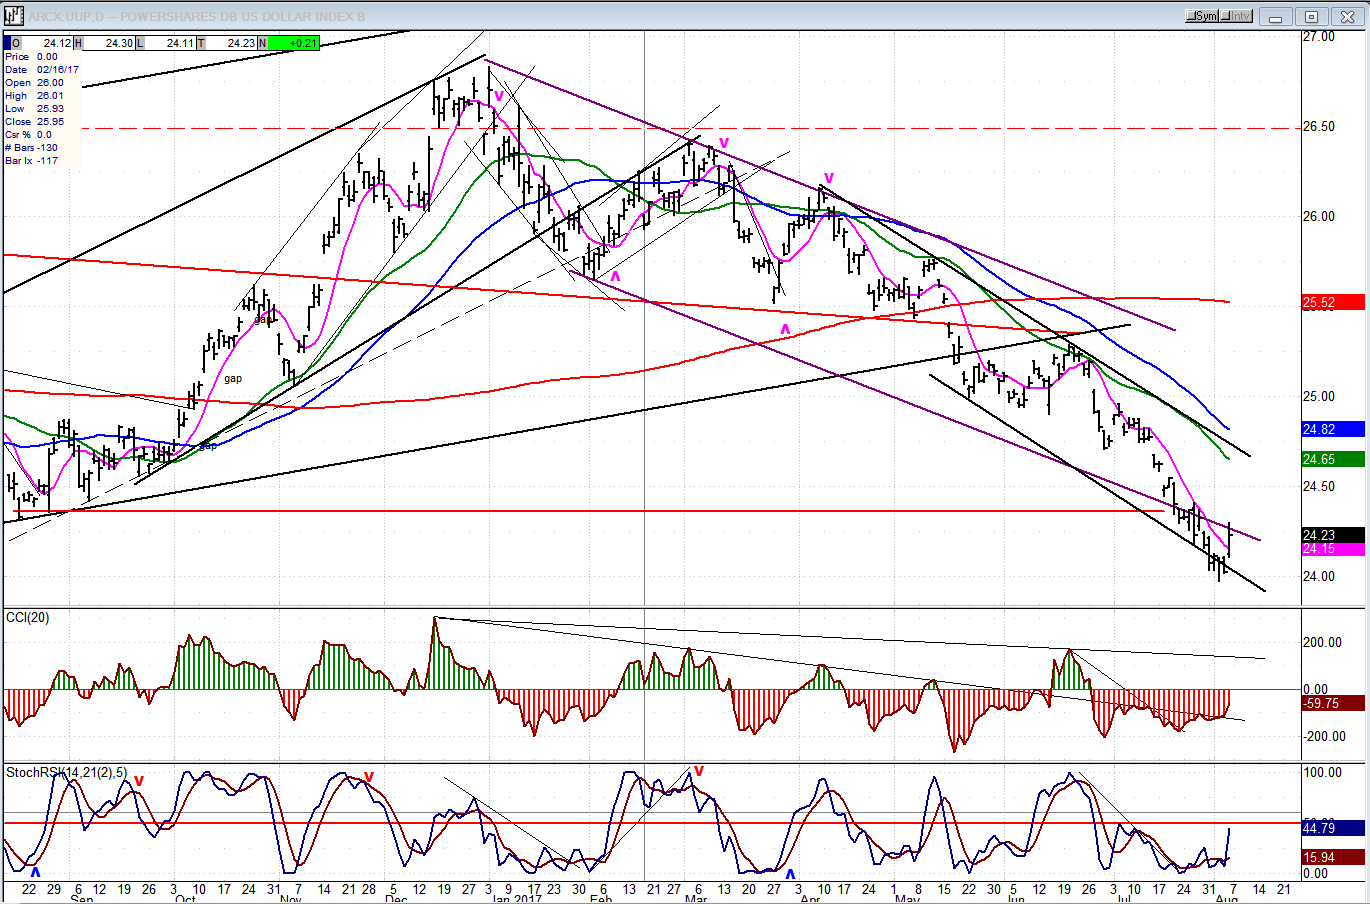
UUP (Dollar ETF)
The dollar did push slightly lower in a wave of selling from which it reacted with a strong bounce on Friday after the release of the jobs report. We’ll have to see if this is the start of a genuine reversal or just an interruption in a prolonged downtrend.
GDX (Gold Miners)
GDX had a rally induced by the 9/10-wk cycle reversal which stopped at its 233-dma, and has pulled back into the 25/28-day cycle low. When that low is established, GDX can then reveal how much buyer interest there really is. An immediate and powerful reversal from this level that overcomes the MA as well as its downtrend lines, would signal the beginning of a sustained uptrend that would immediately challenge the 25.50 resistance.
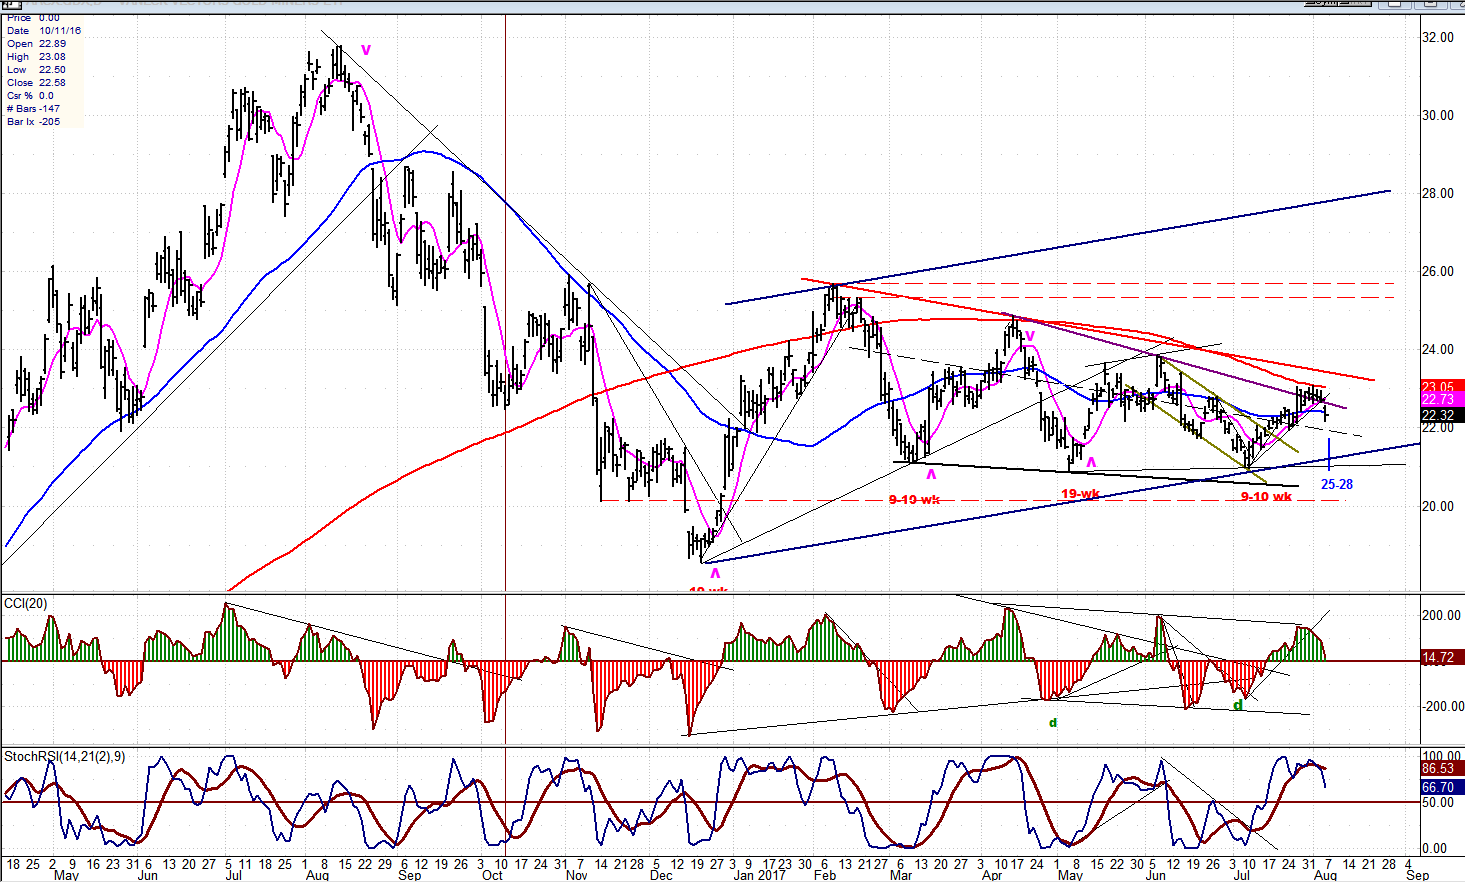
Note: GDX is now updated for subscribers throughout the day, along with SPX.
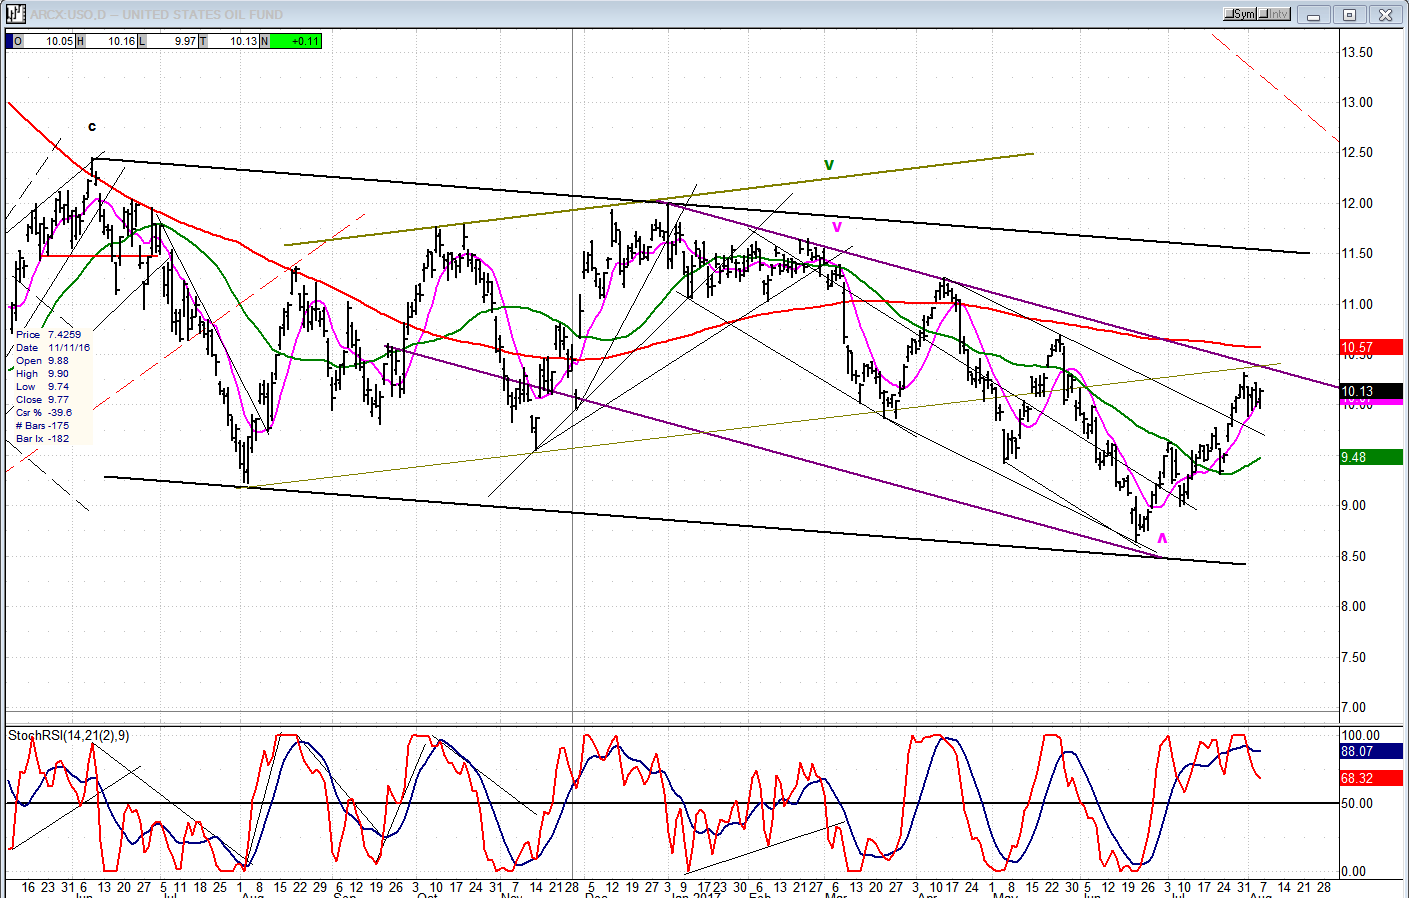
USO (United States Oil Fund)
USO has stalled just below the top of its intermediate corrective channel. It may be a tough slog going through 10.50, and should not happen without additional consolidation.
Summary
With the low of the 20-wk cycle about two weeks away, SPX has several options for the near term which are discussed above. One of these is still to extend its rally to the 2500 projection target, but it must start immediately, or it will be temporarily deferred or not occur at all.
********
For a FREE 4-week trial, send an email to [email protected], or go tand click on “subscribe”. There, you will also find subscription options, payment plans, weekly newsletters, and general information. By clicking on "Free Newsletter" you can get a preview of the latest newsletter which is normally posted on Sunday afternoon (unless it happens to be a 3-day weekend, in which case it could be posted on Monday).
The above comments and those made in the daily updates and the Market Summary about the financial markets are based purely on what I consider to be sound technical analysis principles. They represent my own opinion and are not meant to be construed as trading or investment advice, but are offered as an analytical point of view which might be of interest to those who follow stock market cycles and technical analysis.

When Andre Gratian was a stock broker years ago, a friend introduced him to technical analysis of the market. Consequently, it is not an exaggeration to say that Andre fell in love with this approach! Ever since then, it has become an increasingly important part of his professional life. Gratian has studied the works of Wyckoff, Edwards & Magee, Edward J. Dewey (cycles) and many others. However, one of my most profitable undertaking has probably been to study Point & Figure charting, which he finds invaluable in analyzing stocks and indices. If he were restricted to one methodology, this is the one that he would choose. This well-rounded background has given him what he feels to be a special insight into the stock market, facilitating the recognition of meaningful patterns and the ‘turning points’ in all trends, whether they be short or long term. Andre feels very comfortable discussing the stock market and passing on meaningful information to others. His subscribers include individuals and money managers throughout the world. Moreover, his Newsletters are currently published on several financial sites, here and abroad.
More from Gold-Eagle


