Technical Analysis Of The Markets


Current Position of the Market
SPX Long-term trend: The uptrend should continue after pausing for a correction.
SPX Intermediate trend: “An ending pattern appears to be in its last stages of completion. This should be followed by an intermediate term correction into October.” The correction has started.
Analysis of the short-term trend is done on a daily-basis with the help of hourly charts. It is an important adjunct to the analysis of daily and weekly charts which discuss longer market trends.
Correction In Full Swing?
Market Overview
After the 20-wk cycle made its low, a little ahead of its normal schedule, there was a rip-roaring rally at the beginning of last week which undoubtedly caused many to doubt that something serious had started, and thought that the market was ready for another new high. But by the end of the week, reality should have set in that something more than a short-term dip was occurring. EWT aficionados warn that 4th wave corrections, especially those of higher degree, can bring a lot of volatility, and this is certainly the way that this correction has started. It can be confusing!
Whether or not the future brings more swings of this magnitude, only the market knows. However, it always tips its hand by making moves proportional to the amount of distribution or accumulation which has taken place prior to the beginning of the trend. At the very top of the market, there was enough distribution to create a P&F count to much lower levels than those already reached. But we may have come to a point where a shorter-term count has already been filled, and a base is already forming for the next corrective rally. If we hold this level early next week, we should get another relief bounce. The positive divergence which is forming in the daily and hourly indicators is certainly suggestive of that, and all we need is confirmation by resisting further selling and getting started on the upside.
Analysis: (These Charts and subsequent ones courtesy of QCharts.com)
Daily Chart
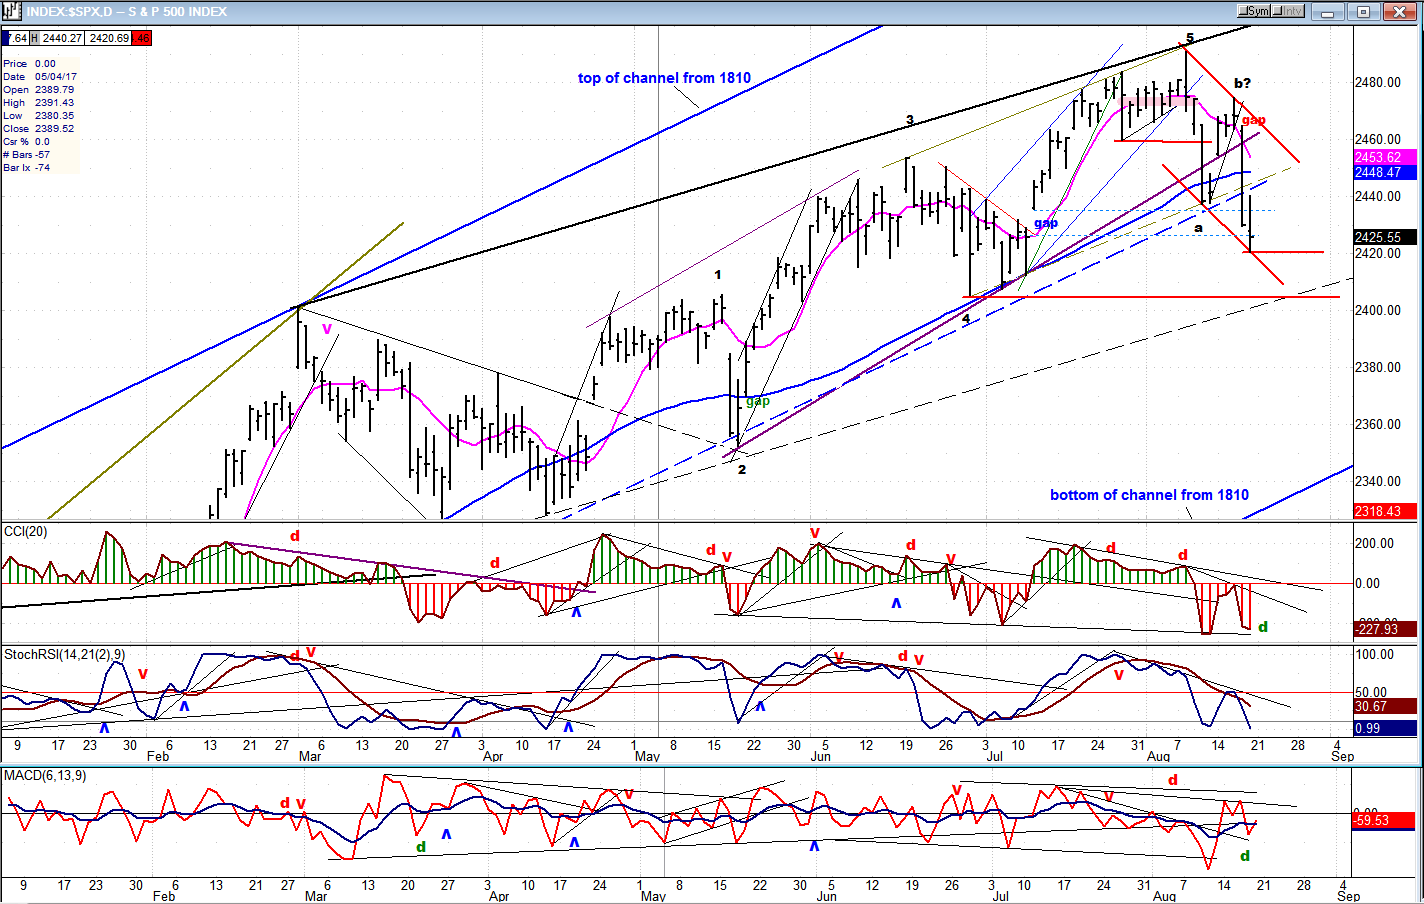
The 20-wk cycle found support on the intermediate, blue mid-channel line for the fourth time since April, but it was for the last time. On Thursday, that support was finally breached with some downside follow through on Friday. For the first time since March, we have made a lower-low/lower-high/lower low sequence and, by definition, we are now in a downtrend until the process reverses itself. We have already defined a short-term channe, and prices will remain in the current downtrend until they break above the top channel line. Even if they do, they would have to rise above last week’s high of 2474 to attempt reversing the current downtrend pattern. This is the simplest -- but very effective -- way to analyze the market trend.
If we are really in an intermediate downtrend, the next step will be to drop below the former short-term low of 2405 (red horizontal line). This would cause breaking a former low of a higher degree than we have already done, and it would be the confirmation we need to suggest that a more important correction
than any we have seen since early 2006, has started.
That does not mean that we are going to do this right away. The index may resist going lower for a little while longer. Friday’s action suggests that we may have started to build a congestion pattern which will temporarily reverse the current downtrend. This is supported by positive divergence beginning to show in some of the daily and hourly indicators. If so, there may already be enough of a base to give us a good bounce before we make the next lower low. This will have to be confirmed by market action early next week.
Hourly Chart
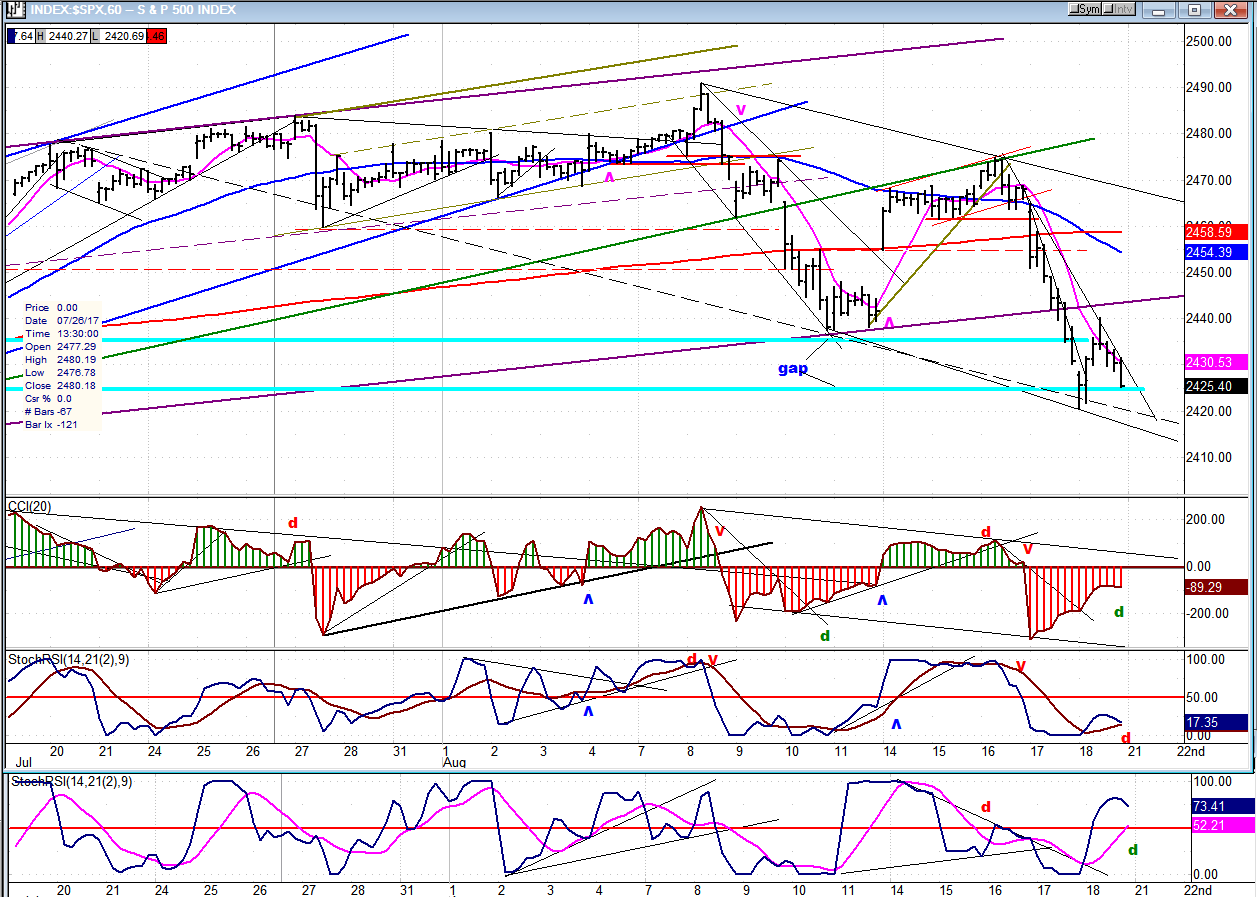
The index found support at the bottom of a channel, rallied, and sold off again at the close on Friday. The index appears to have completed a corrective pattern at Friday’s low and is in the process of retesting that low, before starting a move up on Monday -- which would confirm that view. If so, the next rally could take us back to the top of the channel and confuse the bears once again.
Friday’s decline filled a count taken across the congestion level at the 2468 top ,which increases the odds that Friday saw a low and that we are ready to rally toward the top of the channel or a little higher. But since a lower count was established at the very top, we want to make sure that we do not first make a new low before rallying
The pattern looks complete and is getting some assistance from the daily indicators, especially the A/D oscillator, which is showing strong positive divergence. However, we want to make sure by also having a quick turn in the hourly oscillators which I may have prematurely marked with positive divergence.
An Overview Of Some Important Indexes (Daily Charts)
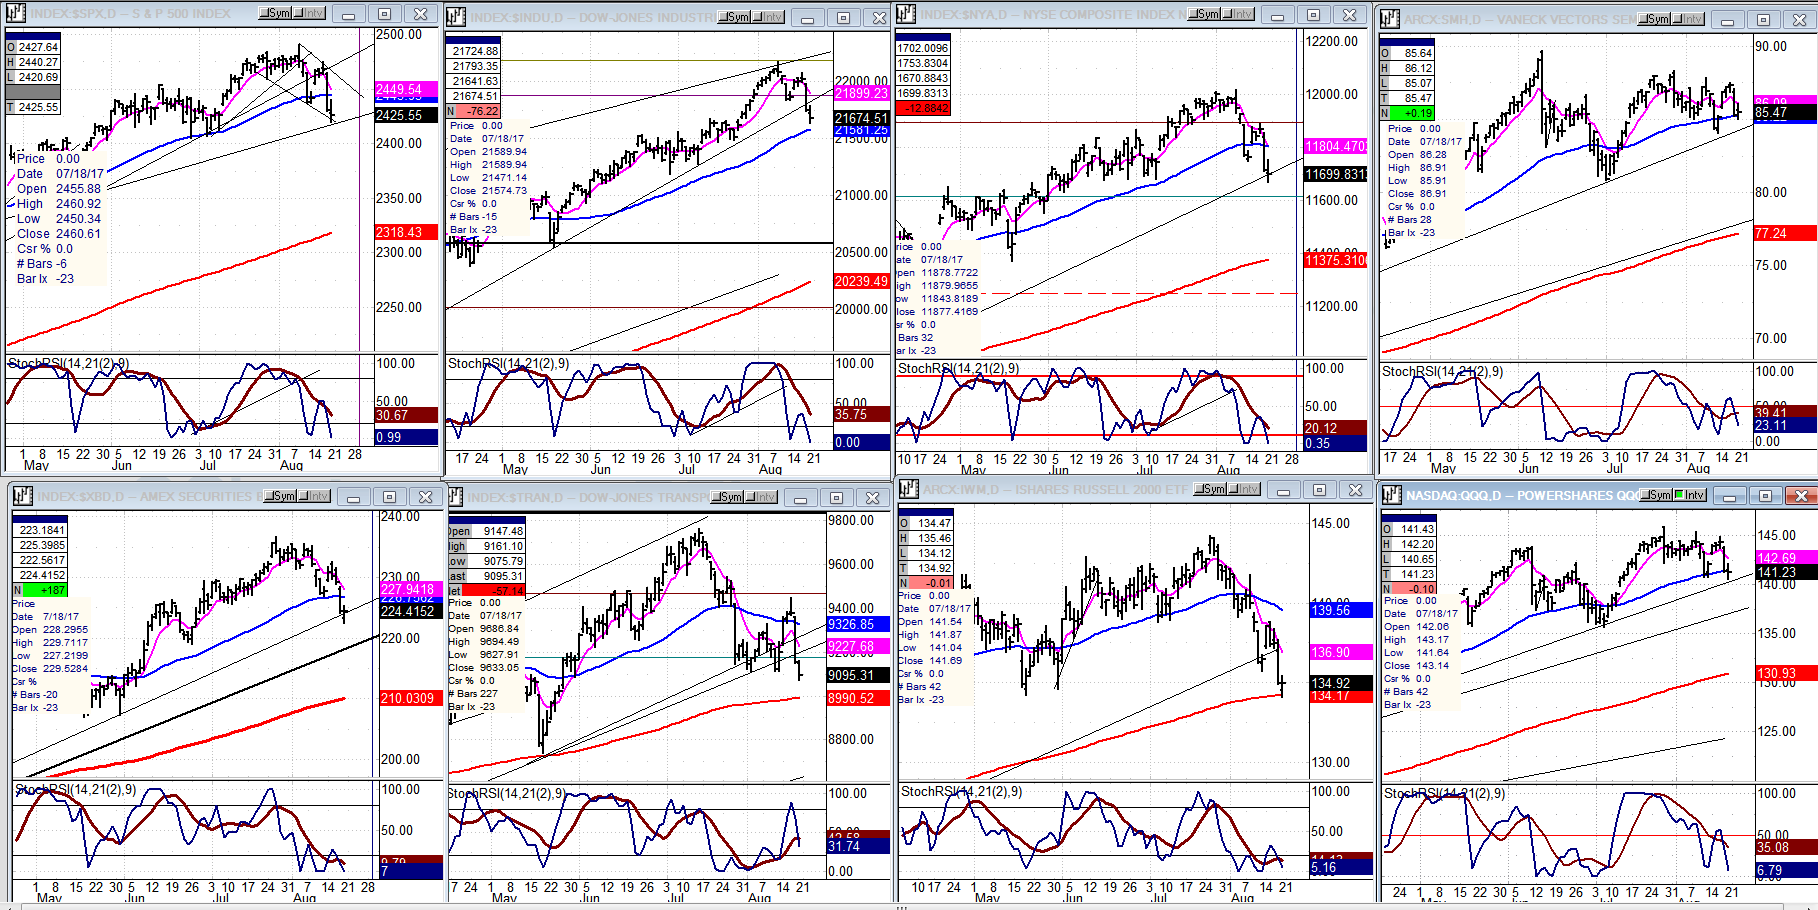
All the indexes below show that a correction has started. This time, it’s unanimous. The leaders are, as always, TRAN and IWM (second and third from the left, bottom row) although you can make a case for SMH (top right) to be the first to establish a top. Until we see some signs of reversing, we can assume that the correction is still in progress.
UUP (Dollar ETF)
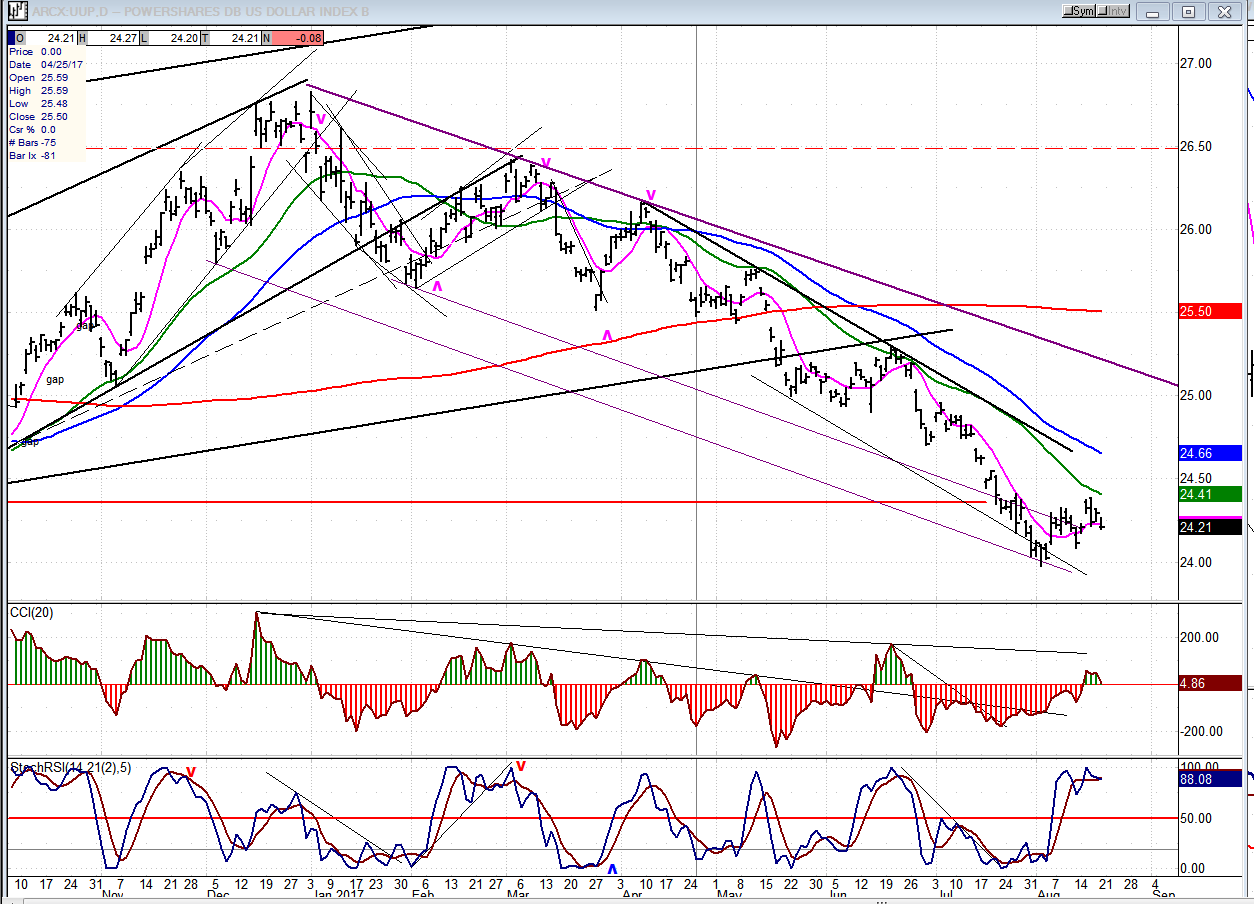
Since making its low at 24.98, UUP has made a limping recovery which does not impress. At best, it is the beginning of a basing process, and at worst, a consolidation in a downtrend.
GDX (Gold Miners ETF)
GDX has followed the 9/10-wk cyclic rhythm to a “T”. The current rally looks less vigorous than the previous three as price coils into an apex. It has been unable to get past the 23 level, and since it is now past the peak of its rhythmic pattern, the odds are rapidly increasing that it may have to pull back one more time into the next cycle low before starting anything of consequence.
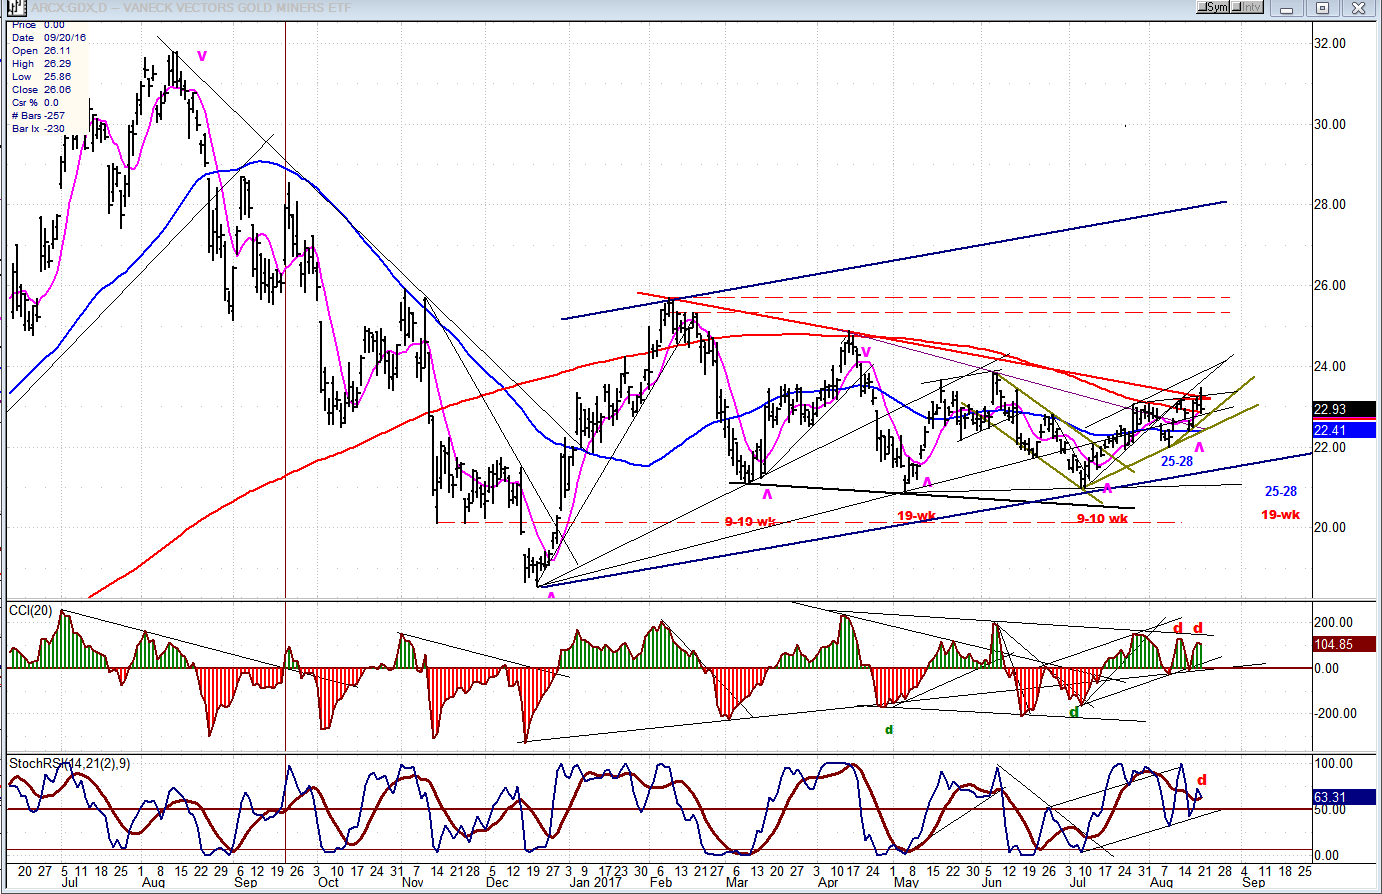
Note: GDX is now updated for subscribers throughout the day, along with SPX.
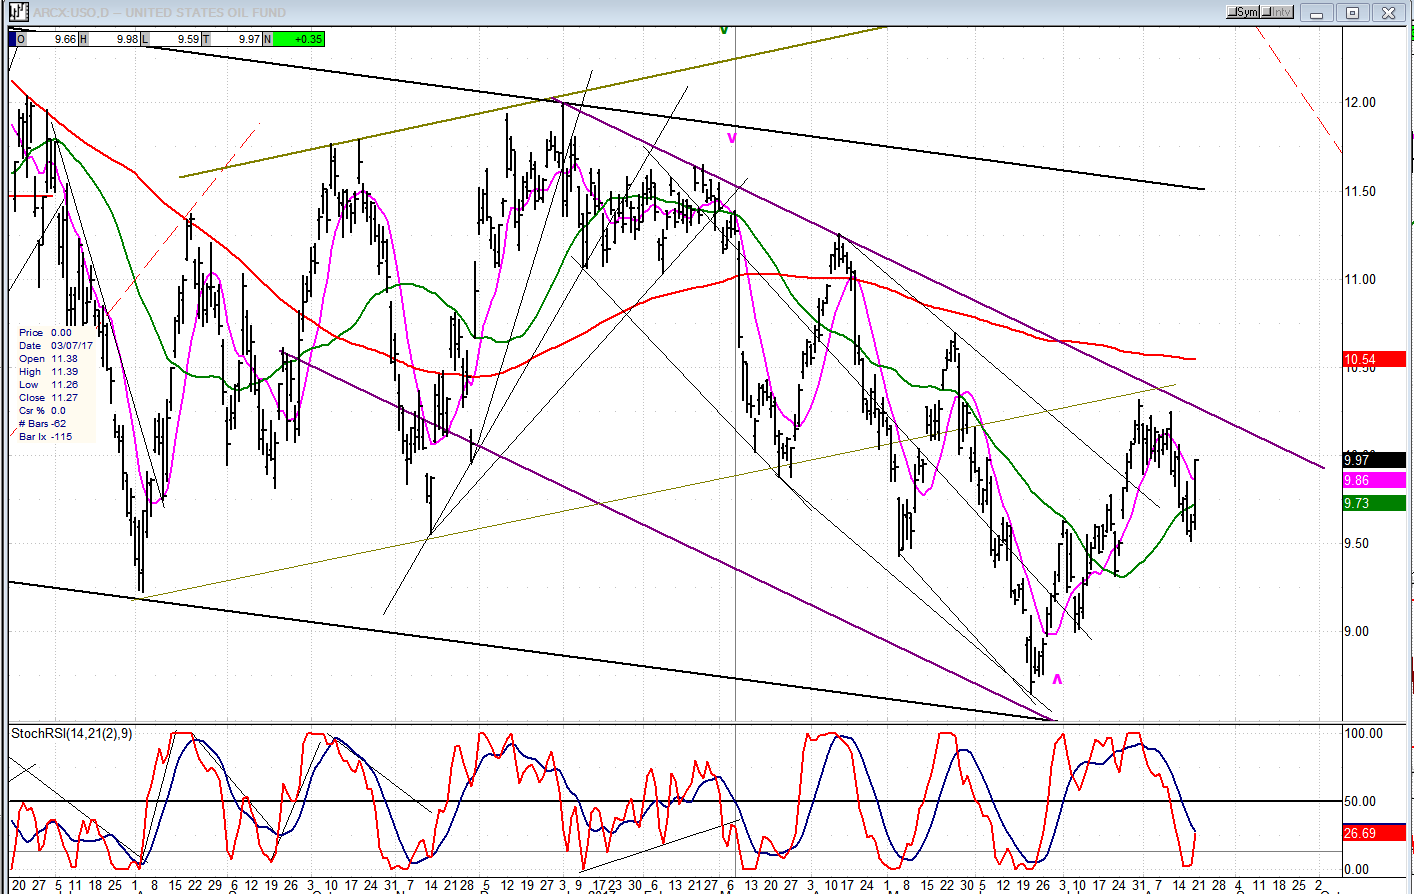
USO (United States Oil Fund)
USO may have found a low at 8.65 which will soon enable it to challenge its secondary corrective channel top. A consolidation of a few more days just below the top channel line, which holds Thursday’s low, would be a good set-up to push it through its 233-DMA as well.
Summary
One could argue that we will not have absolute confirmation that an intermediate downtrend has started until we drop below 2405, and that would be reasonable. That level could, in fact, hold the decline in check for a few weeks, as volatility continues to be the dominant pattern. However, the odds that the index will eventually retrace to much lower prices by October is still on the front burner.
********
For a FREE 4-week trial, send an email to [email protected], or go tand click on “subscribe”. There, you will also find subscription options, payment plans, weekly newsletters, and general information. By clicking on "Free Newsletter" you can get a preview of the latest newsletter which is normally posted on Sunday afternoon (unless it happens to be a 3-day weekend, in which case it could be posted on Monday).
The above comments and those made in the daily updates and the Market Summary about the financial markets are based purely on what I consider to be sound technical analysis principles. They represent my own opinion and are not meant to be construed as trading or investment advice, but are offered as an analytical point of view which might be of interest to those who follow stock market cycles and technical analysis.

When Andre Gratian was a stock broker years ago, a friend introduced him to technical analysis of the market. Consequently, it is not an exaggeration to say that Andre fell in love with this approach! Ever since then, it has become an increasingly important part of his professional life. Gratian has studied the works of Wyckoff, Edwards & Magee, Edward J. Dewey (cycles) and many others. However, one of my most profitable undertaking has probably been to study Point & Figure charting, which he finds invaluable in analyzing stocks and indices. If he were restricted to one methodology, this is the one that he would choose. This well-rounded background has given him what he feels to be a special insight into the stock market, facilitating the recognition of meaningful patterns and the ‘turning points’ in all trends, whether they be short or long term. Andre feels very comfortable discussing the stock market and passing on meaningful information to others. His subscribers include individuals and money managers throughout the world. Moreover, his Newsletters are currently published on several financial sites, here and abroad.


