Technical Analysis Of The Markets
 share
share
 share
share
 share
share
 share
share
 share
share
Current Position of the Market
SPX: Long-term trend – The bull market is continuing with a top expected in the low 3000s.
Intermediate trend – Is this an intermediate-term top? Perhaps not yet!
Analysis of the short-term trend is done on a daily basis with the help of hourly charts. It is an important adjunct to the analysis of daily and weekly charts which discusses the course of longer market trends.
How Low?
Market Overview
Well, it finally happened! After failing to reach its expected high in the 2900s, and with little advance warning, the index started a decline proportional in style to its recent advance; except for the fact that the last re-accumulation pattern at 2840 did not produce the expected advance to its projection target. Even the first phase of its correction (which met a projection based on the available count before starting to consolidate) looked like another consolidation in an uptrend. It was not until Friday that the market’s intention became obvious.
So what does this 1100-point, 5-day drop in the DOW (2/3rds of it on Friday) forecast for the near future? Just a hiccup, or something more? Both from a cyclical and projection standpoint, this could turn out to be only a fairly short correction in an uptrend with a new high following in the next few weeks or, at least, some retest of the high. It will depend on the market’s behavior in the next few days.
There was little distribution at the top, and therefore nothing from which to forecast a protracted decline. With regards to the SPX, after the count from the initial pattern was exhausted at 2819, the next congestion phase formed quickly over the next two days, and when the dam broke early Friday, the reservoir emptied all at once and, by the end of the day, there was little left in it. I suspect that what is left will take us a little lower on Monday morning, after which we can start an oversold rally. After this rally, we could re-test the low and even proceed lower before attempting to resume uptrend. If, after the retest, or a move slightly lower, we fail to see some strength returning, that will be the time to be concerned that a decline of larger magnitude has started.
This opinion is based on the belief that the market will obey the current cyclical rhythm which does not call for anything really (I mean really) serious to take place until the end of the year, although more large scale volatility cannot be excluded before then.
Chart Analysis (These charts and subsequent ones courtesy of QCharts)
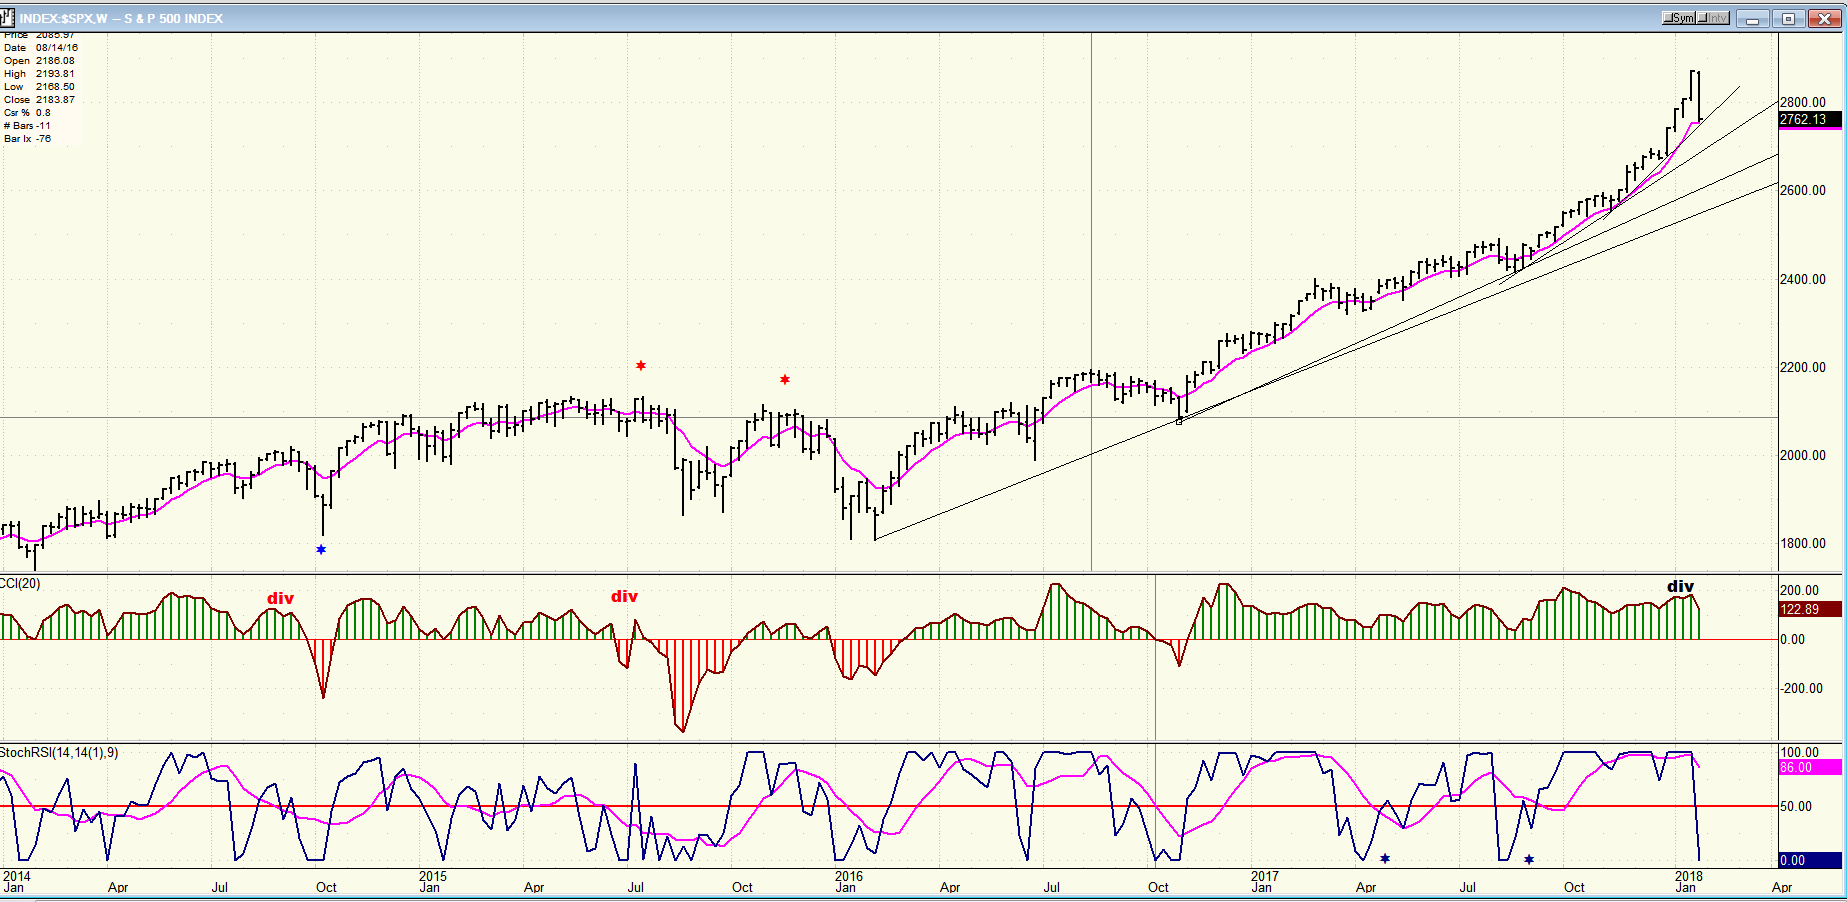
SPX Weekly Chart
In support of my opinion, I offer the weekly chart of the SPX. There is nothing on this chart which suggests that we have made an important top. Normally, this is preceded by some price deceleration, such as in the two former instances which I have marked by a red asterisk. It is a characteristic of tops to be rounded, while lows are sharp and climactic, as exemplified by many of the lows on this chart. You will also notice that not a single trend line, even the steepest one, has been broken. Of course, some probably will be in the course of the correction if it persists. We’ll have to see!
But the best evidence comes from the indicators. The CCI is still way up in the green and does not sport any obvious negative divergence; as it did in the two instances which preceded protracted corrections. The SRSI is more volatile and often drops to the bottom of its range, but only to come right back up. It can do so with only minor corrections in the index. But if it remains below the zero line for an extended period of time, that’s another story!
Is this analysis of the weekly chart conclusive proof that we have not started an important correction? Definitely not! Only the market can do that over a period of time. I am only calculating the odds based on past behavior.
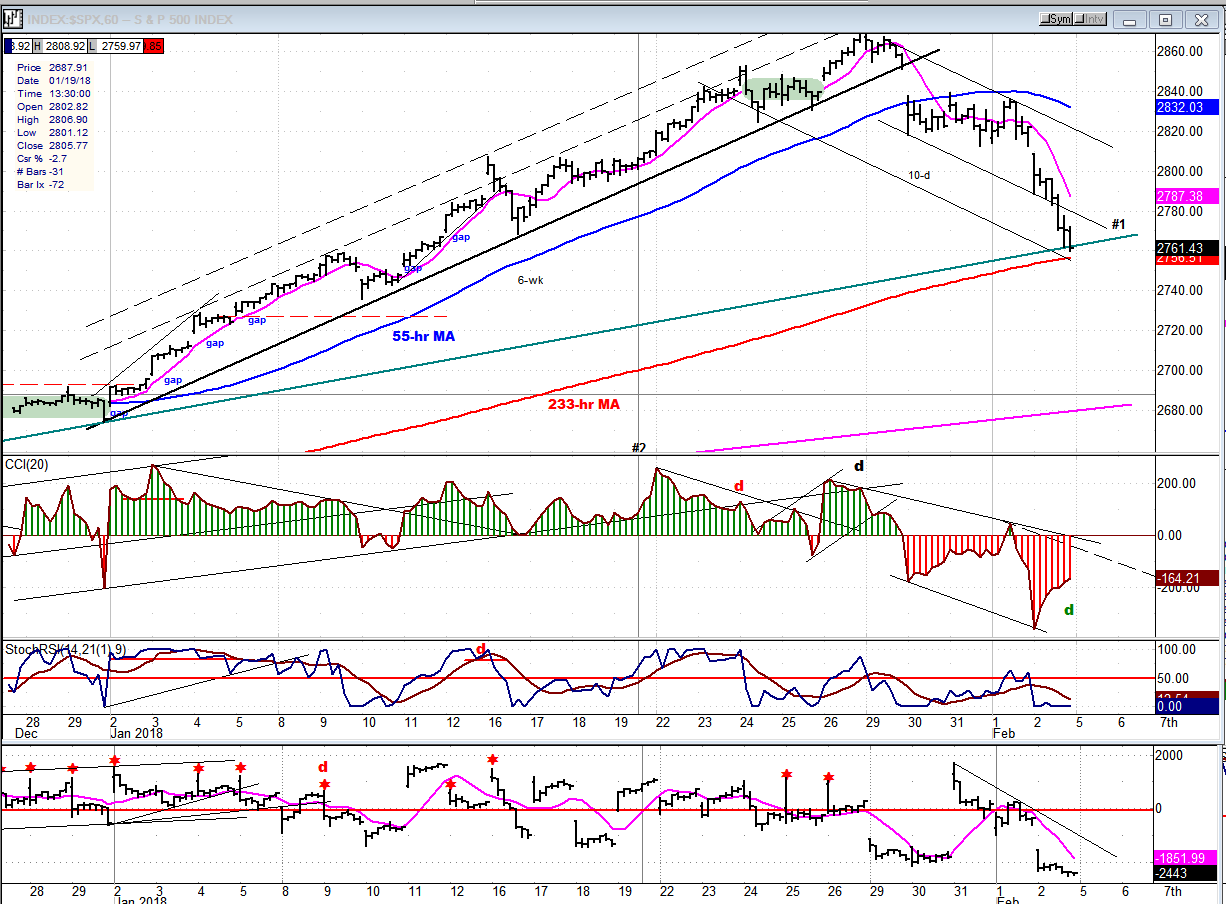
SPX Hourly Chart:
I’ll skip the daily chart and go directly to the 60m one. Last week, I discussed the value of P&F charts versus bar charts. As an example I showed the small green pattern of accumulation at the top, which was smaller than the one at the bottom, but which had a greater potential count than the latter. Well, that turned out to be an unfortunate example because that potential (which would have taken us past the 2900 level) was never realized. Instead, the index started to roll over, gapped down and could not get back in an uptrend before falling out of bed.
There are more examples on this chart that reassure us that we are not going to keep on going lower -- at least not right away. Look at where we stopped on Friday: right on trend line #1 which coincides with the 233-hr MA to provide decent support at the end of Friday’s decline. The count does extend a little lower, and on Globex the index did continue down to 2755, which is not a coincidence since Globex traders are also aware of P&F projections and usually observe them. There was only minor relief of the downside momentum at the end of the day, so the lower count range (given to subscribers) looks like a good target for Monday’s low.
Finally, positive divergence appeared for the second time last week in the CCI. The first time only led to additional distribution and lower prices. It could be more predictive of a rally, this time. On the other hand, the A/Ds were still extreme at the end of the day, so there is no bullish support there. I have repeatedly commented, mostly in my daily updates, about the odd A/D behavior (with a potential negative implication) of the past few weeks. If there was any kind of warning for this spontaneous decline, this had to be where it manifested itself.
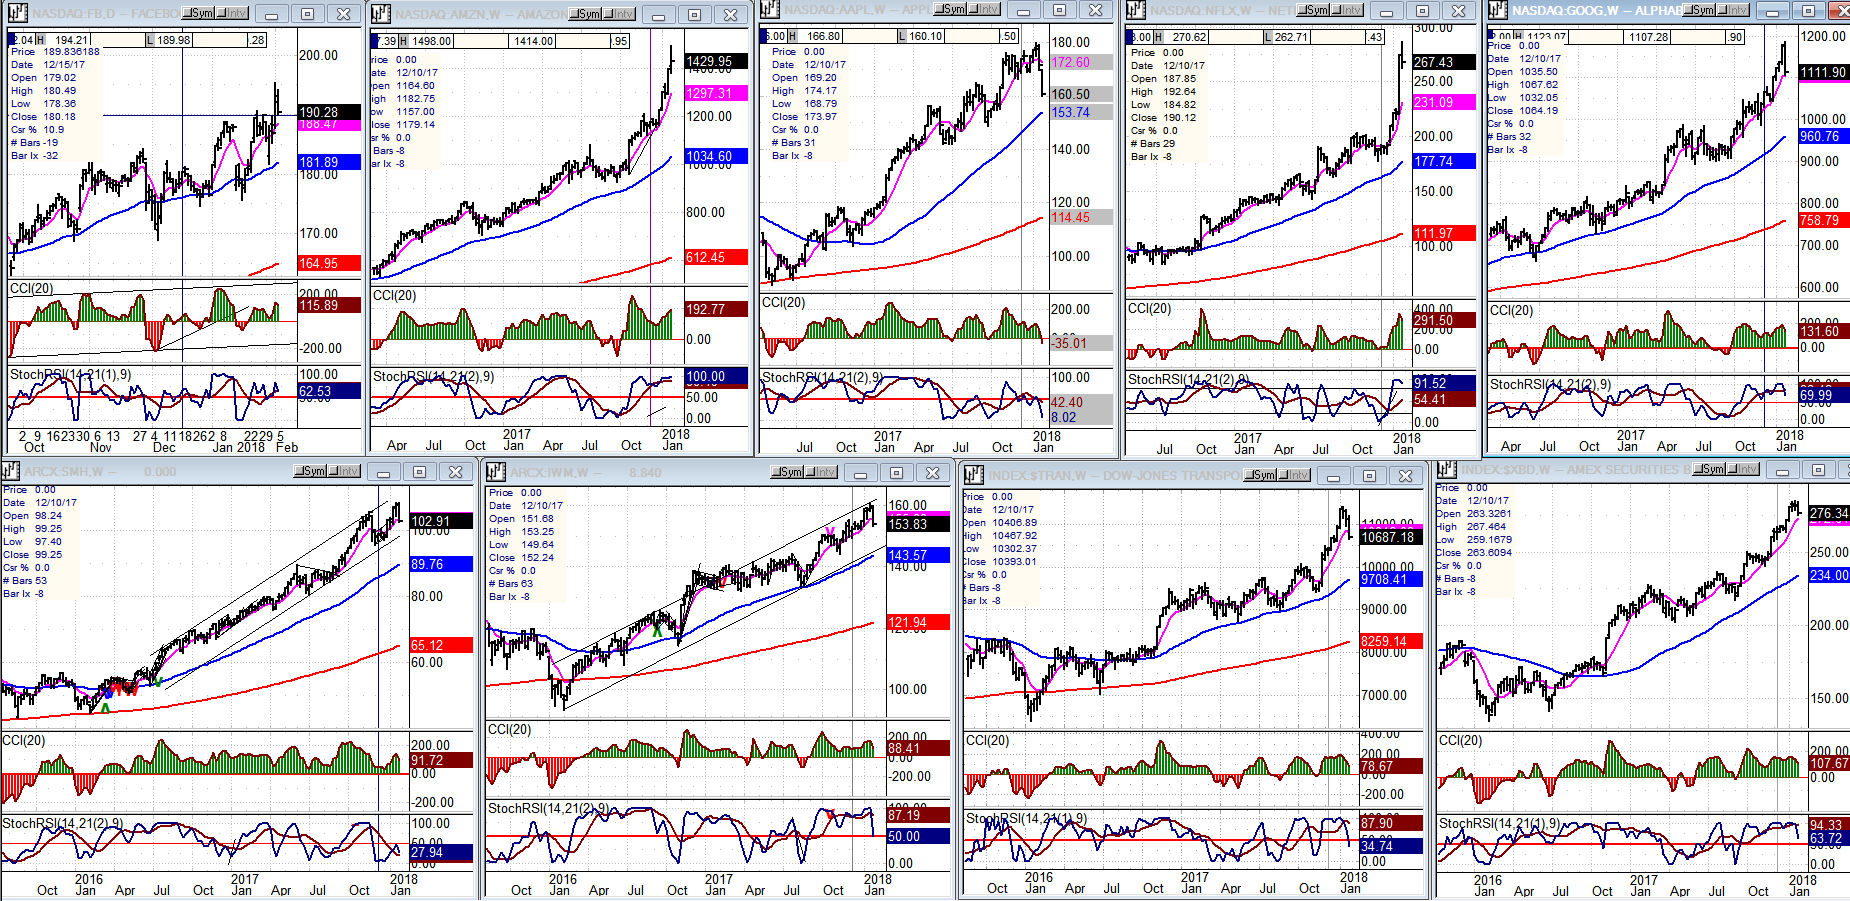
An overview of some important indexes (weekly charts)
I switched to weekly charts to compare these indices to the weekly SPX chart above. Most indices look like the SPX, except for Amazon (second, top) which is stronger. The only FAANG showing the possibility of having made an intermediate top is AAPL which formed a congestion pattern of several weeks, briefly broke above it, and then sliced right through it! This is suggestive of an intermediate top but this pattern does not appear in any of the others, or in the SPX
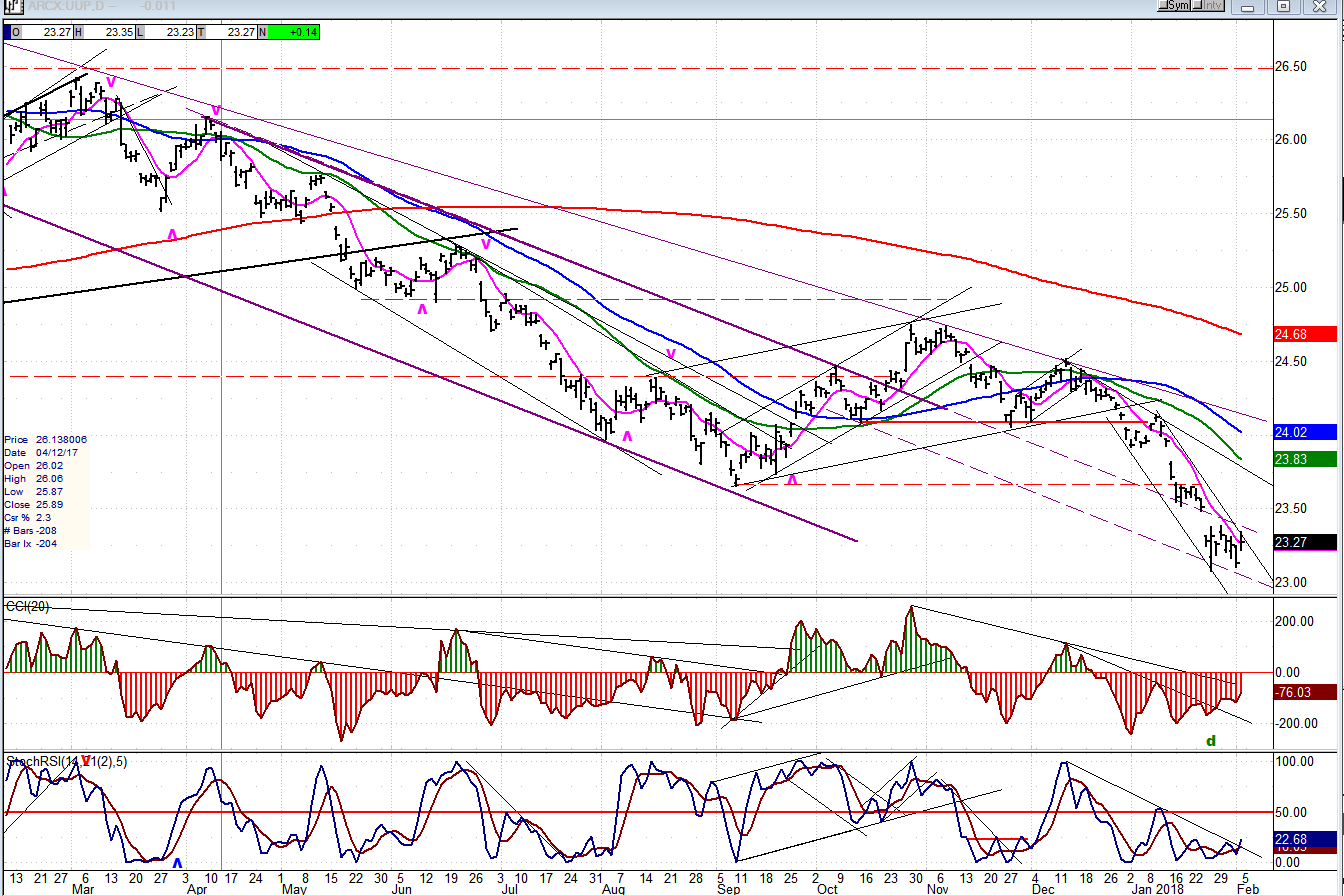
UUP (Dollar ETF)
UUP may have completed the third wave of its new decline. If so, a short consolidation which extends outside of the narriw channel should be followed by one more wave on the downside before a more reliable low point is reached.
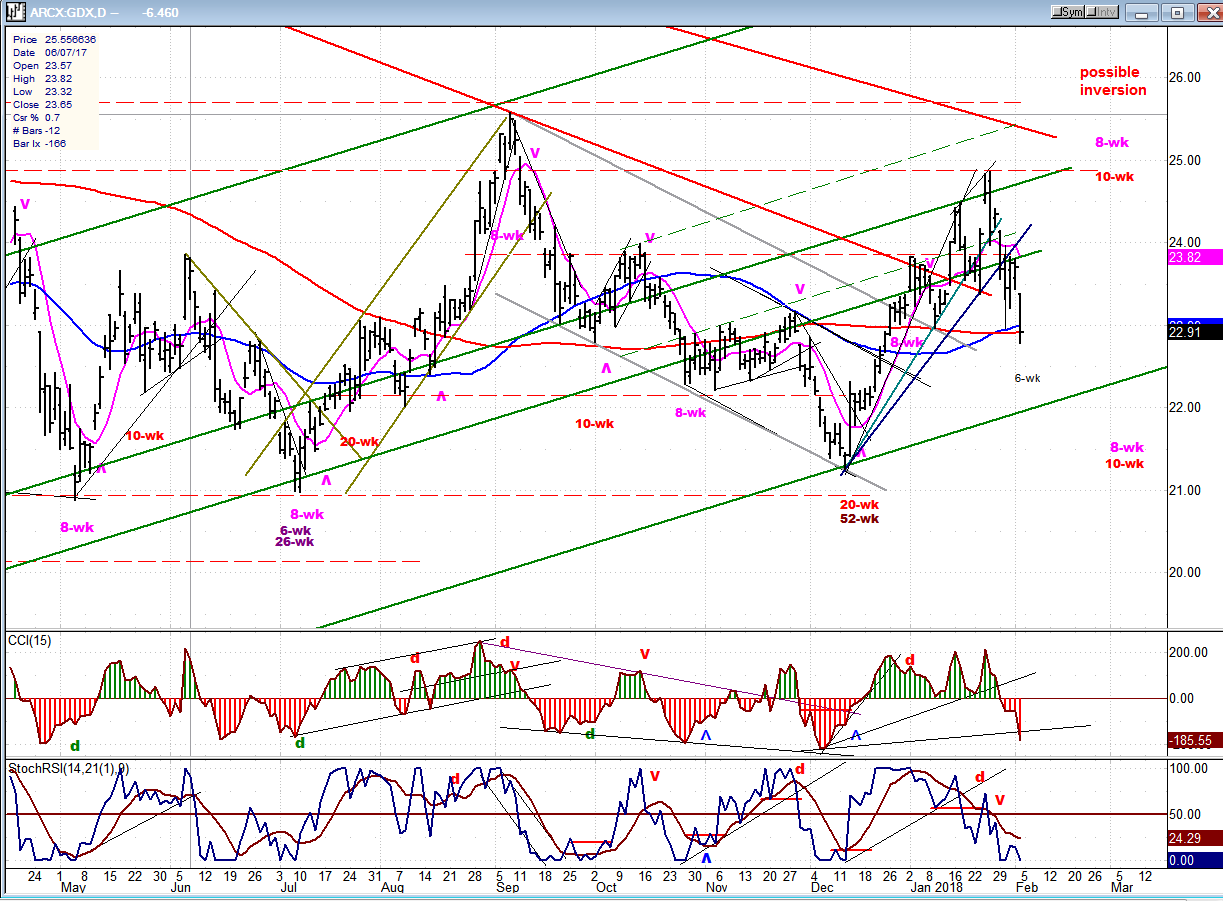
GDX (Gold Miners ETF)
GDX made a brief new high, but was not yet ready for an extension of its uptrend, and consequently pulled back sharply into the 6-week cycle low which is due next week. If it can stabilize in the next few days, it should make an attempt at resuming its uptrend, although more cycles -- which could invert – lie ahead. This possibility makes a forecast based on cycles more complicated and we will have to rely on the P&F chart and the indicators to determine the trend going forward.
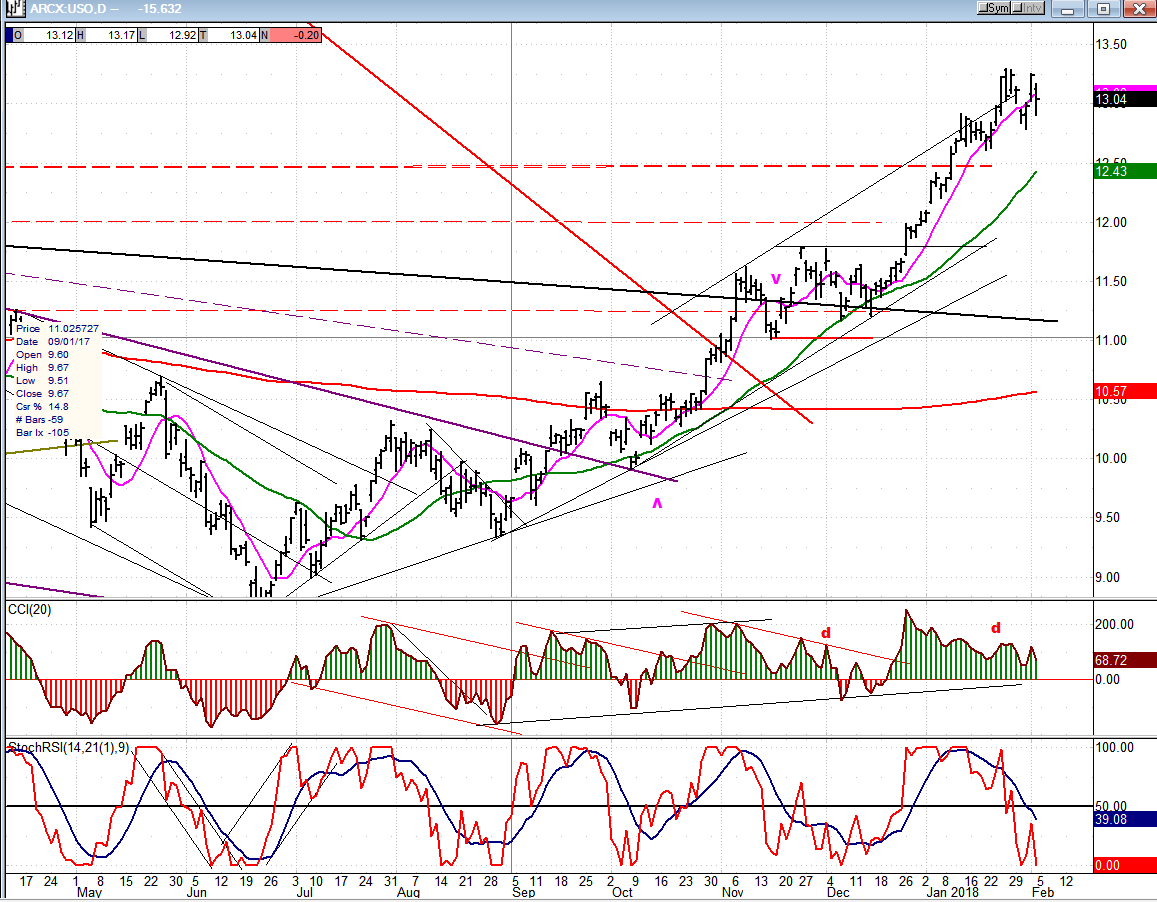
USO (United States Oil Fund)
USO has totally ignored the market correction, meaning that it should be analyzed individually and apart from the overall market. It has a good projection target of 15.00 and may therefore consolidate for a little while before proceeding higher.
Summary
Last week, principally on Friday, SPX (and the market in general) experienced the sharpest and most spontaneous correction in quite a while with little, if any, warning. For reasons stated in the above analysis, I feel that the bias does not favor the start of an intermediate correction at this time, and that more evidence will be needed if this is the case. It does not mean that after a brief oversold rally, we cannot make slightly new lows before SPX regains a more solid footing and attempts to resume its uptrend -- perhaps reaching a new high, or at least retesting the current high.
FREE TRIAL SUBSCRIPTON
With a trial subscription, you will have access to the same information that is given to paid subscribers, but for a limited time period. I think you will find that knowing how far a move can carry is one of the most useful benefits of this service, whether you are a trader or an investor -- especially when this price target is confirmed by reliable indicators which give advance warning of a market top or bottom. Furthermore, cycle analysis adds the all- important time element to the above price projections.
For a FREE 4-week trial, further subscription options, payment plans, and for general information, I encourage you to visit my website at www.marketurningpoints.com.
The above comments about the financial markets are based purely on what I consider to be sound technical analysis principles. They represent my own opinion and are not meant to be construed as trading or investment advice, but are offered as an analytical point of view which might be of interest to those who follow stock market cycles and technical analysis.
share
share
share
share
share

When Andre Gratian was a stock broker years ago, a friend introduced him to technical analysis of the market. Consequently, it is not an exaggeration to say that Andre fell in love with this approach! Ever since then, it has become an increasingly important part of his professional life. Gratian has studied the works of Wyckoff, Edwards & Magee, Edward J. Dewey (cycles) and many others. However, one of my most profitable undertaking has probably been to study Point & Figure charting, which he finds invaluable in analyzing stocks and indices. If he were restricted to one methodology, this is the one that he would choose. This well-rounded background has given him what he feels to be a special insight into the stock market, facilitating the recognition of meaningful patterns and the ‘turning points’ in all trends, whether they be short or long term. Andre feels very comfortable discussing the stock market and passing on meaningful information to others. His subscribers include individuals and money managers throughout the world. Moreover, his Newsletters are currently published on several financial sites, here and abroad.


